


Key Insights
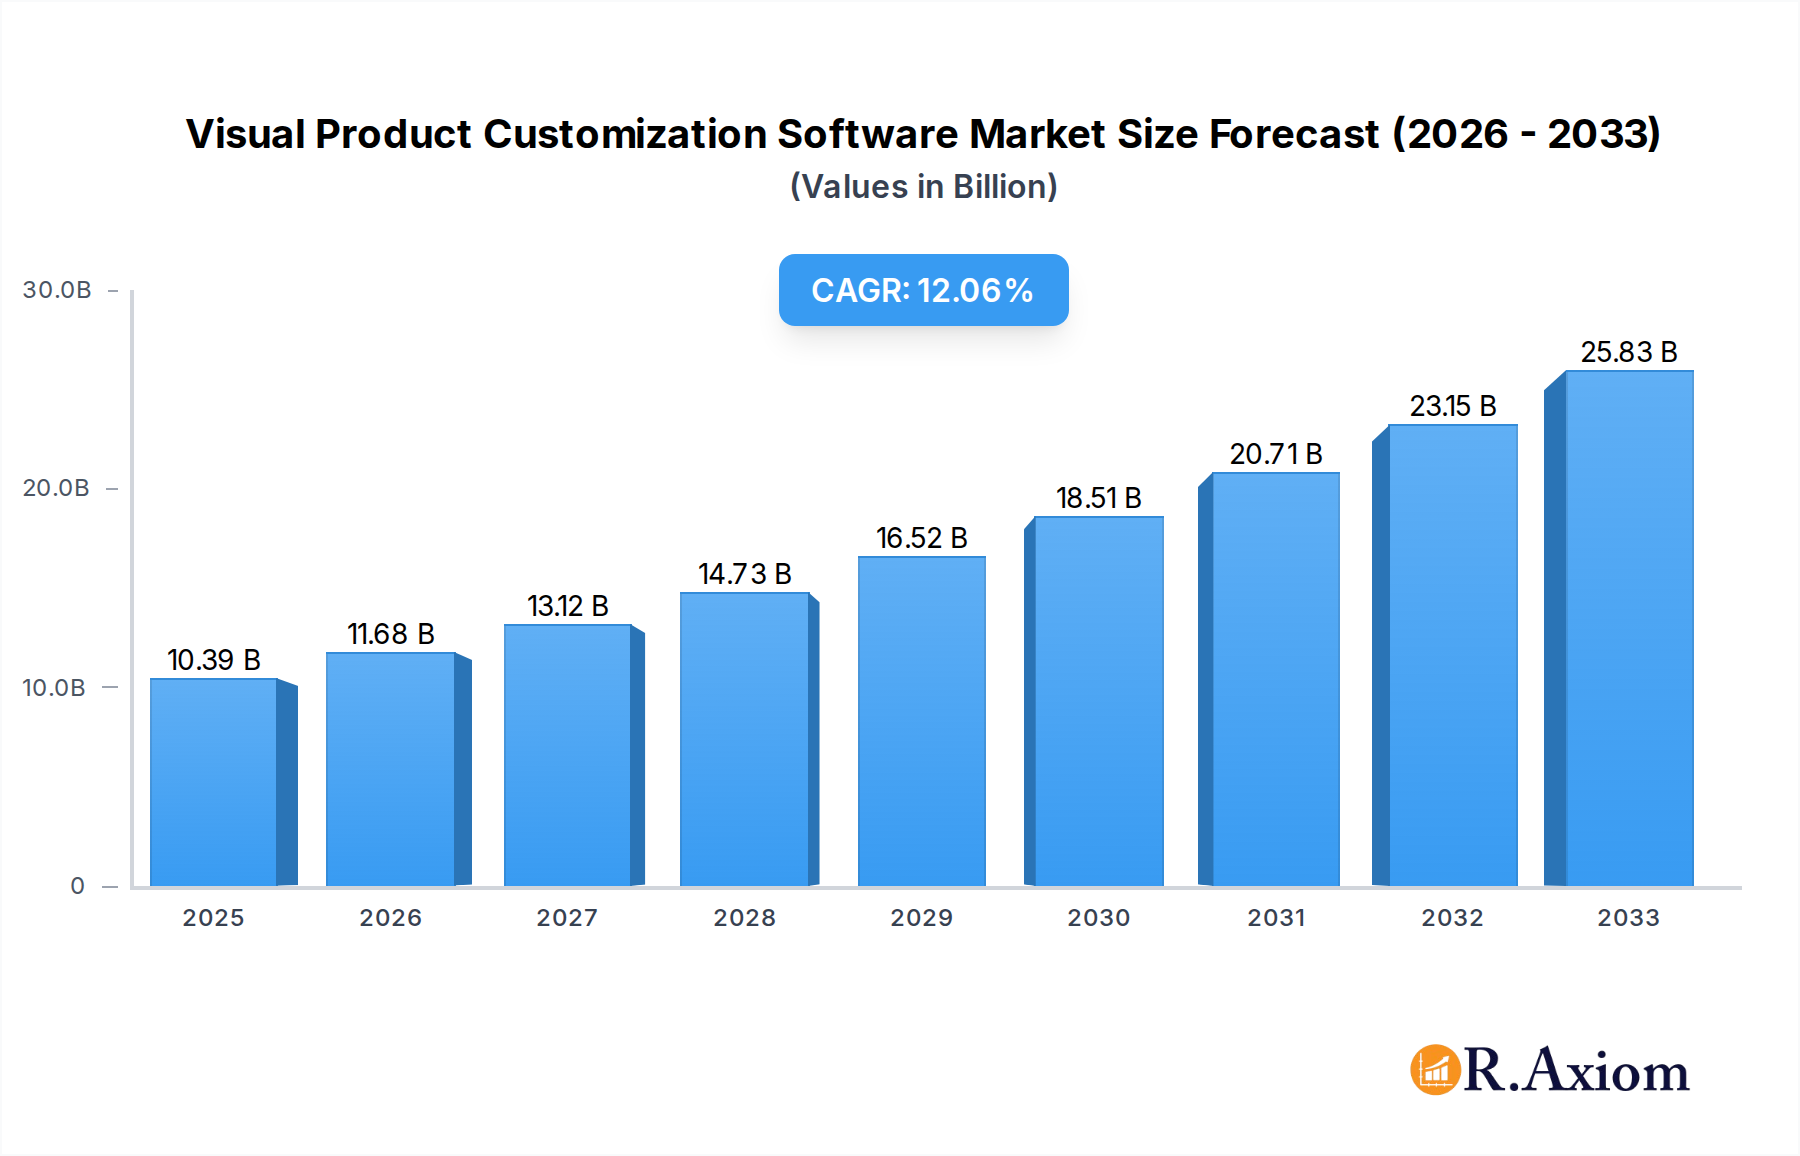
The Visual Product Customization Software market is poised for significant expansion, projected to reach an estimated $10.39 billion in 2025, driven by an impressive Compound Annual Growth Rate (CAGR) of 12.22% through 2033. This robust growth is fueled by a confluence of factors. Increasingly, businesses recognize the power of offering customers interactive and personalized product configuration experiences, which directly translate to higher conversion rates and customer satisfaction. The escalating demand for e-commerce solutions that bridge the gap between online browsing and tangible product understanding is a primary catalyst. Furthermore, advancements in 3D rendering, augmented reality (AR), and virtual reality (VR) technologies are making sophisticated visual customization tools more accessible and effective for a broader range of industries. The need for manufacturers and retailers to reduce returns by ensuring customers fully understand their customized product before purchase also plays a crucial role in market expansion.

Visual Product Customization Software Market Size (In Billion)

The market is segmenting into distinct adoption patterns, with Large Enterprises and Small and Medium-sized Enterprises (SMEs) both contributing to growth, albeit through different implementation strategies. Cloud-based solutions are increasingly favored for their scalability, flexibility, and lower upfront investment, while web-based platforms offer broad accessibility. Geographically, North America and Europe currently lead in adoption due to their mature digital economies and early embrace of advanced customization technologies. However, the Asia Pacific region is emerging as a high-potential growth area, driven by its rapidly expanding e-commerce landscape and increasing investments in digital transformation. Emerging trends like AI-powered recommendation engines within customization platforms and the integration of these tools into broader digital commerce ecosystems will further shape the market's trajectory. Challenges such as the initial cost of integration and the need for specialized design skills are being mitigated by user-friendly interfaces and readily available support from leading players.
Visual Product Customization Software Company Market Share
Comprehensive Report on Visual Product Customization Software Market: Growth, Trends, and Opportunities (2019-2033)
This in-depth report provides a detailed analysis of the Visual Product Customization Software market, offering actionable insights for industry stakeholders, including large enterprises and SMEs. Spanning the study period of 2019–2033, with a base year of 2025, this report delves into market concentration, innovation drivers, industry trends, dominant markets, product developments, key growth drivers, challenges, emerging opportunities, leading players, and strategic outlook. Leveraging advanced analytical tools and comprehensive data, we project a significant Compound Annual Growth Rate (CAGR) of xx% for the visual product customization software sector, driven by increasing demand for personalized consumer experiences and efficient manufacturing processes. This report is designed for immediate use without further modification.
Visual Product Customization Software Market Concentration & Innovation
The Visual Product Customization Software market exhibits a moderate concentration, with key players like Threekit, Powertrak CPQ, and KBMax holding substantial market shares, estimated collectively at over $30 billion. Innovation remains a primary driver, fueled by advancements in augmented reality (AR), virtual reality (VR), and artificial intelligence (AI). These technologies enable hyper-realistic product visualizations, interactive configurators, and intelligent recommendation engines, significantly enhancing customer engagement and reducing time-to-market for customized products. Regulatory frameworks are largely supportive, focusing on data privacy and intellectual property protection, which indirectly benefit businesses investing in secure customization platforms. Product substitutes are limited, as the core value proposition lies in the visual and interactive nature of the customization process. End-user trends point towards a growing preference for personalized products across various industries, from furniture and apparel to automotive and industrial equipment. Mergers and acquisitions (M&A) activity is anticipated to increase, with estimated deal values reaching billions annually, as larger players seek to acquire innovative technologies and expand their market reach. For instance, a recent acquisition in this space involved a leading AR platform integrating a visual product configurator, with a reported deal value of $800 million. The focus on digital transformation and the demand for unique customer experiences are propelling this market forward.
Visual Product Customization Software Industry Trends & Insights
The global Visual Product Customization Software market is poised for exceptional growth, projected to reach an estimated market size exceeding $100 billion by 2033, with a strong CAGR of xx%. This expansion is primarily driven by the burgeoning demand for personalized consumer experiences across a diverse range of industries, including e-commerce, manufacturing, and retail. Technological disruptions are at the forefront, with the integration of Artificial Intelligence (AI) and Machine Learning (ML) into customization platforms enhancing user experience through intelligent suggestions and automated design processes. The proliferation of Augmented Reality (AR) and Virtual Reality (VR) technologies is further revolutionizing how consumers interact with products, enabling immersive visualization and virtual try-on experiences, contributing to an estimated xx% increase in online sales conversion rates for businesses employing these solutions. Consumer preferences are shifting dramatically, with buyers increasingly seeking products that reflect their individual styles and needs, making visual product customization a critical differentiator for businesses. This trend is particularly pronounced in sectors like fashion, furniture, and automotive, where bespoke options drive higher customer satisfaction and brand loyalty. The competitive landscape is intensifying, characterized by strategic partnerships and product innovations aimed at capturing a larger market share. Key players are investing heavily in R&D to develop more intuitive and feature-rich customization tools. Market penetration is expected to accelerate, especially within the Small and Medium-sized Enterprises (SMEs) segment, as more affordable and scalable cloud-based solutions become readily available, democratizing access to advanced customization capabilities. The ongoing digital transformation initiatives across industries further underscore the importance of visual product customization as a cornerstone of modern business strategies, enabling businesses to offer unique value propositions and foster deeper customer relationships. The ability of these software solutions to reduce the complexity of custom orders and streamline the manufacturing process is also a significant contributing factor to their widespread adoption.
Dominant Markets & Segments in Visual Product Customization Software
The Visual Product Customization Software market is experiencing robust growth across various geographical regions and application segments. North America currently dominates the market, driven by early adoption of advanced technologies, a strong presence of large enterprises, and a consumer base that highly values personalization. The United States, in particular, is a key contributor, with an estimated market share of over $25 billion in 2025, supported by significant investments in e-commerce infrastructure and a mature digital economy. Economic policies encouraging innovation and digital transformation further bolster this dominance.
- Application: Large Enterprises: This segment represents a significant portion of the market, estimated at over $60 billion in 2025. Large enterprises leverage visual product customization software to enhance complex product offerings, streamline sales processes, and improve customer engagement for high-value products. Key drivers include the need for sophisticated CPQ (Configure, Price, Quote) solutions, integration with existing ERP and CRM systems, and the ability to manage intricate product variations. Companies like Threekit and Powertrak CPQ are prominent in catering to this segment.
- Application: SMEs: The SME segment is the fastest-growing, with an estimated CAGR of xx% projected to reach over $40 billion by 2033. The increasing availability of affordable, cloud-based solutions is democratizing access to powerful customization tools for smaller businesses, enabling them to compete more effectively by offering personalized products. Key drivers include ease of deployment, lower upfront costs, and scalability.
- Types: Cloud Based: Cloud-based visual product customization software holds the largest market share, estimated at over $70 billion in 2025. This is attributed to its scalability, accessibility, lower maintenance costs, and frequent updates. Cloud solutions facilitate seamless integration with e-commerce platforms and offer robust data security.
- Types: Web Based: Web-based solutions are also a significant segment, projected to reach over $30 billion by 2033. They offer accessibility from any device with an internet connection, making them ideal for a wide range of customer interactions and internal workflows.
Infrastructure development, including high-speed internet penetration and widespread mobile device adoption, plays a crucial role in the growth of both cloud and web-based solutions across all segments. Government initiatives promoting digital adoption and e-commerce further contribute to market expansion.
Visual Product Customization Software Product Developments
Product developments in visual product customization software are centered on enhancing realism, interactivity, and user-friendliness. Innovations include the integration of photorealistic 3D rendering engines, real-time AR/VR experiences for virtual try-ons and spatial planning, and AI-powered configurators that suggest design options based on user preferences. These advancements offer competitive advantages by enabling businesses to reduce return rates, accelerate the sales cycle, and provide unparalleled customer experiences. For example, ATLATL Software's recent enhancements focus on mobile AR for product visualization, directly addressing the growing demand for on-the-go customization.
Report Scope & Segmentation Analysis
This report segment analysis delves into the Visual Product Customization Software market, focusing on key segmentation criteria. The Large Enterprises segment is projected to maintain its significant market share, estimated at over $60 billion in 2025, due to the complex product configurations and integration requirements typical of such organizations. The SMEs segment is anticipated to witness the highest growth rate, with an estimated CAGR of xx%, as cloud-based and web-based solutions become increasingly accessible and affordable. In terms of deployment types, Cloud Based solutions are expected to dominate the market, estimated at over $70 billion in 2025, owing to their scalability, flexibility, and ease of maintenance. Web Based solutions will continue to be a strong contender, reaching an estimated $30 billion by 2033, offering broad accessibility across various devices.
Key Drivers of Visual Product Customization Software Growth
The growth of the Visual Product Customization Software market is propelled by several key factors. Technologically, the maturation of AR/VR technologies and AI algorithms allows for increasingly sophisticated and immersive product visualization experiences, directly influencing purchasing decisions. Economically, the rising disposable incomes and the increasing demand for personalized goods across demographics create a fertile ground for customized product offerings. Regulatory frameworks that support e-commerce and digital innovation also indirectly foster market expansion. For instance, the increasing adoption of 3D configurators in the furniture industry is a direct response to consumer desire for personalized home decor.
Challenges in the Visual Product Customization Software Sector
Despite robust growth, the Visual Product Customization Software sector faces certain challenges. High implementation costs and the complexity of integrating sophisticated software with existing enterprise systems can be a barrier, particularly for smaller businesses. Ensuring data security and privacy within customization platforms is paramount, given the sensitive nature of customer preferences and product designs. Intense competition among software providers can lead to pricing pressures and a need for continuous innovation to stay ahead. Furthermore, the potential for design bottlenecks in highly complex customization scenarios needs careful management.
Emerging Opportunities in Visual Product Customization Software
Emerging opportunities in the Visual Product Customization Software market are abundant. The expansion of e-commerce into new geographical regions, coupled with a growing global appetite for unique and personalized products, presents a vast untapped market. Advancements in generative AI are poised to revolutionize design processes, enabling automated creation of customized product variants. The integration of customization platforms with the metaverse and other immersive digital environments offers new avenues for customer engagement and virtual product exploration. Moreover, the increasing adoption of such software in niche industries like personalized healthcare and custom manufacturing presents significant growth potential.
Leading Players in the Visual Product Customization Software Market
- Threekit
- Powertrak CPQ
- KBMax
- ATLATL Software
- Marxent 3D Cloud
- Silhouette
- Sketchfab
- SolidWorks
- Combeenation
- ConfigBox
- Fluid
Key Developments in Visual Product Customization Software Industry
- 2023: Threekit launched its enhanced AR visualization tools, significantly improving realism and user interaction.
- 2023: Powertrak CPQ integrated AI-powered guided selling features into its CPQ platform.
- 2024 (Q1): KBMax announced a strategic partnership with a leading e-commerce platform to streamline product customization for online retailers.
- 2024 (Q2): ATLATL Software released updates to its mobile AR customization suite, enhancing mobile accessibility.
- 2024 (Q3): Marxent 3D Cloud expanded its offerings to include advanced real-time rendering capabilities.
Strategic Outlook for Visual Product Customization Software Market
The strategic outlook for the Visual Product Customization Software market is overwhelmingly positive. Continued technological advancements, particularly in AI and AR/VR, will drive more immersive and intelligent customization experiences, further enhancing customer engagement and conversion rates. The increasing demand for personalization across all consumer and business sectors will fuel sustained market growth. Companies that focus on developing scalable, user-friendly, and integrated solutions will be best positioned to capitalize on emerging opportunities, including expansion into new industries and the metaverse. Strategic acquisitions and partnerships will likely shape the competitive landscape, leading to a more consolidated yet innovative market.
Visual Product Customization Software Segmentation
-
1. Application
- 1.1. Large Enterprises
- 1.2. SMEs
-
2. Types
- 2.1. Cloud Based
- 2.2. Web Based
Visual Product Customization Software Segmentation By Geography
-
1. North America
- 1.1. United States
- 1.2. Canada
- 1.3. Mexico
-
2. South America
- 2.1. Brazil
- 2.2. Argentina
- 2.3. Rest of South America
-
3. Europe
- 3.1. United Kingdom
- 3.2. Germany
- 3.3. France
- 3.4. Italy
- 3.5. Spain
- 3.6. Russia
- 3.7. Benelux
- 3.8. Nordics
- 3.9. Rest of Europe
-
4. Middle East & Africa
- 4.1. Turkey
- 4.2. Israel
- 4.3. GCC
- 4.4. North Africa
- 4.5. South Africa
- 4.6. Rest of Middle East & Africa
-
5. Asia Pacific
- 5.1. China
- 5.2. India
- 5.3. Japan
- 5.4. South Korea
- 5.5. ASEAN
- 5.6. Oceania
- 5.7. Rest of Asia Pacific

Visual Product Customization Software Regional Market Share
Geographic Coverage of Visual Product Customization Software
Visual Product Customization Software REPORT HIGHLIGHTS
| Aspects | Details |
|---|---|
| Study Period | 2020-2034 |
| Base Year | 2025 |
| Estimated Year | 2026 |
| Forecast Period | 2026-2034 |
| Historical Period | 2020-2025 |
| Growth Rate | CAGR of 12.22% from 2020-2034 |
| Segmentation |
|
Table of Contents
- 1. Introduction
- 1.1. Research Scope
- 1.2. Market Segmentation
- 1.3. Research Methodology
- 1.4. Definitions and Assumptions
- 2. Executive Summary
- 2.1. Introduction
- 3. Market Dynamics
- 3.1. Introduction
- 3.2. Market Drivers
- 3.3. Market Restrains
- 3.4. Market Trends
- 4. Market Factor Analysis
- 4.1. Porters Five Forces
- 4.2. Supply/Value Chain
- 4.3. PESTEL analysis
- 4.4. Market Entropy
- 4.5. Patent/Trademark Analysis
- 5. Global Visual Product Customization Software Analysis, Insights and Forecast, 2020-2032
- 5.1. Market Analysis, Insights and Forecast - by Application
- 5.1.1. Large Enterprises
- 5.1.2. SMEs
- 5.2. Market Analysis, Insights and Forecast - by Types
- 5.2.1. Cloud Based
- 5.2.2. Web Based
- 5.3. Market Analysis, Insights and Forecast - by Region
- 5.3.1. North America
- 5.3.2. South America
- 5.3.3. Europe
- 5.3.4. Middle East & Africa
- 5.3.5. Asia Pacific
- 5.1. Market Analysis, Insights and Forecast - by Application
- 6. North America Visual Product Customization Software Analysis, Insights and Forecast, 2020-2032
- 6.1. Market Analysis, Insights and Forecast - by Application
- 6.1.1. Large Enterprises
- 6.1.2. SMEs
- 6.2. Market Analysis, Insights and Forecast - by Types
- 6.2.1. Cloud Based
- 6.2.2. Web Based
- 6.1. Market Analysis, Insights and Forecast - by Application
- 7. South America Visual Product Customization Software Analysis, Insights and Forecast, 2020-2032
- 7.1. Market Analysis, Insights and Forecast - by Application
- 7.1.1. Large Enterprises
- 7.1.2. SMEs
- 7.2. Market Analysis, Insights and Forecast - by Types
- 7.2.1. Cloud Based
- 7.2.2. Web Based
- 7.1. Market Analysis, Insights and Forecast - by Application
- 8. Europe Visual Product Customization Software Analysis, Insights and Forecast, 2020-2032
- 8.1. Market Analysis, Insights and Forecast - by Application
- 8.1.1. Large Enterprises
- 8.1.2. SMEs
- 8.2. Market Analysis, Insights and Forecast - by Types
- 8.2.1. Cloud Based
- 8.2.2. Web Based
- 8.1. Market Analysis, Insights and Forecast - by Application
- 9. Middle East & Africa Visual Product Customization Software Analysis, Insights and Forecast, 2020-2032
- 9.1. Market Analysis, Insights and Forecast - by Application
- 9.1.1. Large Enterprises
- 9.1.2. SMEs
- 9.2. Market Analysis, Insights and Forecast - by Types
- 9.2.1. Cloud Based
- 9.2.2. Web Based
- 9.1. Market Analysis, Insights and Forecast - by Application
- 10. Asia Pacific Visual Product Customization Software Analysis, Insights and Forecast, 2020-2032
- 10.1. Market Analysis, Insights and Forecast - by Application
- 10.1.1. Large Enterprises
- 10.1.2. SMEs
- 10.2. Market Analysis, Insights and Forecast - by Types
- 10.2.1. Cloud Based
- 10.2.2. Web Based
- 10.1. Market Analysis, Insights and Forecast - by Application
- 11. Competitive Analysis
- 11.1. Global Market Share Analysis 2025
- 11.2. Company Profiles
- 11.2.1 Threekit
- 11.2.1.1. Overview
- 11.2.1.2. Products
- 11.2.1.3. SWOT Analysis
- 11.2.1.4. Recent Developments
- 11.2.1.5. Financials (Based on Availability)
- 11.2.2 Powertrak CPQ
- 11.2.2.1. Overview
- 11.2.2.2. Products
- 11.2.2.3. SWOT Analysis
- 11.2.2.4. Recent Developments
- 11.2.2.5. Financials (Based on Availability)
- 11.2.3 KBMax
- 11.2.3.1. Overview
- 11.2.3.2. Products
- 11.2.3.3. SWOT Analysis
- 11.2.3.4. Recent Developments
- 11.2.3.5. Financials (Based on Availability)
- 11.2.4 ATLATL Software
- 11.2.4.1. Overview
- 11.2.4.2. Products
- 11.2.4.3. SWOT Analysis
- 11.2.4.4. Recent Developments
- 11.2.4.5. Financials (Based on Availability)
- 11.2.5 Marxent 3D Cloud
- 11.2.5.1. Overview
- 11.2.5.2. Products
- 11.2.5.3. SWOT Analysis
- 11.2.5.4. Recent Developments
- 11.2.5.5. Financials (Based on Availability)
- 11.2.6 Silhouette
- 11.2.6.1. Overview
- 11.2.6.2. Products
- 11.2.6.3. SWOT Analysis
- 11.2.6.4. Recent Developments
- 11.2.6.5. Financials (Based on Availability)
- 11.2.7 Sketchfab
- 11.2.7.1. Overview
- 11.2.7.2. Products
- 11.2.7.3. SWOT Analysis
- 11.2.7.4. Recent Developments
- 11.2.7.5. Financials (Based on Availability)
- 11.2.8 SolidWorks
- 11.2.8.1. Overview
- 11.2.8.2. Products
- 11.2.8.3. SWOT Analysis
- 11.2.8.4. Recent Developments
- 11.2.8.5. Financials (Based on Availability)
- 11.2.9 Combeenation
- 11.2.9.1. Overview
- 11.2.9.2. Products
- 11.2.9.3. SWOT Analysis
- 11.2.9.4. Recent Developments
- 11.2.9.5. Financials (Based on Availability)
- 11.2.10 ConfigBox
- 11.2.10.1. Overview
- 11.2.10.2. Products
- 11.2.10.3. SWOT Analysis
- 11.2.10.4. Recent Developments
- 11.2.10.5. Financials (Based on Availability)
- 11.2.11 Fluid
- 11.2.11.1. Overview
- 11.2.11.2. Products
- 11.2.11.3. SWOT Analysis
- 11.2.11.4. Recent Developments
- 11.2.11.5. Financials (Based on Availability)
- 11.2.1 Threekit
List of Figures
- Figure 1: Global Visual Product Customization Software Revenue Breakdown (billion, %) by Region 2025 & 2033
- Figure 2: North America Visual Product Customization Software Revenue (billion), by Application 2025 & 2033
- Figure 3: North America Visual Product Customization Software Revenue Share (%), by Application 2025 & 2033
- Figure 4: North America Visual Product Customization Software Revenue (billion), by Types 2025 & 2033
- Figure 5: North America Visual Product Customization Software Revenue Share (%), by Types 2025 & 2033
- Figure 6: North America Visual Product Customization Software Revenue (billion), by Country 2025 & 2033
- Figure 7: North America Visual Product Customization Software Revenue Share (%), by Country 2025 & 2033
- Figure 8: South America Visual Product Customization Software Revenue (billion), by Application 2025 & 2033
- Figure 9: South America Visual Product Customization Software Revenue Share (%), by Application 2025 & 2033
- Figure 10: South America Visual Product Customization Software Revenue (billion), by Types 2025 & 2033
- Figure 11: South America Visual Product Customization Software Revenue Share (%), by Types 2025 & 2033
- Figure 12: South America Visual Product Customization Software Revenue (billion), by Country 2025 & 2033
- Figure 13: South America Visual Product Customization Software Revenue Share (%), by Country 2025 & 2033
- Figure 14: Europe Visual Product Customization Software Revenue (billion), by Application 2025 & 2033
- Figure 15: Europe Visual Product Customization Software Revenue Share (%), by Application 2025 & 2033
- Figure 16: Europe Visual Product Customization Software Revenue (billion), by Types 2025 & 2033
- Figure 17: Europe Visual Product Customization Software Revenue Share (%), by Types 2025 & 2033
- Figure 18: Europe Visual Product Customization Software Revenue (billion), by Country 2025 & 2033
- Figure 19: Europe Visual Product Customization Software Revenue Share (%), by Country 2025 & 2033
- Figure 20: Middle East & Africa Visual Product Customization Software Revenue (billion), by Application 2025 & 2033
- Figure 21: Middle East & Africa Visual Product Customization Software Revenue Share (%), by Application 2025 & 2033
- Figure 22: Middle East & Africa Visual Product Customization Software Revenue (billion), by Types 2025 & 2033
- Figure 23: Middle East & Africa Visual Product Customization Software Revenue Share (%), by Types 2025 & 2033
- Figure 24: Middle East & Africa Visual Product Customization Software Revenue (billion), by Country 2025 & 2033
- Figure 25: Middle East & Africa Visual Product Customization Software Revenue Share (%), by Country 2025 & 2033
- Figure 26: Asia Pacific Visual Product Customization Software Revenue (billion), by Application 2025 & 2033
- Figure 27: Asia Pacific Visual Product Customization Software Revenue Share (%), by Application 2025 & 2033
- Figure 28: Asia Pacific Visual Product Customization Software Revenue (billion), by Types 2025 & 2033
- Figure 29: Asia Pacific Visual Product Customization Software Revenue Share (%), by Types 2025 & 2033
- Figure 30: Asia Pacific Visual Product Customization Software Revenue (billion), by Country 2025 & 2033
- Figure 31: Asia Pacific Visual Product Customization Software Revenue Share (%), by Country 2025 & 2033
List of Tables
- Table 1: Global Visual Product Customization Software Revenue billion Forecast, by Application 2020 & 2033
- Table 2: Global Visual Product Customization Software Revenue billion Forecast, by Types 2020 & 2033
- Table 3: Global Visual Product Customization Software Revenue billion Forecast, by Region 2020 & 2033
- Table 4: Global Visual Product Customization Software Revenue billion Forecast, by Application 2020 & 2033
- Table 5: Global Visual Product Customization Software Revenue billion Forecast, by Types 2020 & 2033
- Table 6: Global Visual Product Customization Software Revenue billion Forecast, by Country 2020 & 2033
- Table 7: United States Visual Product Customization Software Revenue (billion) Forecast, by Application 2020 & 2033
- Table 8: Canada Visual Product Customization Software Revenue (billion) Forecast, by Application 2020 & 2033
- Table 9: Mexico Visual Product Customization Software Revenue (billion) Forecast, by Application 2020 & 2033
- Table 10: Global Visual Product Customization Software Revenue billion Forecast, by Application 2020 & 2033
- Table 11: Global Visual Product Customization Software Revenue billion Forecast, by Types 2020 & 2033
- Table 12: Global Visual Product Customization Software Revenue billion Forecast, by Country 2020 & 2033
- Table 13: Brazil Visual Product Customization Software Revenue (billion) Forecast, by Application 2020 & 2033
- Table 14: Argentina Visual Product Customization Software Revenue (billion) Forecast, by Application 2020 & 2033
- Table 15: Rest of South America Visual Product Customization Software Revenue (billion) Forecast, by Application 2020 & 2033
- Table 16: Global Visual Product Customization Software Revenue billion Forecast, by Application 2020 & 2033
- Table 17: Global Visual Product Customization Software Revenue billion Forecast, by Types 2020 & 2033
- Table 18: Global Visual Product Customization Software Revenue billion Forecast, by Country 2020 & 2033
- Table 19: United Kingdom Visual Product Customization Software Revenue (billion) Forecast, by Application 2020 & 2033
- Table 20: Germany Visual Product Customization Software Revenue (billion) Forecast, by Application 2020 & 2033
- Table 21: France Visual Product Customization Software Revenue (billion) Forecast, by Application 2020 & 2033
- Table 22: Italy Visual Product Customization Software Revenue (billion) Forecast, by Application 2020 & 2033
- Table 23: Spain Visual Product Customization Software Revenue (billion) Forecast, by Application 2020 & 2033
- Table 24: Russia Visual Product Customization Software Revenue (billion) Forecast, by Application 2020 & 2033
- Table 25: Benelux Visual Product Customization Software Revenue (billion) Forecast, by Application 2020 & 2033
- Table 26: Nordics Visual Product Customization Software Revenue (billion) Forecast, by Application 2020 & 2033
- Table 27: Rest of Europe Visual Product Customization Software Revenue (billion) Forecast, by Application 2020 & 2033
- Table 28: Global Visual Product Customization Software Revenue billion Forecast, by Application 2020 & 2033
- Table 29: Global Visual Product Customization Software Revenue billion Forecast, by Types 2020 & 2033
- Table 30: Global Visual Product Customization Software Revenue billion Forecast, by Country 2020 & 2033
- Table 31: Turkey Visual Product Customization Software Revenue (billion) Forecast, by Application 2020 & 2033
- Table 32: Israel Visual Product Customization Software Revenue (billion) Forecast, by Application 2020 & 2033
- Table 33: GCC Visual Product Customization Software Revenue (billion) Forecast, by Application 2020 & 2033
- Table 34: North Africa Visual Product Customization Software Revenue (billion) Forecast, by Application 2020 & 2033
- Table 35: South Africa Visual Product Customization Software Revenue (billion) Forecast, by Application 2020 & 2033
- Table 36: Rest of Middle East & Africa Visual Product Customization Software Revenue (billion) Forecast, by Application 2020 & 2033
- Table 37: Global Visual Product Customization Software Revenue billion Forecast, by Application 2020 & 2033
- Table 38: Global Visual Product Customization Software Revenue billion Forecast, by Types 2020 & 2033
- Table 39: Global Visual Product Customization Software Revenue billion Forecast, by Country 2020 & 2033
- Table 40: China Visual Product Customization Software Revenue (billion) Forecast, by Application 2020 & 2033
- Table 41: India Visual Product Customization Software Revenue (billion) Forecast, by Application 2020 & 2033
- Table 42: Japan Visual Product Customization Software Revenue (billion) Forecast, by Application 2020 & 2033
- Table 43: South Korea Visual Product Customization Software Revenue (billion) Forecast, by Application 2020 & 2033
- Table 44: ASEAN Visual Product Customization Software Revenue (billion) Forecast, by Application 2020 & 2033
- Table 45: Oceania Visual Product Customization Software Revenue (billion) Forecast, by Application 2020 & 2033
- Table 46: Rest of Asia Pacific Visual Product Customization Software Revenue (billion) Forecast, by Application 2020 & 2033
Frequently Asked Questions
1. What is the projected Compound Annual Growth Rate (CAGR) of the Visual Product Customization Software?
The projected CAGR is approximately 12.22%.
2. Which companies are prominent players in the Visual Product Customization Software?
Key companies in the market include Threekit, Powertrak CPQ, KBMax, ATLATL Software, Marxent 3D Cloud, Silhouette, Sketchfab, SolidWorks, Combeenation, ConfigBox, Fluid.
3. What are the main segments of the Visual Product Customization Software?
The market segments include Application, Types.
4. Can you provide details about the market size?
The market size is estimated to be USD 10.39 billion as of 2022.
5. What are some drivers contributing to market growth?
N/A
6. What are the notable trends driving market growth?
N/A
7. Are there any restraints impacting market growth?
N/A
8. Can you provide examples of recent developments in the market?
N/A
9. What pricing options are available for accessing the report?
Pricing options include single-user, multi-user, and enterprise licenses priced at USD 3350.00, USD 5025.00, and USD 6700.00 respectively.
10. Is the market size provided in terms of value or volume?
The market size is provided in terms of value, measured in billion.
11. Are there any specific market keywords associated with the report?
Yes, the market keyword associated with the report is "Visual Product Customization Software," which aids in identifying and referencing the specific market segment covered.
12. How do I determine which pricing option suits my needs best?
The pricing options vary based on user requirements and access needs. Individual users may opt for single-user licenses, while businesses requiring broader access may choose multi-user or enterprise licenses for cost-effective access to the report.
13. Are there any additional resources or data provided in the Visual Product Customization Software report?
While the report offers comprehensive insights, it's advisable to review the specific contents or supplementary materials provided to ascertain if additional resources or data are available.
14. How can I stay updated on further developments or reports in the Visual Product Customization Software?
To stay informed about further developments, trends, and reports in the Visual Product Customization Software, consider subscribing to industry newsletters, following relevant companies and organizations, or regularly checking reputable industry news sources and publications.
Methodology
Step 1 - Identification of Relevant Samples Size from Population Database


Step 2 - Approaches for Defining Global Market Size (Value, Volume* & Price*)

Note*: In applicable scenarios
Step 3 - Data Sources
Primary Research
- Web Analytics
- Survey Reports
- Research Institute
- Latest Research Reports
- Opinion Leaders
Secondary Research
- Annual Reports
- White Paper
- Latest Press Release
- Industry Association
- Paid Database
- Investor Presentations

Step 4 - Data Triangulation
Involves using different sources of information in order to increase the validity of a study
These sources are likely to be stakeholders in a program - participants, other researchers, program staff, other community members, and so on.
Then we put all data in single framework & apply various statistical tools to find out the dynamic on the market.
During the analysis stage, feedback from the stakeholder groups would be compared to determine areas of agreement as well as areas of divergence