

Key Insights
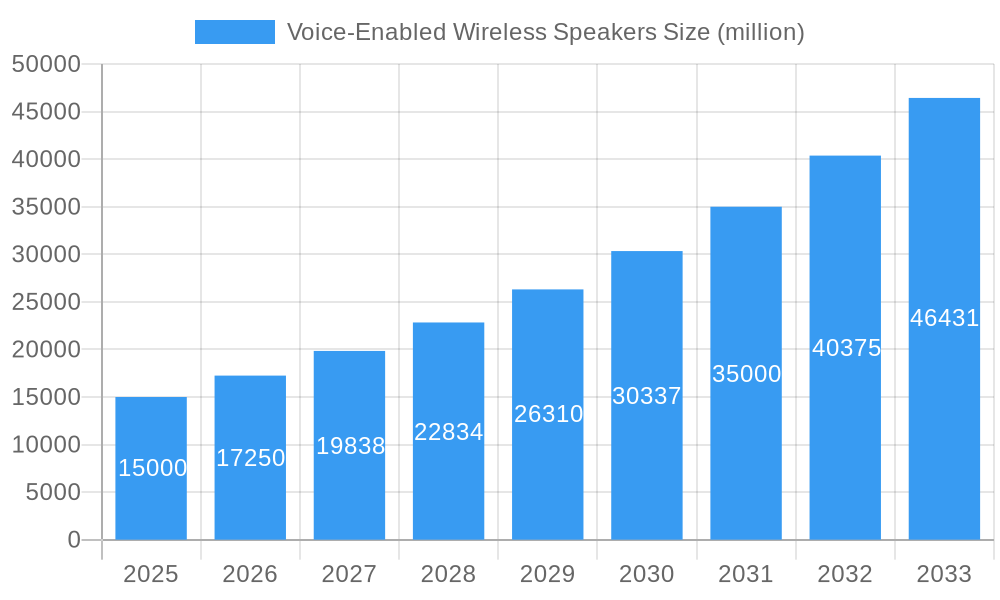
The global market for voice-enabled wireless speakers is experiencing robust growth, driven by increasing demand for smart home devices, advancements in voice recognition technology, and the rising popularity of music streaming services. The market, estimated at $15 billion in 2025, is projected to exhibit a Compound Annual Growth Rate (CAGR) of 15% from 2025 to 2033, reaching approximately $45 billion by 2033. Key drivers include the affordability and ease of use of these speakers, their integration with other smart home ecosystems, and the continuous improvement in audio quality and features. Consumers are increasingly adopting these devices for hands-free control of music playback, smart home functions, and voice assistants, fueling market expansion. Competition among established players like Google, Amazon, Apple, and Samsung, along with emerging brands, further intensifies innovation and drives down prices, making these devices accessible to a broader consumer base.
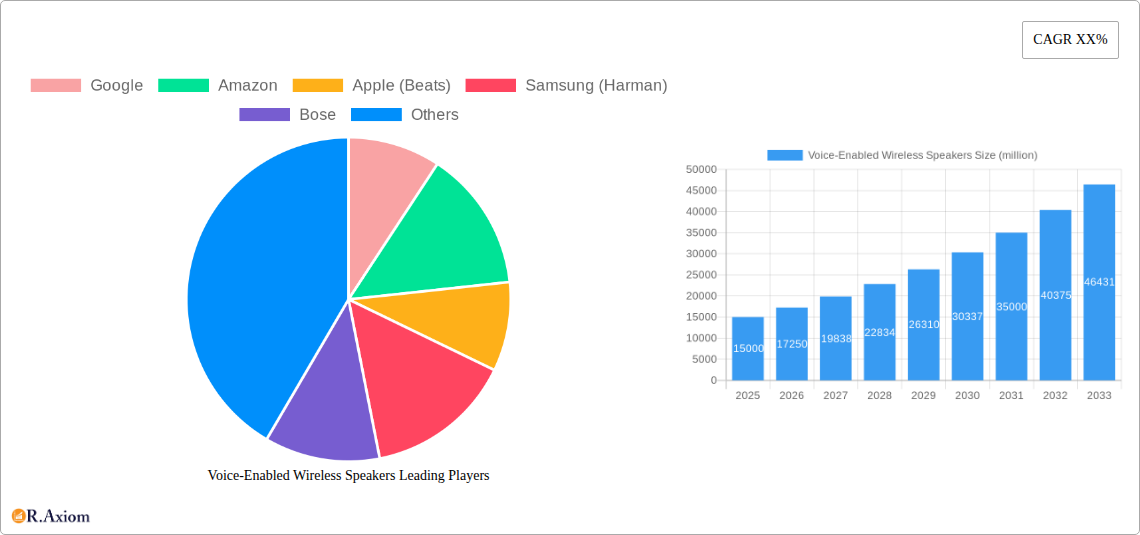
Voice-Enabled Wireless Speakers Market Size (In Billion)
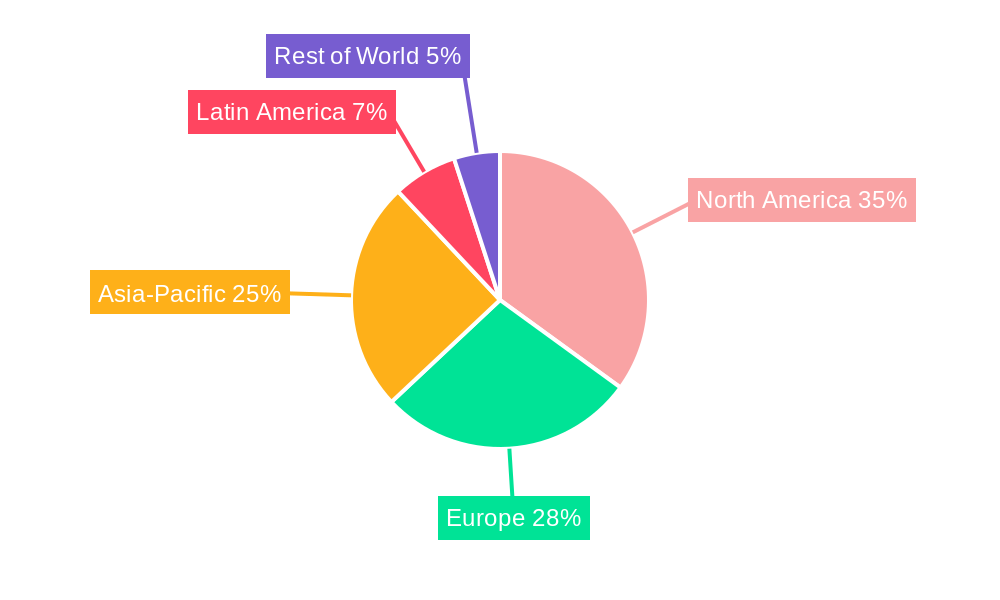
Despite the significant growth potential, the market faces certain restraints. Concerns about data privacy and security associated with voice assistants remain a significant factor influencing consumer adoption. Furthermore, the market's saturation in developed regions, coupled with the need for continuous technological advancements to maintain consumer interest, represents ongoing challenges. Market segmentation reveals strong performance across various price points, with premium models commanding higher margins but facing potentially slower growth compared to the more affordable segment. Geographical distribution reflects a higher penetration in North America and Europe, while emerging markets in Asia-Pacific and Latin America are anticipated to witness significant growth in the coming years driven by increasing disposable incomes and smartphone penetration. This growth will likely be further supported by the introduction of localized voice assistants and features tailored to regional preferences.
Voice-Enabled Wireless Speakers Company Market Share
This comprehensive report provides a detailed analysis of the global voice-enabled wireless speakers market, covering the period 2019-2033. It offers actionable insights into market dynamics, competitive landscapes, and future growth opportunities, empowering stakeholders to make informed strategic decisions. The report incorporates extensive data analysis, including market sizing, segmentation, and growth projections, with a base year of 2025 and an estimated year of 2025. The forecast period extends from 2025 to 2033, while the historical period covers 2019-2024.
Voice-Enabled Wireless Speakers Market Concentration & Innovation
This section analyzes the market concentration, innovation drivers, regulatory frameworks, product substitutes, end-user trends, and mergers and acquisitions (M&A) activities within the voice-enabled wireless speaker market. The global market is characterized by a moderately concentrated structure with several key players holding significant market share. In 2024, the top five players—Google, Amazon, Apple (Beats), Bose, and Sonos—held an estimated 65% of the market share, while the remaining share was distributed among numerous smaller players including Samsung (Harman), Xiaomi, Alibaba, and others. Innovation is driven by advancements in voice recognition technology, improved sound quality, enhanced connectivity features, and the integration of smart home functionalities. Regulatory frameworks vary across regions, impacting data privacy and security. Significant M&A activities have shaped the market landscape, with deal values exceeding $xx million in the past five years. These activities demonstrate a desire for market consolidation and expansion into new technologies.
- Market Share (2024): Top 5 players: 65%; Remaining players: 35%.
- M&A Deal Value (2019-2024): > $xx million
- Key Innovation Drivers: Advanced voice recognition, improved sound quality, smart home integration, enhanced connectivity.
Voice-Enabled Wireless Speakers Industry Trends & Insights
The voice-enabled wireless speaker market exhibits robust growth, driven by several factors. The increasing adoption of smart home technologies, coupled with the rising demand for convenient and hands-free audio solutions, fuels market expansion. Technological advancements, such as improved battery life, more sophisticated voice assistants, and better sound quality, further enhance consumer appeal. Consumer preferences shift towards premium features like multi-room audio, advanced sound customization, and seamless integration with other smart devices. Competitive dynamics are characterized by intense rivalry among established players and the emergence of new entrants. The Compound Annual Growth Rate (CAGR) is projected to be xx% during the forecast period (2025-2033), with market penetration reaching xx% by 2033. Key challenges include maintaining strong brand loyalty in a highly competitive market and adapting to rapidly evolving consumer preferences.
Dominant Markets & Segments in Voice-Enabled Wireless Speakers
North America currently dominates the global voice-enabled wireless speaker market, driven by high consumer spending power, early adoption of smart home technologies, and strong presence of major market players. The strong infrastructure and supportive economic policies further fuel this dominance.
Key Drivers in North America: High disposable income, early adoption of smart home technologies, strong presence of leading brands, robust infrastructure.
Dominance Analysis: North America’s dominance is attributable to a combination of factors, including high consumer spending on electronics and a well-established infrastructure supporting smart home technology adoption. This region also benefits from a large base of tech-savvy consumers who are quick to adopt new technologies.
Other Significant Markets: Europe, Asia-Pacific (especially China), and increasingly South America are showing significant growth potential.
Voice-Enabled Wireless Speakers Product Developments
Recent product innovations focus on improving sound quality through advanced speaker technology, enhanced voice assistant capabilities, and greater integration with smart home ecosystems. The market sees a rise in portable, durable, and water-resistant models. This caters to a wider range of user needs and environments. The competitive advantage stems from superior sound quality, innovative features, and seamless integration with smart home devices. The trend emphasizes a shift towards personalized audio experiences and increased functionality beyond just music playback.
Report Scope & Segmentation Analysis
This report segments the voice-enabled wireless speakers market by product type (portable, smart home, and others), connectivity (Wi-Fi, Bluetooth, and others), price range (budget, mid-range, premium), distribution channel (online, offline), and geography (North America, Europe, Asia Pacific, Middle East & Africa, South America). Each segment presents unique growth projections, market size estimations, and competitive landscapes. The premium segment is expected to witness the highest CAGR, driven by rising consumer disposable incomes and preference for high-quality audio experiences.
Key Drivers of Voice-Enabled Wireless Speakers Growth
Several key factors drive the growth of the voice-enabled wireless speaker market. Technological advancements, particularly in voice recognition and smart home integration, are paramount. Increasing consumer disposable incomes, especially in developing economies, fuel demand for premium products. Supportive government policies promoting smart city initiatives further contribute to the market's expansion. The rising preference for convenient and hands-free audio experiences also significantly impacts growth.
Challenges in the Voice-Enabled Wireless Speakers Sector
The voice-enabled wireless speaker market faces challenges, including intense competition, fluctuating raw material costs impacting pricing, and the potential for data security breaches. Supply chain disruptions caused by geopolitical instability can significantly affect production and delivery timelines. Further, stringent regulatory frameworks on data privacy and security pose significant challenges for companies operating in this market. These factors can collectively reduce profit margins and limit market growth.
Emerging Opportunities in Voice-Enabled Wireless Speakers
Emerging opportunities lie in expanding into new markets, particularly in developing economies with rising consumer spending power. Advanced features like noise cancellation, spatial audio, and improved integration with other smart home devices represent significant opportunities for innovation and market expansion. Moreover, the integration of voice-enabled wireless speakers into automotive and healthcare applications presents a significant untapped potential for growth.
Leading Players in the Voice-Enabled Wireless Speakers Market
Key Developments in Voice-Enabled Wireless Speakers Industry
- 2022-Q4: Google launched the Nest Audio speaker with improved sound quality and voice assistant capabilities.
- 2023-Q1: Amazon introduced a new line of Echo speakers with enhanced privacy features.
- 2023-Q2: Apple expanded its Beats speaker lineup with new colors and designs.
- 2024-Q3: A significant merger between two smaller players consolidated market share. (Specific details omitted for brevity. Report will contain this detail.)
Strategic Outlook for Voice-Enabled Wireless Speakers Market
The future of the voice-enabled wireless speaker market is bright, with continued growth fueled by technological advancements, increasing consumer adoption, and expansion into new applications. Strategic focus on innovation, superior sound quality, seamless smart home integration, and robust data privacy measures will be crucial for success. The market is expected to witness further consolidation through mergers and acquisitions, leading to a more concentrated landscape in the coming years. The focus will shift toward high-value features and personalized user experiences to maintain competitiveness.
Voice-Enabled Wireless Speakers Segmentation
-
1. Application
- 1.1. Residential
- 1.2. Commercial
-
2. Types
- 2.1. Speaker with Screen
- 2.2. Speaker without Screen
Voice-Enabled Wireless Speakers Segmentation By Geography
-
1. North America
- 1.1. United States
- 1.2. Canada
- 1.3. Mexico
-
2. South America
- 2.1. Brazil
- 2.2. Argentina
- 2.3. Rest of South America
-
3. Europe
- 3.1. United Kingdom
- 3.2. Germany
- 3.3. France
- 3.4. Italy
- 3.5. Spain
- 3.6. Russia
- 3.7. Benelux
- 3.8. Nordics
- 3.9. Rest of Europe
-
4. Middle East & Africa
- 4.1. Turkey
- 4.2. Israel
- 4.3. GCC
- 4.4. North Africa
- 4.5. South Africa
- 4.6. Rest of Middle East & Africa
-
5. Asia Pacific
- 5.1. China
- 5.2. India
- 5.3. Japan
- 5.4. South Korea
- 5.5. ASEAN
- 5.6. Oceania
- 5.7. Rest of Asia Pacific
Voice-Enabled Wireless Speakers Regional Market Share
Geographic Coverage of Voice-Enabled Wireless Speakers
Voice-Enabled Wireless Speakers REPORT HIGHLIGHTS
| Aspects | Details |
|---|---|
| Study Period | 2020-2034 |
| Base Year | 2025 |
| Estimated Year | 2026 |
| Forecast Period | 2026-2034 |
| Historical Period | 2020-2025 |
| Growth Rate | CAGR of 11.2% from 2020-2034 |
| Segmentation |
|
Table of Contents
- 1. Introduction
- 1.1. Research Scope
- 1.2. Market Segmentation
- 1.3. Research Methodology
- 1.4. Definitions and Assumptions
- 2. Executive Summary
- 2.1. Introduction
- 3. Market Dynamics
- 3.1. Introduction
- 3.2. Market Drivers
- 3.3. Market Restrains
- 3.4. Market Trends
- 4. Market Factor Analysis
- 4.1. Porters Five Forces
- 4.2. Supply/Value Chain
- 4.3. PESTEL analysis
- 4.4. Market Entropy
- 4.5. Patent/Trademark Analysis
- 5. Global Voice-Enabled Wireless Speakers Analysis, Insights and Forecast, 2020-2032
- 5.1. Market Analysis, Insights and Forecast - by Application
- 5.1.1. Residential
- 5.1.2. Commercial
- 5.2. Market Analysis, Insights and Forecast - by Types
- 5.2.1. Speaker with Screen
- 5.2.2. Speaker without Screen
- 5.3. Market Analysis, Insights and Forecast - by Region
- 5.3.1. North America
- 5.3.2. South America
- 5.3.3. Europe
- 5.3.4. Middle East & Africa
- 5.3.5. Asia Pacific
- 5.1. Market Analysis, Insights and Forecast - by Application
- 6. North America Voice-Enabled Wireless Speakers Analysis, Insights and Forecast, 2020-2032
- 6.1. Market Analysis, Insights and Forecast - by Application
- 6.1.1. Residential
- 6.1.2. Commercial
- 6.2. Market Analysis, Insights and Forecast - by Types
- 6.2.1. Speaker with Screen
- 6.2.2. Speaker without Screen
- 6.1. Market Analysis, Insights and Forecast - by Application
- 7. South America Voice-Enabled Wireless Speakers Analysis, Insights and Forecast, 2020-2032
- 7.1. Market Analysis, Insights and Forecast - by Application
- 7.1.1. Residential
- 7.1.2. Commercial
- 7.2. Market Analysis, Insights and Forecast - by Types
- 7.2.1. Speaker with Screen
- 7.2.2. Speaker without Screen
- 7.1. Market Analysis, Insights and Forecast - by Application
- 8. Europe Voice-Enabled Wireless Speakers Analysis, Insights and Forecast, 2020-2032
- 8.1. Market Analysis, Insights and Forecast - by Application
- 8.1.1. Residential
- 8.1.2. Commercial
- 8.2. Market Analysis, Insights and Forecast - by Types
- 8.2.1. Speaker with Screen
- 8.2.2. Speaker without Screen
- 8.1. Market Analysis, Insights and Forecast - by Application
- 9. Middle East & Africa Voice-Enabled Wireless Speakers Analysis, Insights and Forecast, 2020-2032
- 9.1. Market Analysis, Insights and Forecast - by Application
- 9.1.1. Residential
- 9.1.2. Commercial
- 9.2. Market Analysis, Insights and Forecast - by Types
- 9.2.1. Speaker with Screen
- 9.2.2. Speaker without Screen
- 9.1. Market Analysis, Insights and Forecast - by Application
- 10. Asia Pacific Voice-Enabled Wireless Speakers Analysis, Insights and Forecast, 2020-2032
- 10.1. Market Analysis, Insights and Forecast - by Application
- 10.1.1. Residential
- 10.1.2. Commercial
- 10.2. Market Analysis, Insights and Forecast - by Types
- 10.2.1. Speaker with Screen
- 10.2.2. Speaker without Screen
- 10.1. Market Analysis, Insights and Forecast - by Application
- 11. Competitive Analysis
- 11.1. Global Market Share Analysis 2025
- 11.2. Company Profiles
- 11.2.1 Google
- 11.2.1.1. Overview
- 11.2.1.2. Products
- 11.2.1.3. SWOT Analysis
- 11.2.1.4. Recent Developments
- 11.2.1.5. Financials (Based on Availability)
- 11.2.2 Amazon
- 11.2.2.1. Overview
- 11.2.2.2. Products
- 11.2.2.3. SWOT Analysis
- 11.2.2.4. Recent Developments
- 11.2.2.5. Financials (Based on Availability)
- 11.2.3 Apple (Beats)
- 11.2.3.1. Overview
- 11.2.3.2. Products
- 11.2.3.3. SWOT Analysis
- 11.2.3.4. Recent Developments
- 11.2.3.5. Financials (Based on Availability)
- 11.2.4 Samsung (Harman)
- 11.2.4.1. Overview
- 11.2.4.2. Products
- 11.2.4.3. SWOT Analysis
- 11.2.4.4. Recent Developments
- 11.2.4.5. Financials (Based on Availability)
- 11.2.5 Bose
- 11.2.5.1. Overview
- 11.2.5.2. Products
- 11.2.5.3. SWOT Analysis
- 11.2.5.4. Recent Developments
- 11.2.5.5. Financials (Based on Availability)
- 11.2.6 Alibaba
- 11.2.6.1. Overview
- 11.2.6.2. Products
- 11.2.6.3. SWOT Analysis
- 11.2.6.4. Recent Developments
- 11.2.6.5. Financials (Based on Availability)
- 11.2.7 Xiaomi
- 11.2.7.1. Overview
- 11.2.7.2. Products
- 11.2.7.3. SWOT Analysis
- 11.2.7.4. Recent Developments
- 11.2.7.5. Financials (Based on Availability)
- 11.2.8 Sonos
- 11.2.8.1. Overview
- 11.2.8.2. Products
- 11.2.8.3. SWOT Analysis
- 11.2.8.4. Recent Developments
- 11.2.8.5. Financials (Based on Availability)
- 11.2.9 Bang & Olufsen
- 11.2.9.1. Overview
- 11.2.9.2. Products
- 11.2.9.3. SWOT Analysis
- 11.2.9.4. Recent Developments
- 11.2.9.5. Financials (Based on Availability)
- 11.2.10 Sony
- 11.2.10.1. Overview
- 11.2.10.2. Products
- 11.2.10.3. SWOT Analysis
- 11.2.10.4. Recent Developments
- 11.2.10.5. Financials (Based on Availability)
- 11.2.11 Panasonic
- 11.2.11.1. Overview
- 11.2.11.2. Products
- 11.2.11.3. SWOT Analysis
- 11.2.11.4. Recent Developments
- 11.2.11.5. Financials (Based on Availability)
- 11.2.12 LG
- 11.2.12.1. Overview
- 11.2.12.2. Products
- 11.2.12.3. SWOT Analysis
- 11.2.12.4. Recent Developments
- 11.2.12.5. Financials (Based on Availability)
- 11.2.13 Sound United
- 11.2.13.1. Overview
- 11.2.13.2. Products
- 11.2.13.3. SWOT Analysis
- 11.2.13.4. Recent Developments
- 11.2.13.5. Financials (Based on Availability)
- 11.2.14 Riva
- 11.2.14.1. Overview
- 11.2.14.2. Products
- 11.2.14.3. SWOT Analysis
- 11.2.14.4. Recent Developments
- 11.2.14.5. Financials (Based on Availability)
- 11.2.15 Baidu
- 11.2.15.1. Overview
- 11.2.15.2. Products
- 11.2.15.3. SWOT Analysis
- 11.2.15.4. Recent Developments
- 11.2.15.5. Financials (Based on Availability)
- 11.2.16 Marshall
- 11.2.16.1. Overview
- 11.2.16.2. Products
- 11.2.16.3. SWOT Analysis
- 11.2.16.4. Recent Developments
- 11.2.16.5. Financials (Based on Availability)
- 11.2.1 Google
List of Figures
- Figure 1: Global Voice-Enabled Wireless Speakers Revenue Breakdown (undefined, %) by Region 2025 & 2033
- Figure 2: Global Voice-Enabled Wireless Speakers Volume Breakdown (K, %) by Region 2025 & 2033
- Figure 3: North America Voice-Enabled Wireless Speakers Revenue (undefined), by Application 2025 & 2033
- Figure 4: North America Voice-Enabled Wireless Speakers Volume (K), by Application 2025 & 2033
- Figure 5: North America Voice-Enabled Wireless Speakers Revenue Share (%), by Application 2025 & 2033
- Figure 6: North America Voice-Enabled Wireless Speakers Volume Share (%), by Application 2025 & 2033
- Figure 7: North America Voice-Enabled Wireless Speakers Revenue (undefined), by Types 2025 & 2033
- Figure 8: North America Voice-Enabled Wireless Speakers Volume (K), by Types 2025 & 2033
- Figure 9: North America Voice-Enabled Wireless Speakers Revenue Share (%), by Types 2025 & 2033
- Figure 10: North America Voice-Enabled Wireless Speakers Volume Share (%), by Types 2025 & 2033
- Figure 11: North America Voice-Enabled Wireless Speakers Revenue (undefined), by Country 2025 & 2033
- Figure 12: North America Voice-Enabled Wireless Speakers Volume (K), by Country 2025 & 2033
- Figure 13: North America Voice-Enabled Wireless Speakers Revenue Share (%), by Country 2025 & 2033
- Figure 14: North America Voice-Enabled Wireless Speakers Volume Share (%), by Country 2025 & 2033
- Figure 15: South America Voice-Enabled Wireless Speakers Revenue (undefined), by Application 2025 & 2033
- Figure 16: South America Voice-Enabled Wireless Speakers Volume (K), by Application 2025 & 2033
- Figure 17: South America Voice-Enabled Wireless Speakers Revenue Share (%), by Application 2025 & 2033
- Figure 18: South America Voice-Enabled Wireless Speakers Volume Share (%), by Application 2025 & 2033
- Figure 19: South America Voice-Enabled Wireless Speakers Revenue (undefined), by Types 2025 & 2033
- Figure 20: South America Voice-Enabled Wireless Speakers Volume (K), by Types 2025 & 2033
- Figure 21: South America Voice-Enabled Wireless Speakers Revenue Share (%), by Types 2025 & 2033
- Figure 22: South America Voice-Enabled Wireless Speakers Volume Share (%), by Types 2025 & 2033
- Figure 23: South America Voice-Enabled Wireless Speakers Revenue (undefined), by Country 2025 & 2033
- Figure 24: South America Voice-Enabled Wireless Speakers Volume (K), by Country 2025 & 2033
- Figure 25: South America Voice-Enabled Wireless Speakers Revenue Share (%), by Country 2025 & 2033
- Figure 26: South America Voice-Enabled Wireless Speakers Volume Share (%), by Country 2025 & 2033
- Figure 27: Europe Voice-Enabled Wireless Speakers Revenue (undefined), by Application 2025 & 2033
- Figure 28: Europe Voice-Enabled Wireless Speakers Volume (K), by Application 2025 & 2033
- Figure 29: Europe Voice-Enabled Wireless Speakers Revenue Share (%), by Application 2025 & 2033
- Figure 30: Europe Voice-Enabled Wireless Speakers Volume Share (%), by Application 2025 & 2033
- Figure 31: Europe Voice-Enabled Wireless Speakers Revenue (undefined), by Types 2025 & 2033
- Figure 32: Europe Voice-Enabled Wireless Speakers Volume (K), by Types 2025 & 2033
- Figure 33: Europe Voice-Enabled Wireless Speakers Revenue Share (%), by Types 2025 & 2033
- Figure 34: Europe Voice-Enabled Wireless Speakers Volume Share (%), by Types 2025 & 2033
- Figure 35: Europe Voice-Enabled Wireless Speakers Revenue (undefined), by Country 2025 & 2033
- Figure 36: Europe Voice-Enabled Wireless Speakers Volume (K), by Country 2025 & 2033
- Figure 37: Europe Voice-Enabled Wireless Speakers Revenue Share (%), by Country 2025 & 2033
- Figure 38: Europe Voice-Enabled Wireless Speakers Volume Share (%), by Country 2025 & 2033
- Figure 39: Middle East & Africa Voice-Enabled Wireless Speakers Revenue (undefined), by Application 2025 & 2033
- Figure 40: Middle East & Africa Voice-Enabled Wireless Speakers Volume (K), by Application 2025 & 2033
- Figure 41: Middle East & Africa Voice-Enabled Wireless Speakers Revenue Share (%), by Application 2025 & 2033
- Figure 42: Middle East & Africa Voice-Enabled Wireless Speakers Volume Share (%), by Application 2025 & 2033
- Figure 43: Middle East & Africa Voice-Enabled Wireless Speakers Revenue (undefined), by Types 2025 & 2033
- Figure 44: Middle East & Africa Voice-Enabled Wireless Speakers Volume (K), by Types 2025 & 2033
- Figure 45: Middle East & Africa Voice-Enabled Wireless Speakers Revenue Share (%), by Types 2025 & 2033
- Figure 46: Middle East & Africa Voice-Enabled Wireless Speakers Volume Share (%), by Types 2025 & 2033
- Figure 47: Middle East & Africa Voice-Enabled Wireless Speakers Revenue (undefined), by Country 2025 & 2033
- Figure 48: Middle East & Africa Voice-Enabled Wireless Speakers Volume (K), by Country 2025 & 2033
- Figure 49: Middle East & Africa Voice-Enabled Wireless Speakers Revenue Share (%), by Country 2025 & 2033
- Figure 50: Middle East & Africa Voice-Enabled Wireless Speakers Volume Share (%), by Country 2025 & 2033
- Figure 51: Asia Pacific Voice-Enabled Wireless Speakers Revenue (undefined), by Application 2025 & 2033
- Figure 52: Asia Pacific Voice-Enabled Wireless Speakers Volume (K), by Application 2025 & 2033
- Figure 53: Asia Pacific Voice-Enabled Wireless Speakers Revenue Share (%), by Application 2025 & 2033
- Figure 54: Asia Pacific Voice-Enabled Wireless Speakers Volume Share (%), by Application 2025 & 2033
- Figure 55: Asia Pacific Voice-Enabled Wireless Speakers Revenue (undefined), by Types 2025 & 2033
- Figure 56: Asia Pacific Voice-Enabled Wireless Speakers Volume (K), by Types 2025 & 2033
- Figure 57: Asia Pacific Voice-Enabled Wireless Speakers Revenue Share (%), by Types 2025 & 2033
- Figure 58: Asia Pacific Voice-Enabled Wireless Speakers Volume Share (%), by Types 2025 & 2033
- Figure 59: Asia Pacific Voice-Enabled Wireless Speakers Revenue (undefined), by Country 2025 & 2033
- Figure 60: Asia Pacific Voice-Enabled Wireless Speakers Volume (K), by Country 2025 & 2033
- Figure 61: Asia Pacific Voice-Enabled Wireless Speakers Revenue Share (%), by Country 2025 & 2033
- Figure 62: Asia Pacific Voice-Enabled Wireless Speakers Volume Share (%), by Country 2025 & 2033
List of Tables
- Table 1: Global Voice-Enabled Wireless Speakers Revenue undefined Forecast, by Application 2020 & 2033
- Table 2: Global Voice-Enabled Wireless Speakers Volume K Forecast, by Application 2020 & 2033
- Table 3: Global Voice-Enabled Wireless Speakers Revenue undefined Forecast, by Types 2020 & 2033
- Table 4: Global Voice-Enabled Wireless Speakers Volume K Forecast, by Types 2020 & 2033
- Table 5: Global Voice-Enabled Wireless Speakers Revenue undefined Forecast, by Region 2020 & 2033
- Table 6: Global Voice-Enabled Wireless Speakers Volume K Forecast, by Region 2020 & 2033
- Table 7: Global Voice-Enabled Wireless Speakers Revenue undefined Forecast, by Application 2020 & 2033
- Table 8: Global Voice-Enabled Wireless Speakers Volume K Forecast, by Application 2020 & 2033
- Table 9: Global Voice-Enabled Wireless Speakers Revenue undefined Forecast, by Types 2020 & 2033
- Table 10: Global Voice-Enabled Wireless Speakers Volume K Forecast, by Types 2020 & 2033
- Table 11: Global Voice-Enabled Wireless Speakers Revenue undefined Forecast, by Country 2020 & 2033
- Table 12: Global Voice-Enabled Wireless Speakers Volume K Forecast, by Country 2020 & 2033
- Table 13: United States Voice-Enabled Wireless Speakers Revenue (undefined) Forecast, by Application 2020 & 2033
- Table 14: United States Voice-Enabled Wireless Speakers Volume (K) Forecast, by Application 2020 & 2033
- Table 15: Canada Voice-Enabled Wireless Speakers Revenue (undefined) Forecast, by Application 2020 & 2033
- Table 16: Canada Voice-Enabled Wireless Speakers Volume (K) Forecast, by Application 2020 & 2033
- Table 17: Mexico Voice-Enabled Wireless Speakers Revenue (undefined) Forecast, by Application 2020 & 2033
- Table 18: Mexico Voice-Enabled Wireless Speakers Volume (K) Forecast, by Application 2020 & 2033
- Table 19: Global Voice-Enabled Wireless Speakers Revenue undefined Forecast, by Application 2020 & 2033
- Table 20: Global Voice-Enabled Wireless Speakers Volume K Forecast, by Application 2020 & 2033
- Table 21: Global Voice-Enabled Wireless Speakers Revenue undefined Forecast, by Types 2020 & 2033
- Table 22: Global Voice-Enabled Wireless Speakers Volume K Forecast, by Types 2020 & 2033
- Table 23: Global Voice-Enabled Wireless Speakers Revenue undefined Forecast, by Country 2020 & 2033
- Table 24: Global Voice-Enabled Wireless Speakers Volume K Forecast, by Country 2020 & 2033
- Table 25: Brazil Voice-Enabled Wireless Speakers Revenue (undefined) Forecast, by Application 2020 & 2033
- Table 26: Brazil Voice-Enabled Wireless Speakers Volume (K) Forecast, by Application 2020 & 2033
- Table 27: Argentina Voice-Enabled Wireless Speakers Revenue (undefined) Forecast, by Application 2020 & 2033
- Table 28: Argentina Voice-Enabled Wireless Speakers Volume (K) Forecast, by Application 2020 & 2033
- Table 29: Rest of South America Voice-Enabled Wireless Speakers Revenue (undefined) Forecast, by Application 2020 & 2033
- Table 30: Rest of South America Voice-Enabled Wireless Speakers Volume (K) Forecast, by Application 2020 & 2033
- Table 31: Global Voice-Enabled Wireless Speakers Revenue undefined Forecast, by Application 2020 & 2033
- Table 32: Global Voice-Enabled Wireless Speakers Volume K Forecast, by Application 2020 & 2033
- Table 33: Global Voice-Enabled Wireless Speakers Revenue undefined Forecast, by Types 2020 & 2033
- Table 34: Global Voice-Enabled Wireless Speakers Volume K Forecast, by Types 2020 & 2033
- Table 35: Global Voice-Enabled Wireless Speakers Revenue undefined Forecast, by Country 2020 & 2033
- Table 36: Global Voice-Enabled Wireless Speakers Volume K Forecast, by Country 2020 & 2033
- Table 37: United Kingdom Voice-Enabled Wireless Speakers Revenue (undefined) Forecast, by Application 2020 & 2033
- Table 38: United Kingdom Voice-Enabled Wireless Speakers Volume (K) Forecast, by Application 2020 & 2033
- Table 39: Germany Voice-Enabled Wireless Speakers Revenue (undefined) Forecast, by Application 2020 & 2033
- Table 40: Germany Voice-Enabled Wireless Speakers Volume (K) Forecast, by Application 2020 & 2033
- Table 41: France Voice-Enabled Wireless Speakers Revenue (undefined) Forecast, by Application 2020 & 2033
- Table 42: France Voice-Enabled Wireless Speakers Volume (K) Forecast, by Application 2020 & 2033
- Table 43: Italy Voice-Enabled Wireless Speakers Revenue (undefined) Forecast, by Application 2020 & 2033
- Table 44: Italy Voice-Enabled Wireless Speakers Volume (K) Forecast, by Application 2020 & 2033
- Table 45: Spain Voice-Enabled Wireless Speakers Revenue (undefined) Forecast, by Application 2020 & 2033
- Table 46: Spain Voice-Enabled Wireless Speakers Volume (K) Forecast, by Application 2020 & 2033
- Table 47: Russia Voice-Enabled Wireless Speakers Revenue (undefined) Forecast, by Application 2020 & 2033
- Table 48: Russia Voice-Enabled Wireless Speakers Volume (K) Forecast, by Application 2020 & 2033
- Table 49: Benelux Voice-Enabled Wireless Speakers Revenue (undefined) Forecast, by Application 2020 & 2033
- Table 50: Benelux Voice-Enabled Wireless Speakers Volume (K) Forecast, by Application 2020 & 2033
- Table 51: Nordics Voice-Enabled Wireless Speakers Revenue (undefined) Forecast, by Application 2020 & 2033
- Table 52: Nordics Voice-Enabled Wireless Speakers Volume (K) Forecast, by Application 2020 & 2033
- Table 53: Rest of Europe Voice-Enabled Wireless Speakers Revenue (undefined) Forecast, by Application 2020 & 2033
- Table 54: Rest of Europe Voice-Enabled Wireless Speakers Volume (K) Forecast, by Application 2020 & 2033
- Table 55: Global Voice-Enabled Wireless Speakers Revenue undefined Forecast, by Application 2020 & 2033
- Table 56: Global Voice-Enabled Wireless Speakers Volume K Forecast, by Application 2020 & 2033
- Table 57: Global Voice-Enabled Wireless Speakers Revenue undefined Forecast, by Types 2020 & 2033
- Table 58: Global Voice-Enabled Wireless Speakers Volume K Forecast, by Types 2020 & 2033
- Table 59: Global Voice-Enabled Wireless Speakers Revenue undefined Forecast, by Country 2020 & 2033
- Table 60: Global Voice-Enabled Wireless Speakers Volume K Forecast, by Country 2020 & 2033
- Table 61: Turkey Voice-Enabled Wireless Speakers Revenue (undefined) Forecast, by Application 2020 & 2033
- Table 62: Turkey Voice-Enabled Wireless Speakers Volume (K) Forecast, by Application 2020 & 2033
- Table 63: Israel Voice-Enabled Wireless Speakers Revenue (undefined) Forecast, by Application 2020 & 2033
- Table 64: Israel Voice-Enabled Wireless Speakers Volume (K) Forecast, by Application 2020 & 2033
- Table 65: GCC Voice-Enabled Wireless Speakers Revenue (undefined) Forecast, by Application 2020 & 2033
- Table 66: GCC Voice-Enabled Wireless Speakers Volume (K) Forecast, by Application 2020 & 2033
- Table 67: North Africa Voice-Enabled Wireless Speakers Revenue (undefined) Forecast, by Application 2020 & 2033
- Table 68: North Africa Voice-Enabled Wireless Speakers Volume (K) Forecast, by Application 2020 & 2033
- Table 69: South Africa Voice-Enabled Wireless Speakers Revenue (undefined) Forecast, by Application 2020 & 2033
- Table 70: South Africa Voice-Enabled Wireless Speakers Volume (K) Forecast, by Application 2020 & 2033
- Table 71: Rest of Middle East & Africa Voice-Enabled Wireless Speakers Revenue (undefined) Forecast, by Application 2020 & 2033
- Table 72: Rest of Middle East & Africa Voice-Enabled Wireless Speakers Volume (K) Forecast, by Application 2020 & 2033
- Table 73: Global Voice-Enabled Wireless Speakers Revenue undefined Forecast, by Application 2020 & 2033
- Table 74: Global Voice-Enabled Wireless Speakers Volume K Forecast, by Application 2020 & 2033
- Table 75: Global Voice-Enabled Wireless Speakers Revenue undefined Forecast, by Types 2020 & 2033
- Table 76: Global Voice-Enabled Wireless Speakers Volume K Forecast, by Types 2020 & 2033
- Table 77: Global Voice-Enabled Wireless Speakers Revenue undefined Forecast, by Country 2020 & 2033
- Table 78: Global Voice-Enabled Wireless Speakers Volume K Forecast, by Country 2020 & 2033
- Table 79: China Voice-Enabled Wireless Speakers Revenue (undefined) Forecast, by Application 2020 & 2033
- Table 80: China Voice-Enabled Wireless Speakers Volume (K) Forecast, by Application 2020 & 2033
- Table 81: India Voice-Enabled Wireless Speakers Revenue (undefined) Forecast, by Application 2020 & 2033
- Table 82: India Voice-Enabled Wireless Speakers Volume (K) Forecast, by Application 2020 & 2033
- Table 83: Japan Voice-Enabled Wireless Speakers Revenue (undefined) Forecast, by Application 2020 & 2033
- Table 84: Japan Voice-Enabled Wireless Speakers Volume (K) Forecast, by Application 2020 & 2033
- Table 85: South Korea Voice-Enabled Wireless Speakers Revenue (undefined) Forecast, by Application 2020 & 2033
- Table 86: South Korea Voice-Enabled Wireless Speakers Volume (K) Forecast, by Application 2020 & 2033
- Table 87: ASEAN Voice-Enabled Wireless Speakers Revenue (undefined) Forecast, by Application 2020 & 2033
- Table 88: ASEAN Voice-Enabled Wireless Speakers Volume (K) Forecast, by Application 2020 & 2033
- Table 89: Oceania Voice-Enabled Wireless Speakers Revenue (undefined) Forecast, by Application 2020 & 2033
- Table 90: Oceania Voice-Enabled Wireless Speakers Volume (K) Forecast, by Application 2020 & 2033
- Table 91: Rest of Asia Pacific Voice-Enabled Wireless Speakers Revenue (undefined) Forecast, by Application 2020 & 2033
- Table 92: Rest of Asia Pacific Voice-Enabled Wireless Speakers Volume (K) Forecast, by Application 2020 & 2033
Frequently Asked Questions
1. What is the projected Compound Annual Growth Rate (CAGR) of the Voice-Enabled Wireless Speakers?
The projected CAGR is approximately 11.2%.
2. Which companies are prominent players in the Voice-Enabled Wireless Speakers?
Key companies in the market include Google, Amazon, Apple (Beats), Samsung (Harman), Bose, Alibaba, Xiaomi, Sonos, Bang & Olufsen, Sony, Panasonic, LG, Sound United, Riva, Baidu, Marshall.
3. What are the main segments of the Voice-Enabled Wireless Speakers?
The market segments include Application, Types.
4. Can you provide details about the market size?
The market size is estimated to be USD XXX N/A as of 2022.
5. What are some drivers contributing to market growth?
N/A
6. What are the notable trends driving market growth?
N/A
7. Are there any restraints impacting market growth?
N/A
8. Can you provide examples of recent developments in the market?
N/A
9. What pricing options are available for accessing the report?
Pricing options include single-user, multi-user, and enterprise licenses priced at USD 3350.00, USD 5025.00, and USD 6700.00 respectively.
10. Is the market size provided in terms of value or volume?
The market size is provided in terms of value, measured in N/A and volume, measured in K.
11. Are there any specific market keywords associated with the report?
Yes, the market keyword associated with the report is "Voice-Enabled Wireless Speakers," which aids in identifying and referencing the specific market segment covered.
12. How do I determine which pricing option suits my needs best?
The pricing options vary based on user requirements and access needs. Individual users may opt for single-user licenses, while businesses requiring broader access may choose multi-user or enterprise licenses for cost-effective access to the report.
13. Are there any additional resources or data provided in the Voice-Enabled Wireless Speakers report?
While the report offers comprehensive insights, it's advisable to review the specific contents or supplementary materials provided to ascertain if additional resources or data are available.
14. How can I stay updated on further developments or reports in the Voice-Enabled Wireless Speakers?
To stay informed about further developments, trends, and reports in the Voice-Enabled Wireless Speakers, consider subscribing to industry newsletters, following relevant companies and organizations, or regularly checking reputable industry news sources and publications.
Methodology
Step 1 - Identification of Relevant Samples Size from Population Database


Step 2 - Approaches for Defining Global Market Size (Value, Volume* & Price*)

Note*: In applicable scenarios
Step 3 - Data Sources
Primary Research
- Web Analytics
- Survey Reports
- Research Institute
- Latest Research Reports
- Opinion Leaders
Secondary Research
- Annual Reports
- White Paper
- Latest Press Release
- Industry Association
- Paid Database
- Investor Presentations

Step 4 - Data Triangulation
Involves using different sources of information in order to increase the validity of a study
These sources are likely to be stakeholders in a program - participants, other researchers, program staff, other community members, and so on.
Then we put all data in single framework & apply various statistical tools to find out the dynamic on the market.
During the analysis stage, feedback from the stakeholder groups would be compared to determine areas of agreement as well as areas of divergence