

Key Insights
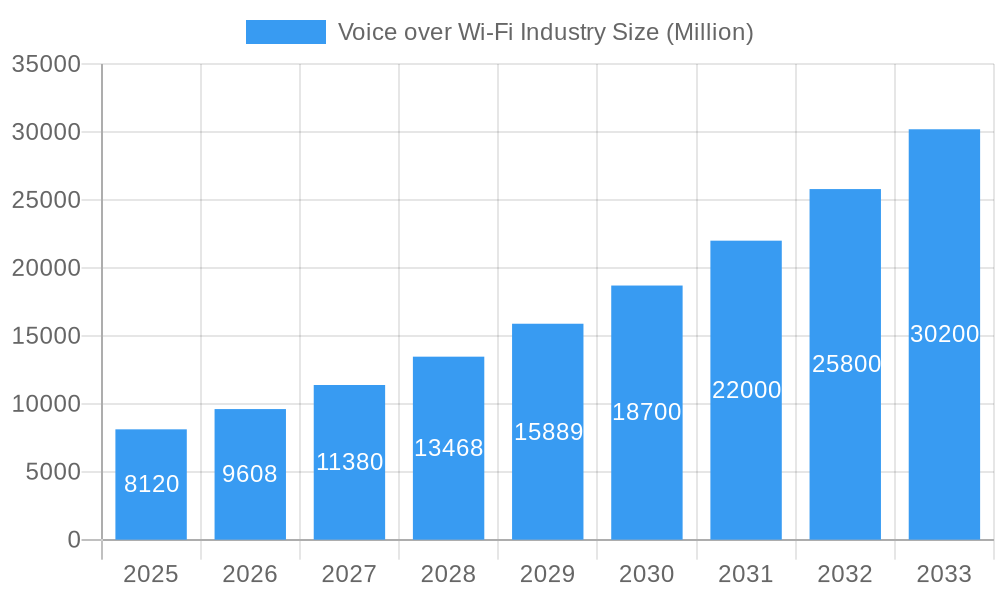
The Voice over Wi-Fi (VoWiFi) market is experiencing robust growth, projected to reach \$8.12 billion in 2025 and maintain a Compound Annual Growth Rate (CAGR) exceeding 18.06% from 2025 to 2033. This expansion is fueled by several key drivers. The increasing adoption of smartphones and other connected devices creates a larger potential user base for VoWiFi services. Furthermore, the demand for high-quality, reliable voice communication, especially in areas with poor cellular coverage, is a significant factor. Consumers and businesses alike are seeking cost-effective alternatives to traditional cellular calls, and VoWiFi provides a viable solution. Technological advancements, including improved Wi-Fi infrastructure and more sophisticated VoWiFi client software, are also contributing to market growth. The market segmentation, encompassing various client types (integrated, separate, browser) and device types (smartphones, tablets, laptops), highlights the diverse applications and widespread adaptability of VoWiFi technology.
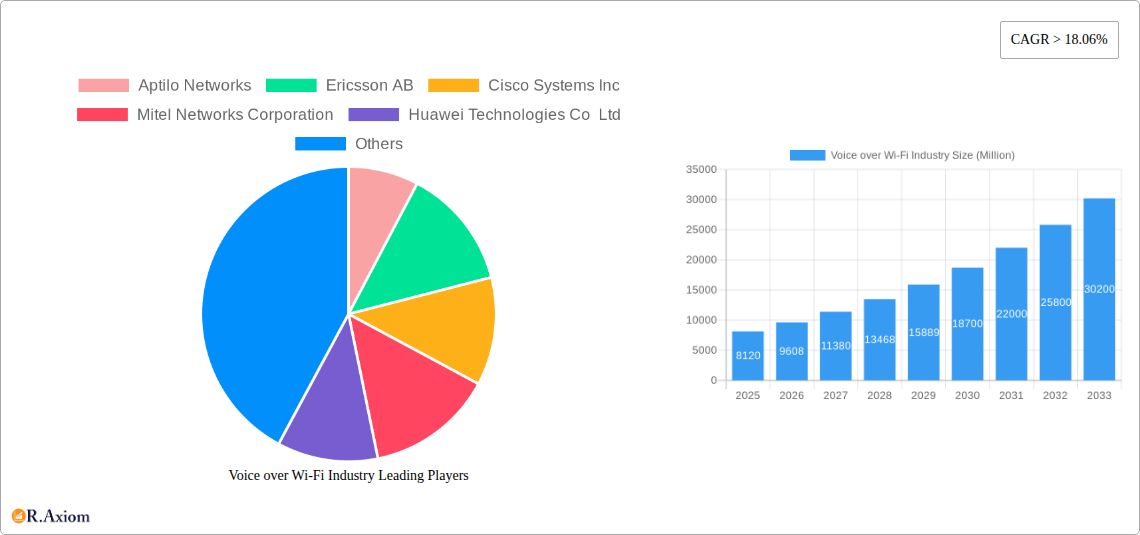
Voice over Wi-Fi Industry Market Size (In Billion)
The competitive landscape is marked by a mix of established telecommunications giants like Ericsson, Cisco, and Nokia, alongside specialized VoWiFi solution providers such as Aptilo Networks and Ribbon Communications. This competitive dynamic fosters innovation and ensures a continuous improvement in VoWiFi technology and service offerings. Geographic expansion, particularly in regions with rapidly developing digital infrastructure like Asia-Pacific and parts of South America, represents a significant opportunity for future growth. While challenges such as ensuring seamless handoffs between Wi-Fi and cellular networks and addressing security concerns remain, the overall market outlook for VoWiFi remains overwhelmingly positive, driven by consistent technological advancements and the increasing demand for superior and affordable voice communication solutions.
Voice over Wi-Fi Industry Company Market Share
Voice over Wi-Fi (VoWiFi) Industry Market Report: 2019-2033
This comprehensive report provides a detailed analysis of the Voice over Wi-Fi (VoWiFi) industry, offering invaluable insights for stakeholders, investors, and industry professionals. The study period covers 2019-2033, with a base year of 2025 and a forecast period of 2025-2033. The report projects a market size of xx Million by 2033, exhibiting a CAGR of xx% during the forecast period. This in-depth analysis considers various segments, including voice clients (integrated, separate, browser), device types (smartphones, tablets, laptops, others), and geographic regions, providing granular data and actionable intelligence.
Voice over Wi-Fi Industry Market Concentration & Innovation
The VoWiFi market exhibits a moderately concentrated landscape, with key players like Cisco, Ericsson, and Nokia holding significant market share. However, the emergence of innovative startups and smaller players is increasing competition. Market share data for 2024 suggests Cisco holds approximately xx% of the market, followed by Ericsson with xx% and Nokia with xx%. The remaining xx% is distributed among other players. Innovation is driven primarily by advancements in 5G technology, improved Wi-Fi standards (Wi-Fi 6E and beyond), and the increasing demand for high-quality voice communication over wireless networks. Regulatory frameworks, particularly those concerning spectrum allocation and interoperability, significantly impact market growth. Product substitutes, such as traditional cellular voice calls and other VoIP services, pose a competitive challenge. End-user trends toward seamless connectivity and unified communications are driving adoption. M&A activity in the sector has been moderate, with deal values averaging xx Million annually in the historical period (2019-2024), primarily focused on strengthening technology portfolios and expanding market reach.
- Key Players: Cisco, Ericsson, Nokia, Huawei, Aptilo Networks, Ribbon Communications
- Innovation Drivers: 5G technology, Wi-Fi 6E, Unified Communications
- Regulatory Impacts: Spectrum allocation, interoperability standards
- M&A Activity (2019-2024): Average deal value: xx Million
Voice over Wi-Fi Industry Industry Trends & Insights
The VoWiFi market is experiencing robust growth, fueled by several key factors. The increasing penetration of smartphones and other smart devices capable of supporting VoWiFi is a major driver. The global transition to 5G networks further enhances VoWiFi capabilities, offering improved speed, latency, and reliability. Consumer preferences are shifting toward convenient and cost-effective communication solutions, making VoWiFi an attractive alternative to traditional cellular calls, especially in areas with robust Wi-Fi infrastructure. Furthermore, the growing adoption of cloud-based communication platforms is creating synergies with VoWiFi, facilitating seamless integration. The market is witnessing significant technological disruptions, including advancements in voice codecs and the integration of AI-powered features such as noise cancellation and voice enhancement. Competitive dynamics are intensifying as established telecom players and technology companies expand their VoWiFi offerings. The market's CAGR is projected at xx% from 2025 to 2033, indicating strong growth potential. Market penetration is expected to reach xx% globally by 2033.
Dominant Markets & Segments in Voice over Wi-Fi Industry
North America currently holds the largest market share in the VoWiFi industry, driven by early adoption of advanced technologies, robust Wi-Fi infrastructure, and high smartphone penetration. Europe follows closely, with significant growth expected in Asia-Pacific regions due to increasing smartphone usage and expanding 5G networks.
- Leading Region: North America
- Key Drivers:
- North America: Advanced technology adoption, robust Wi-Fi infrastructure, high smartphone penetration
- Europe: Strong telecom infrastructure, high digital literacy
- Asia-Pacific: Rapid smartphone growth, expanding 5G networks
Segment Dominance:
- Voice Client: Integrated VoWiFi clients currently dominate the market due to ease of use and seamless integration with existing communication systems. Separate and browser-based clients are experiencing slower growth but are expected to gain traction with the increase in BYOD policies.
- Device Type: Smartphones account for the largest segment due to their ubiquitous nature. Tablets and laptops are growing steadily, representing a significant portion of the market. Other device types (wearables, IoT devices) represent a smaller, but emerging market segment.
Voice over Wi-Fi Industry Product Developments
Recent product innovations focus on enhancing call quality, improving battery life, and integrating advanced features like HD voice and noise cancellation. The integration of VoWiFi with enterprise communication platforms like Microsoft Teams is gaining traction. These developments provide competitive advantages by offering superior user experience, improved reliability, and cost-effective solutions for both consumers and businesses. The focus is increasingly on seamless integration within unified communications platforms, enhanced security features, and optimized performance across diverse Wi-Fi environments.
Report Scope & Segmentation Analysis
This report segments the VoWiFi market based on voice client type (integrated, separate, browser), device type (smartphones, tablets, laptops, other), and geography. Each segment's growth projection, market size (in Millions), and competitive dynamics are analyzed in detail. For example, the integrated VoWiFi client segment is projected to grow at a xx% CAGR during the forecast period due to its ease of use. The smartphone segment continues to be the largest contributor to the overall market, while the other device types segment is expected to witness the fastest growth.
Key Drivers of Voice over Wi-Fi Industry Growth
The growth of the VoWiFi industry is primarily driven by the expansion of 5G networks, the increasing penetration of Wi-Fi hotspots, and the rising demand for high-quality, cost-effective communication solutions. Government initiatives promoting digitalization further contribute to the market's expansion. Advancements in Wi-Fi technology, like Wi-Fi 6E, enhance performance and reliability.
Challenges in the Voice over Wi-Fi Industry Sector
Challenges include the need for seamless interoperability between different networks and devices, ensuring consistent call quality across diverse Wi-Fi environments, and addressing security concerns associated with transmitting voice data over wireless networks. Competition from other communication technologies, and inconsistent regulatory frameworks across different regions also pose challenges. The cost of implementing and maintaining VoWiFi infrastructure can also act as a barrier to adoption, especially for smaller players.
Emerging Opportunities in Voice over Wi-Fi Industry
Emerging opportunities lie in the integration of VoWiFi with IoT devices, the development of enhanced security features to protect sensitive voice data, and expansion into underserved markets with limited or no cellular coverage. The growing adoption of cloud-based communication platforms and the increasing demand for unified communications solutions are also creating new opportunities for growth.
Leading Players in the Voice over Wi-Fi Industry Market
Key Developments in Voice over Wi-Fi Industry Industry
- October 2023: Bharti Airtel partners with Microsoft to offer calling services over Microsoft Teams via Airtel IQ, expanding enterprise communication options in India.
- February 2023: Econet Wireless Zimbabwe strengthens its partnership with Ericsson for 5G expansion, including VoWiFi implementation, showcasing the technology's role in next-generation networks.
Strategic Outlook for Voice over Wi-Fi Industry Market
The VoWiFi market is poised for significant growth in the coming years, driven by technological advancements, increasing demand for seamless communication, and the expansion of 5G networks. Opportunities exist in developing innovative solutions, improving network reliability and security, and expanding into new markets. Focusing on seamless integration with unified communication platforms and enhanced user experiences will be crucial for success.
Voice over Wi-Fi Industry Segmentation
-
1. Voice Client
- 1.1. Integrated VoWiFi Client
- 1.2. Separate VoWiFi Client
- 1.3. Browser VoWiFi Client
-
2. Device Type
- 2.1. Smartphones
- 2.2. Tablets and Laptops
- 2.3. Other Device Types
Voice over Wi-Fi Industry Segmentation By Geography
- 1. North America
- 2. Europe
- 3. Asia Pacific
- 4. Latin America
- 5. Middle East and Africa
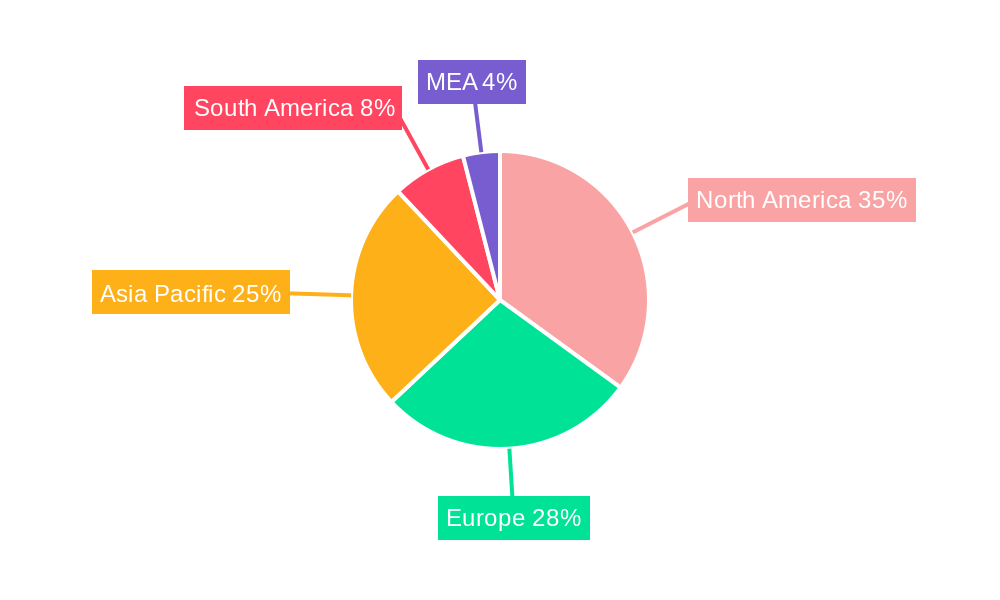
Voice over Wi-Fi Industry Regional Market Share
Geographic Coverage of Voice over Wi-Fi Industry
Voice over Wi-Fi Industry REPORT HIGHLIGHTS
| Aspects | Details |
|---|---|
| Study Period | 2020-2034 |
| Base Year | 2025 |
| Estimated Year | 2026 |
| Forecast Period | 2026-2034 |
| Historical Period | 2020-2025 |
| Growth Rate | CAGR of > 18.06% from 2020-2034 |
| Segmentation |
|
Table of Contents
- 1. Introduction
- 1.1. Research Scope
- 1.2. Market Segmentation
- 1.3. Research Objective
- 1.4. Definitions and Assumptions
- 2. Executive Summary
- 2.1. Market Snapshot
- 3. Market Dynamics
- 3.1. Market Drivers
- 3.2. Market Restrains
- 3.3. Market Trends
- 3.4. Market Opportunities
- 4. Market Factor Analysis
- 4.1. Porters Five Forces
- 4.1.1. Bargaining Power of Suppliers
- 4.1.2. Bargaining Power of Buyers
- 4.1.3. Threat of New Entrants
- 4.1.4. Threat of Substitutes
- 4.1.5. Competitive Rivalry
- 4.2. PESTEL analysis
- 4.3. BCG Analysis
- 4.3.1. Stars (High Growth, High Market Share)
- 4.3.2. Cash Cows (Low Growth, High Market Share)
- 4.3.3. Question Mark (High Growth, Low Market Share)
- 4.3.4. Dogs (Low Growth, Low Market Share)
- 4.4. Ansoff Matrix Analysis
- 4.5. Supply Chain Analysis
- 4.6. Regulatory Landscape
- 4.7. Current Market Potential and Opportunity Assessment (TAM–SAM–SOM Framework)
- 4.8. RAX Analyst Note
- 4.1. Porters Five Forces
- 5. Market Analysis, Insights and Forecast 2021-2033
- 5.1. Market Analysis, Insights and Forecast - by Voice Client
- 5.1.1. Integrated VoWiFi Client
- 5.1.2. Separate VoWiFi Client
- 5.1.3. Browser VoWiFi Client
- 5.2. Market Analysis, Insights and Forecast - by Device Type
- 5.2.1. Smartphones
- 5.2.2. Tablets and Laptops
- 5.2.3. Other Device Types
- 5.3. Market Analysis, Insights and Forecast - by Region
- 5.3.1. North America
- 5.3.2. Europe
- 5.3.3. Asia Pacific
- 5.3.4. Latin America
- 5.3.5. Middle East and Africa
- 5.1. Market Analysis, Insights and Forecast - by Voice Client
- 6. Global Voice over Wi-Fi Industry Analysis, Insights and Forecast, 2021-2033
- 6.1. Market Analysis, Insights and Forecast - by Voice Client
- 6.1.1. Integrated VoWiFi Client
- 6.1.2. Separate VoWiFi Client
- 6.1.3. Browser VoWiFi Client
- 6.2. Market Analysis, Insights and Forecast - by Device Type
- 6.2.1. Smartphones
- 6.2.2. Tablets and Laptops
- 6.2.3. Other Device Types
- 6.1. Market Analysis, Insights and Forecast - by Voice Client
- 7. North America Voice over Wi-Fi Industry Analysis, Insights and Forecast, 2020-2032
- 7.1. Market Analysis, Insights and Forecast - by Voice Client
- 7.1.1. Integrated VoWiFi Client
- 7.1.2. Separate VoWiFi Client
- 7.1.3. Browser VoWiFi Client
- 7.2. Market Analysis, Insights and Forecast - by Device Type
- 7.2.1. Smartphones
- 7.2.2. Tablets and Laptops
- 7.2.3. Other Device Types
- 7.1. Market Analysis, Insights and Forecast - by Voice Client
- 8. Europe Voice over Wi-Fi Industry Analysis, Insights and Forecast, 2020-2032
- 8.1. Market Analysis, Insights and Forecast - by Voice Client
- 8.1.1. Integrated VoWiFi Client
- 8.1.2. Separate VoWiFi Client
- 8.1.3. Browser VoWiFi Client
- 8.2. Market Analysis, Insights and Forecast - by Device Type
- 8.2.1. Smartphones
- 8.2.2. Tablets and Laptops
- 8.2.3. Other Device Types
- 8.1. Market Analysis, Insights and Forecast - by Voice Client
- 9. Asia Pacific Voice over Wi-Fi Industry Analysis, Insights and Forecast, 2020-2032
- 9.1. Market Analysis, Insights and Forecast - by Voice Client
- 9.1.1. Integrated VoWiFi Client
- 9.1.2. Separate VoWiFi Client
- 9.1.3. Browser VoWiFi Client
- 9.2. Market Analysis, Insights and Forecast - by Device Type
- 9.2.1. Smartphones
- 9.2.2. Tablets and Laptops
- 9.2.3. Other Device Types
- 9.1. Market Analysis, Insights and Forecast - by Voice Client
- 10. Latin America Voice over Wi-Fi Industry Analysis, Insights and Forecast, 2020-2032
- 10.1. Market Analysis, Insights and Forecast - by Voice Client
- 10.1.1. Integrated VoWiFi Client
- 10.1.2. Separate VoWiFi Client
- 10.1.3. Browser VoWiFi Client
- 10.2. Market Analysis, Insights and Forecast - by Device Type
- 10.2.1. Smartphones
- 10.2.2. Tablets and Laptops
- 10.2.3. Other Device Types
- 10.1. Market Analysis, Insights and Forecast - by Voice Client
- 11. Middle East and Africa Voice over Wi-Fi Industry Analysis, Insights and Forecast, 2020-2032
- 11.1. Market Analysis, Insights and Forecast - by Voice Client
- 11.1.1. Integrated VoWiFi Client
- 11.1.2. Separate VoWiFi Client
- 11.1.3. Browser VoWiFi Client
- 11.2. Market Analysis, Insights and Forecast - by Device Type
- 11.2.1. Smartphones
- 11.2.2. Tablets and Laptops
- 11.2.3. Other Device Types
- 11.1. Market Analysis, Insights and Forecast - by Voice Client
- 12. Competitive Analysis
- 12.1. Company Profiles
- 12.1.1 Aptilo Networks
- 12.1.1.1. Company Overview
- 12.1.1.2. Products
- 12.1.1.3. Company Financials
- 12.1.1.4. SWOT Analysis
- 12.1.2 Ericsson AB
- 12.1.2.1. Company Overview
- 12.1.2.2. Products
- 12.1.2.3. Company Financials
- 12.1.2.4. SWOT Analysis
- 12.1.3 Cisco Systems Inc
- 12.1.3.1. Company Overview
- 12.1.3.2. Products
- 12.1.3.3. Company Financials
- 12.1.3.4. SWOT Analysis
- 12.1.4 Mitel Networks Corporation
- 12.1.4.1. Company Overview
- 12.1.4.2. Products
- 12.1.4.3. Company Financials
- 12.1.4.4. SWOT Analysis
- 12.1.5 Huawei Technologies Co Ltd
- 12.1.5.1. Company Overview
- 12.1.5.2. Products
- 12.1.5.3. Company Financials
- 12.1.5.4. SWOT Analysis
- 12.1.6 Oracle Corporation
- 12.1.6.1. Company Overview
- 12.1.6.2. Products
- 12.1.6.3. Company Financials
- 12.1.6.4. SWOT Analysis
- 12.1.7 Nokia Corporation
- 12.1.7.1. Company Overview
- 12.1.7.2. Products
- 12.1.7.3. Company Financials
- 12.1.7.4. SWOT Analysis
- 12.1.8 Ribbon Communications
- 12.1.8.1. Company Overview
- 12.1.8.2. Products
- 12.1.8.3. Company Financials
- 12.1.8.4. SWOT Analysis
- 12.1.9 Alcatel-Lucent
- 12.1.9.1. Company Overview
- 12.1.9.2. Products
- 12.1.9.3. Company Financials
- 12.1.9.4. SWOT Analysis
- 12.1.10 KT Corporation
- 12.1.10.1. Company Overview
- 12.1.10.2. Products
- 12.1.10.3. Company Financials
- 12.1.10.4. SWOT Analysis
- 12.1.1 Aptilo Networks
- 12.2. Market Entropy
- 12.2.1 Company's Key Areas Served
- 12.2.2 Recent Developments
- 12.3. Company Market Share Analysis 2025
- 12.3.1 Top 5 Companies Market Share Analysis
- 12.3.2 Top 3 Companies Market Share Analysis
- 12.4. List of Potential Customers
- 13. Research Methodology
List of Figures
- Figure 1: Global Voice over Wi-Fi Industry Revenue Breakdown (Million, %) by Region 2025 & 2033
- Figure 2: Global Voice over Wi-Fi Industry Volume Breakdown (K Unit, %) by Region 2025 & 2033
- Figure 3: North America Voice over Wi-Fi Industry Revenue (Million), by Voice Client 2025 & 2033
- Figure 4: North America Voice over Wi-Fi Industry Volume (K Unit), by Voice Client 2025 & 2033
- Figure 5: North America Voice over Wi-Fi Industry Revenue Share (%), by Voice Client 2025 & 2033
- Figure 6: North America Voice over Wi-Fi Industry Volume Share (%), by Voice Client 2025 & 2033
- Figure 7: North America Voice over Wi-Fi Industry Revenue (Million), by Device Type 2025 & 2033
- Figure 8: North America Voice over Wi-Fi Industry Volume (K Unit), by Device Type 2025 & 2033
- Figure 9: North America Voice over Wi-Fi Industry Revenue Share (%), by Device Type 2025 & 2033
- Figure 10: North America Voice over Wi-Fi Industry Volume Share (%), by Device Type 2025 & 2033
- Figure 11: North America Voice over Wi-Fi Industry Revenue (Million), by Country 2025 & 2033
- Figure 12: North America Voice over Wi-Fi Industry Volume (K Unit), by Country 2025 & 2033
- Figure 13: North America Voice over Wi-Fi Industry Revenue Share (%), by Country 2025 & 2033
- Figure 14: North America Voice over Wi-Fi Industry Volume Share (%), by Country 2025 & 2033
- Figure 15: Europe Voice over Wi-Fi Industry Revenue (Million), by Voice Client 2025 & 2033
- Figure 16: Europe Voice over Wi-Fi Industry Volume (K Unit), by Voice Client 2025 & 2033
- Figure 17: Europe Voice over Wi-Fi Industry Revenue Share (%), by Voice Client 2025 & 2033
- Figure 18: Europe Voice over Wi-Fi Industry Volume Share (%), by Voice Client 2025 & 2033
- Figure 19: Europe Voice over Wi-Fi Industry Revenue (Million), by Device Type 2025 & 2033
- Figure 20: Europe Voice over Wi-Fi Industry Volume (K Unit), by Device Type 2025 & 2033
- Figure 21: Europe Voice over Wi-Fi Industry Revenue Share (%), by Device Type 2025 & 2033
- Figure 22: Europe Voice over Wi-Fi Industry Volume Share (%), by Device Type 2025 & 2033
- Figure 23: Europe Voice over Wi-Fi Industry Revenue (Million), by Country 2025 & 2033
- Figure 24: Europe Voice over Wi-Fi Industry Volume (K Unit), by Country 2025 & 2033
- Figure 25: Europe Voice over Wi-Fi Industry Revenue Share (%), by Country 2025 & 2033
- Figure 26: Europe Voice over Wi-Fi Industry Volume Share (%), by Country 2025 & 2033
- Figure 27: Asia Pacific Voice over Wi-Fi Industry Revenue (Million), by Voice Client 2025 & 2033
- Figure 28: Asia Pacific Voice over Wi-Fi Industry Volume (K Unit), by Voice Client 2025 & 2033
- Figure 29: Asia Pacific Voice over Wi-Fi Industry Revenue Share (%), by Voice Client 2025 & 2033
- Figure 30: Asia Pacific Voice over Wi-Fi Industry Volume Share (%), by Voice Client 2025 & 2033
- Figure 31: Asia Pacific Voice over Wi-Fi Industry Revenue (Million), by Device Type 2025 & 2033
- Figure 32: Asia Pacific Voice over Wi-Fi Industry Volume (K Unit), by Device Type 2025 & 2033
- Figure 33: Asia Pacific Voice over Wi-Fi Industry Revenue Share (%), by Device Type 2025 & 2033
- Figure 34: Asia Pacific Voice over Wi-Fi Industry Volume Share (%), by Device Type 2025 & 2033
- Figure 35: Asia Pacific Voice over Wi-Fi Industry Revenue (Million), by Country 2025 & 2033
- Figure 36: Asia Pacific Voice over Wi-Fi Industry Volume (K Unit), by Country 2025 & 2033
- Figure 37: Asia Pacific Voice over Wi-Fi Industry Revenue Share (%), by Country 2025 & 2033
- Figure 38: Asia Pacific Voice over Wi-Fi Industry Volume Share (%), by Country 2025 & 2033
- Figure 39: Latin America Voice over Wi-Fi Industry Revenue (Million), by Voice Client 2025 & 2033
- Figure 40: Latin America Voice over Wi-Fi Industry Volume (K Unit), by Voice Client 2025 & 2033
- Figure 41: Latin America Voice over Wi-Fi Industry Revenue Share (%), by Voice Client 2025 & 2033
- Figure 42: Latin America Voice over Wi-Fi Industry Volume Share (%), by Voice Client 2025 & 2033
- Figure 43: Latin America Voice over Wi-Fi Industry Revenue (Million), by Device Type 2025 & 2033
- Figure 44: Latin America Voice over Wi-Fi Industry Volume (K Unit), by Device Type 2025 & 2033
- Figure 45: Latin America Voice over Wi-Fi Industry Revenue Share (%), by Device Type 2025 & 2033
- Figure 46: Latin America Voice over Wi-Fi Industry Volume Share (%), by Device Type 2025 & 2033
- Figure 47: Latin America Voice over Wi-Fi Industry Revenue (Million), by Country 2025 & 2033
- Figure 48: Latin America Voice over Wi-Fi Industry Volume (K Unit), by Country 2025 & 2033
- Figure 49: Latin America Voice over Wi-Fi Industry Revenue Share (%), by Country 2025 & 2033
- Figure 50: Latin America Voice over Wi-Fi Industry Volume Share (%), by Country 2025 & 2033
- Figure 51: Middle East and Africa Voice over Wi-Fi Industry Revenue (Million), by Voice Client 2025 & 2033
- Figure 52: Middle East and Africa Voice over Wi-Fi Industry Volume (K Unit), by Voice Client 2025 & 2033
- Figure 53: Middle East and Africa Voice over Wi-Fi Industry Revenue Share (%), by Voice Client 2025 & 2033
- Figure 54: Middle East and Africa Voice over Wi-Fi Industry Volume Share (%), by Voice Client 2025 & 2033
- Figure 55: Middle East and Africa Voice over Wi-Fi Industry Revenue (Million), by Device Type 2025 & 2033
- Figure 56: Middle East and Africa Voice over Wi-Fi Industry Volume (K Unit), by Device Type 2025 & 2033
- Figure 57: Middle East and Africa Voice over Wi-Fi Industry Revenue Share (%), by Device Type 2025 & 2033
- Figure 58: Middle East and Africa Voice over Wi-Fi Industry Volume Share (%), by Device Type 2025 & 2033
- Figure 59: Middle East and Africa Voice over Wi-Fi Industry Revenue (Million), by Country 2025 & 2033
- Figure 60: Middle East and Africa Voice over Wi-Fi Industry Volume (K Unit), by Country 2025 & 2033
- Figure 61: Middle East and Africa Voice over Wi-Fi Industry Revenue Share (%), by Country 2025 & 2033
- Figure 62: Middle East and Africa Voice over Wi-Fi Industry Volume Share (%), by Country 2025 & 2033
List of Tables
- Table 1: Global Voice over Wi-Fi Industry Revenue Million Forecast, by Voice Client 2020 & 2033
- Table 2: Global Voice over Wi-Fi Industry Volume K Unit Forecast, by Voice Client 2020 & 2033
- Table 3: Global Voice over Wi-Fi Industry Revenue Million Forecast, by Device Type 2020 & 2033
- Table 4: Global Voice over Wi-Fi Industry Volume K Unit Forecast, by Device Type 2020 & 2033
- Table 5: Global Voice over Wi-Fi Industry Revenue Million Forecast, by Region 2020 & 2033
- Table 6: Global Voice over Wi-Fi Industry Volume K Unit Forecast, by Region 2020 & 2033
- Table 7: Global Voice over Wi-Fi Industry Revenue Million Forecast, by Voice Client 2020 & 2033
- Table 8: Global Voice over Wi-Fi Industry Volume K Unit Forecast, by Voice Client 2020 & 2033
- Table 9: Global Voice over Wi-Fi Industry Revenue Million Forecast, by Device Type 2020 & 2033
- Table 10: Global Voice over Wi-Fi Industry Volume K Unit Forecast, by Device Type 2020 & 2033
- Table 11: Global Voice over Wi-Fi Industry Revenue Million Forecast, by Country 2020 & 2033
- Table 12: Global Voice over Wi-Fi Industry Volume K Unit Forecast, by Country 2020 & 2033
- Table 13: Global Voice over Wi-Fi Industry Revenue Million Forecast, by Voice Client 2020 & 2033
- Table 14: Global Voice over Wi-Fi Industry Volume K Unit Forecast, by Voice Client 2020 & 2033
- Table 15: Global Voice over Wi-Fi Industry Revenue Million Forecast, by Device Type 2020 & 2033
- Table 16: Global Voice over Wi-Fi Industry Volume K Unit Forecast, by Device Type 2020 & 2033
- Table 17: Global Voice over Wi-Fi Industry Revenue Million Forecast, by Country 2020 & 2033
- Table 18: Global Voice over Wi-Fi Industry Volume K Unit Forecast, by Country 2020 & 2033
- Table 19: Global Voice over Wi-Fi Industry Revenue Million Forecast, by Voice Client 2020 & 2033
- Table 20: Global Voice over Wi-Fi Industry Volume K Unit Forecast, by Voice Client 2020 & 2033
- Table 21: Global Voice over Wi-Fi Industry Revenue Million Forecast, by Device Type 2020 & 2033
- Table 22: Global Voice over Wi-Fi Industry Volume K Unit Forecast, by Device Type 2020 & 2033
- Table 23: Global Voice over Wi-Fi Industry Revenue Million Forecast, by Country 2020 & 2033
- Table 24: Global Voice over Wi-Fi Industry Volume K Unit Forecast, by Country 2020 & 2033
- Table 25: Global Voice over Wi-Fi Industry Revenue Million Forecast, by Voice Client 2020 & 2033
- Table 26: Global Voice over Wi-Fi Industry Volume K Unit Forecast, by Voice Client 2020 & 2033
- Table 27: Global Voice over Wi-Fi Industry Revenue Million Forecast, by Device Type 2020 & 2033
- Table 28: Global Voice over Wi-Fi Industry Volume K Unit Forecast, by Device Type 2020 & 2033
- Table 29: Global Voice over Wi-Fi Industry Revenue Million Forecast, by Country 2020 & 2033
- Table 30: Global Voice over Wi-Fi Industry Volume K Unit Forecast, by Country 2020 & 2033
- Table 31: Global Voice over Wi-Fi Industry Revenue Million Forecast, by Voice Client 2020 & 2033
- Table 32: Global Voice over Wi-Fi Industry Volume K Unit Forecast, by Voice Client 2020 & 2033
- Table 33: Global Voice over Wi-Fi Industry Revenue Million Forecast, by Device Type 2020 & 2033
- Table 34: Global Voice over Wi-Fi Industry Volume K Unit Forecast, by Device Type 2020 & 2033
- Table 35: Global Voice over Wi-Fi Industry Revenue Million Forecast, by Country 2020 & 2033
- Table 36: Global Voice over Wi-Fi Industry Volume K Unit Forecast, by Country 2020 & 2033
Frequently Asked Questions
1. What is the projected Compound Annual Growth Rate (CAGR) of the Voice over Wi-Fi Industry?
The projected CAGR is approximately > 18.06%.
2. Which companies are prominent players in the Voice over Wi-Fi Industry?
Key companies in the market include Aptilo Networks, Ericsson AB, Cisco Systems Inc, Mitel Networks Corporation, Huawei Technologies Co Ltd, Oracle Corporation, Nokia Corporation, Ribbon Communications, Alcatel-Lucent, KT Corporation.
3. What are the main segments of the Voice over Wi-Fi Industry?
The market segments include Voice Client, Device Type.
4. Can you provide details about the market size?
The market size is estimated to be USD 8.12 Million as of 2022.
5. What are some drivers contributing to market growth?
Increasing Internet Penetration; Reduction of Indoor Coverage Problems.
6. What are the notable trends driving market growth?
Public WiFi Hotspot to Gain Significant Market Share.
7. Are there any restraints impacting market growth?
Maintenance Problems Due to Carriers.
8. Can you provide examples of recent developments in the market?
October 2023 - Bharti Airtel, one of India’s leading telecommunications service providers, announced that it has partnered with Microsoft to provide Indian organizations calling services over Microsoft Teams through an integration with Airtel IQ. With Airtel IQ for Microsoft Teams, enterprises could enjoy greater flexibility in connecting with customers across the country over the fixed line through the internet.
9. What pricing options are available for accessing the report?
Pricing options include single-user, multi-user, and enterprise licenses priced at USD 4750, USD 5250, and USD 8750 respectively.
10. Is the market size provided in terms of value or volume?
The market size is provided in terms of value, measured in Million and volume, measured in K Unit.
11. Are there any specific market keywords associated with the report?
Yes, the market keyword associated with the report is "Voice over Wi-Fi Industry," which aids in identifying and referencing the specific market segment covered.
12. How do I determine which pricing option suits my needs best?
The pricing options vary based on user requirements and access needs. Individual users may opt for single-user licenses, while businesses requiring broader access may choose multi-user or enterprise licenses for cost-effective access to the report.
13. Are there any additional resources or data provided in the Voice over Wi-Fi Industry report?
While the report offers comprehensive insights, it's advisable to review the specific contents or supplementary materials provided to ascertain if additional resources or data are available.
14. How can I stay updated on further developments or reports in the Voice over Wi-Fi Industry?
To stay informed about further developments, trends, and reports in the Voice over Wi-Fi Industry, consider subscribing to industry newsletters, following relevant companies and organizations, or regularly checking reputable industry news sources and publications.
Methodology
Step 1 - Identification of Relevant Samples Size from Population Database


Step 2 - Approaches for Defining Global Market Size (Value, Volume* & Price*)

Note*: In applicable scenarios
Step 3 - Data Sources
Primary Research
- Web Analytics
- Survey Reports
- Research Institute
- Latest Research Reports
- Opinion Leaders
Secondary Research
- Annual Reports
- White Paper
- Latest Press Release
- Industry Association
- Paid Database
- Investor Presentations

Step 4 - Data Triangulation
Involves using different sources of information in order to increase the validity of a study
These sources are likely to be stakeholders in a program - participants, other researchers, program staff, other community members, and so on.
Then we put all data in single framework & apply various statistical tools to find out the dynamic on the market.
During the analysis stage, feedback from the stakeholder groups would be compared to determine areas of agreement as well as areas of divergence