
Key Insights
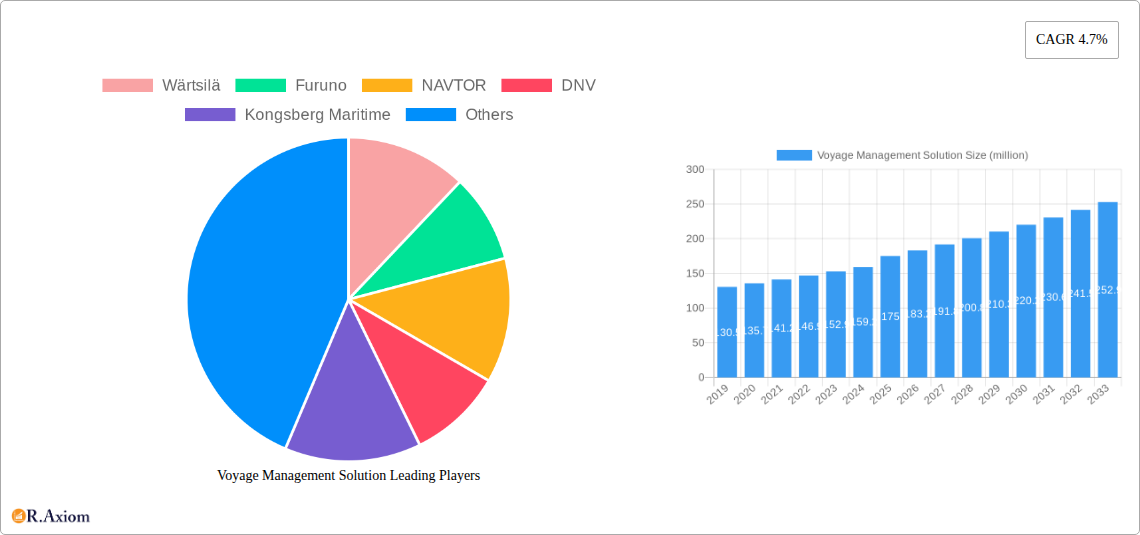
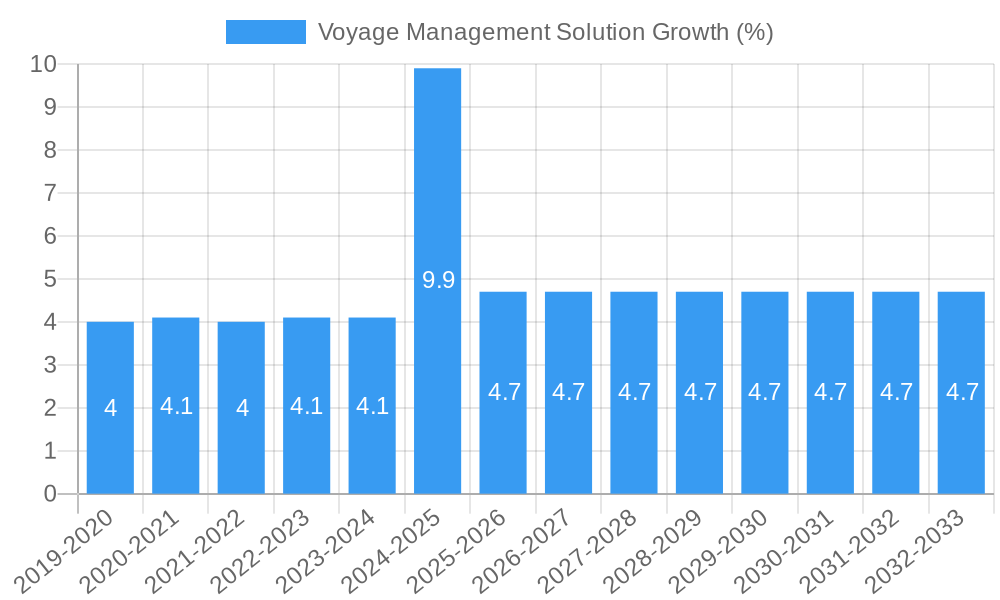
The global Voyage Management Solution market is poised for significant expansion, projected to reach an estimated \$175 million by 2025 and steadily grow at a Compound Annual Growth Rate (CAGR) of 4.7% through 2033. This robust growth is propelled by an increasing demand for enhanced operational efficiency and safety across various maritime sectors. Commercial shipping companies are increasingly adopting these solutions to optimize routes, manage fuel consumption, and improve overall fleet performance, driven by the need to navigate complex global trade regulations and competitive pressures. The Naval and Defense sector also represents a crucial segment, leveraging voyage management systems for strategic planning, real-time situational awareness, and enhanced mission effectiveness. Furthermore, the burgeoning offshore industry, encompassing oil and gas exploration and renewable energy installations, requires sophisticated voyage management tools for complex logistical operations in challenging environments.
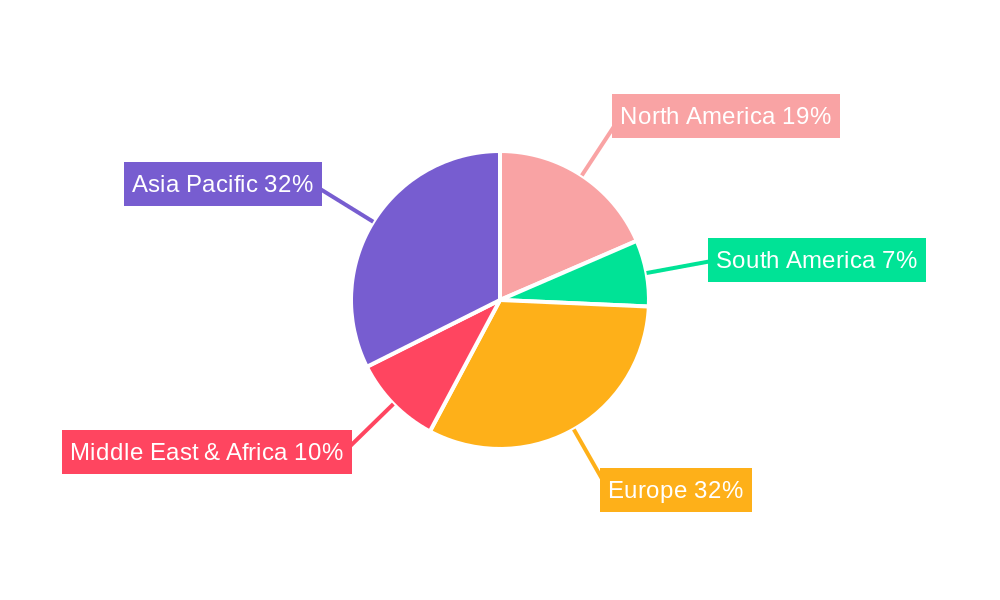
The market's dynamism is further shaped by evolving trends such as the widespread adoption of cloud-based solutions, offering scalability, accessibility, and advanced data analytics capabilities. While on-premises solutions continue to hold relevance for organizations with specific security or infrastructure requirements, the shift towards cloud integration is a defining characteristic of the modern maritime landscape. Key players like Wärtsilä, Furuno, NAVTOR, and DNV are at the forefront of innovation, introducing intelligent features such as AI-powered route optimization, predictive maintenance, and enhanced communication tools. These advancements are crucial in overcoming challenges such as stringent environmental regulations, the need for greater crew welfare, and the increasing complexity of maritime operations. The Asia Pacific region is anticipated to be a significant contributor to market growth, driven by its extensive shipping infrastructure and expanding trade volumes.
Voyage Management Solution Market Concentration & Innovation
The global Voyage Management Solution market is characterized by a moderate to high concentration, with key players like Wärtsilä, Furuno, NAVTOR, DNV, Kongsberg Maritime, ChartWorld, MarineTraffic, StormGeo, SevenCs, Transas Marine, i4 Insight, ShipNet, Orca AI, Dataloy Systems, NAPA, and Raymarine driving innovation and market share. These companies are actively investing in research and development to introduce advanced features, thereby influencing market dynamics. Innovation is primarily fueled by the increasing demand for enhanced operational efficiency, improved safety at sea, and stringent regulatory compliance. Regulatory frameworks, such as those from the International Maritime Organization (IMO) concerning emissions and navigation safety, are significant drivers for the adoption of sophisticated voyage management systems. Product substitutes, while present in the form of fragmented, standalone software solutions, are gradually being consolidated by integrated voyage management platforms that offer comprehensive functionalities. End-user trends indicate a growing preference for cloud-based solutions due to their scalability, accessibility, and cost-effectiveness. Mergers and Acquisition (M&A) activities, with estimated deal values in the hundreds of millions, are also shaping the market landscape, enabling companies to expand their product portfolios and geographic reach. The market share distribution among leading players is dynamic, with established entities holding substantial portions and new entrants vying for recognition through niche offerings.
Voyage Management Solution Industry Trends & Insights
The Voyage Management Solution industry is experiencing robust growth, projected to continue its upward trajectory throughout the forecast period. This expansion is underpinned by a multitude of factors, including the escalating complexity of global maritime trade, the imperative for enhanced vessel performance optimization, and the continuous evolution of digital technologies within the shipping sector. Market penetration is deepening as more commercial shipping companies, naval and defense organizations, and offshore industry players recognize the critical role of efficient voyage planning and execution in achieving operational excellence and profitability. The Compound Annual Growth Rate (CAGR) for this market is estimated to be in the high single digits, reflecting sustained demand and significant investment. Technological disruptions, such as the integration of Artificial Intelligence (AI) and Machine Learning (ML) for predictive analytics, route optimization, and fuel efficiency, are revolutionizing how voyages are managed. Furthermore, the increasing adoption of the Internet of Things (IoT) in maritime, enabling real-time data collection from various vessel sensors and systems, is providing unprecedented insights for voyage management. Consumer preferences are shifting towards integrated, user-friendly platforms that offer a holistic view of vessel operations, from pre-voyage planning and execution to post-voyage analysis. This demand is pushing vendors to develop comprehensive solutions that cater to the diverse needs of the maritime ecosystem. Competitive dynamics are intense, with companies differentiating themselves through proprietary technologies, strategic partnerships, and the ability to offer tailored solutions for specific segments. The ongoing digitalization of the maritime industry, coupled with the need for greater transparency and sustainability, will continue to drive innovation and market growth in the voyage management solution sector. The market size is projected to reach several tens of billions of dollars by the end of the forecast period.
Dominant Markets & Segments in Voyage Management Solution
The Voyage Management Solution market exhibits distinct regional and segment-specific dominance. In terms of application, Commercial Shipping Companies represent the largest and most influential segment, accounting for a substantial market share estimated in the tens of billions of dollars. The sheer volume of global trade, coupled with the constant pressure to optimize operational costs and ensure timely deliveries, makes this segment a primary driver for voyage management solutions. Economic policies globally that support free trade and efficient logistics further bolster this segment's growth. The Naval and Defense segment, while smaller in terms of the number of vessels, commands significant spending due to the specialized and high-stakes nature of naval operations, requiring advanced navigation, security, and operational planning capabilities. The Offshore Industry, encompassing oil and gas exploration and renewable energy installations, also contributes significantly, driven by the unique challenges of operating in remote and often harsh environments, necessitating robust voyage planning and dynamic route adjustments.
Geographically, the Asia-Pacific region is emerging as a dominant market for voyage management solutions, propelled by the burgeoning maritime trade activities, rapid expansion of port infrastructure, and the increasing adoption of advanced technologies by shipping companies in countries like China, Japan, and South Korea. The substantial investment in new vessel construction and modernization of existing fleets within this region further fuels demand. North America and Europe remain mature markets with a strong emphasis on regulatory compliance and technological innovation, where established players continue to hold significant market presence.
By type, Cloud-based solutions are rapidly gaining dominance, with projected market sizes reaching tens of billions of dollars. Their scalability, flexibility, and the ability to integrate with other digital maritime platforms make them increasingly attractive to a wide range of users. On-Premises solutions, while still relevant for organizations with specific security or connectivity concerns, are seeing slower growth compared to their cloud counterparts. The key drivers for cloud-based adoption include reduced IT infrastructure costs, easier software updates, and enhanced accessibility from anywhere, anytime. The increasing availability of high-speed internet connectivity across maritime routes further supports the growth of cloud-based voyage management solutions.
Voyage Management Solution Product Developments
Product developments in the Voyage Management Solution market are characterized by a focus on enhanced connectivity, real-time data analytics, and integrated functionalities. Innovations include the development of AI-powered route optimization engines that can predict weather patterns, identify optimal speeds for fuel efficiency, and dynamically adjust itineraries to avoid congestion and hazardous conditions. Advanced electronic chart display and information system (ECDIS) integration, coupled with sophisticated voyage planning tools, ensures compliance with international regulations and improves navigational safety. Competitive advantages are being built through the seamless integration of voyage management with fleet performance monitoring, cargo management, and crew welfare systems, offering a unified operational dashboard. The market is seeing a trend towards modular solutions that can be tailored to specific vessel types and operational needs, providing greater flexibility and value to end-users.
Voyage Management Solution Report Scope & Segmentation Analysis
This report provides a comprehensive analysis of the Voyage Management Solution market, segmented by Application and Type. The Application segments include Commercial Shipping Companies, Naval and Defense, Offshore Industry, and Others. Commercial Shipping Companies are projected to represent the largest market share, with growth driven by global trade volumes and the pursuit of operational efficiencies. The Naval and Defense segment, though smaller, is expected to exhibit steady growth due to the specialized requirements of military operations and government investments in maritime security. The Offshore Industry is poised for significant expansion, fueled by offshore energy exploration and development activities. The Type segmentation categorizes solutions into Cloud-based and On-Premises. Cloud-based solutions are anticipated to dominate the market, driven by their scalability, accessibility, and cost-effectiveness, with strong growth projections in the tens of billions of dollars. On-Premises solutions will cater to specific niche requirements, maintaining a stable, albeit slower, growth rate. Competitive dynamics within each segment are characterized by varying levels of innovation, pricing strategies, and customer support.
Key Drivers of Voyage Management Solution Growth
The growth of the Voyage Management Solution market is propelled by several interconnected drivers. The increasing globalization of trade necessitates more efficient and predictable maritime logistics, driving demand for advanced voyage planning and execution tools. Stricter environmental regulations, such as the IMO's decarbonization targets, are pushing shipping companies to adopt solutions that optimize fuel consumption and reduce emissions. Technological advancements, including the proliferation of IoT devices on vessels and the development of AI for predictive analytics, are enabling more sophisticated route optimization, weather forecasting, and operational efficiency improvements. Furthermore, the ongoing digitalization of the maritime industry is creating a demand for integrated software solutions that can streamline various aspects of vessel management. The inherent need for enhanced maritime safety and security also contributes to the adoption of robust voyage management systems.
Challenges in the Voyage Management Solution Sector
Despite the robust growth, the Voyage Management Solution sector faces several challenges. The high initial investment cost for implementing comprehensive systems can be a barrier for smaller shipping companies. Navigational system complexities and the need for extensive crew training can also hinder adoption. Regulatory hurdles, although drivers for adoption, also present challenges in ensuring compliance across diverse international waters and varied national regulations. Supply chain issues related to the integration of hardware components and software updates can sometimes lead to delays. Intense competitive pressures among established players and emerging technology providers can lead to price wars and margin erosion. Furthermore, the cybersecurity of maritime digital systems is a growing concern, requiring continuous investment in robust security protocols.
Emerging Opportunities in Voyage Management Solution
Emerging opportunities in the Voyage Management Solution market are diverse and promising. The increasing focus on sustainability and decarbonization presents a significant opportunity for solutions that can optimize fuel efficiency and support the transition to greener shipping technologies. The growing adoption of autonomous shipping technologies will require advanced voyage management systems capable of handling complex decision-making and real-time situational awareness. The expansion of offshore renewable energy sectors, such as wind farms, will create new demands for specialized voyage management solutions for installation and maintenance vessels. Furthermore, the development of smart shipping ecosystems, integrating various maritime technologies and data sources, offers opportunities for voyage management platforms to become central hubs for operational intelligence and decision support. The increasing demand for real-time vessel tracking and transparency in the supply chain also fuels the need for advanced voyage management functionalities.
Leading Players in the Voyage Management Solution Market
- Wärtsilä
- Furuno
- NAVTOR
- DNV
- Kongsberg Maritime
- ChartWorld
- MarineTraffic
- StormGeo
- SevenCs
- Transas Marine
- i4 Insight
- ShipNet
- Orca AI
- Dataloy Systems
- NAPA
- Raymarine
Key Developments in Voyage Management Solution Industry
- 2023/06: Launch of advanced AI-driven route optimization algorithms by leading vendors, significantly improving fuel efficiency and reducing voyage times.
- 2023/10: Increased integration of cloud-based voyage management solutions with IoT platforms for enhanced real-time data collection and analysis, leading to better predictive maintenance and operational insights.
- 2024/02: Major players announce strategic partnerships to offer comprehensive digital maritime solutions, including voyage management, fleet performance monitoring, and cybersecurity services.
- 2024/07: Advancements in ECDIS technology with enhanced visualization capabilities and improved integration with voyage planning tools, prioritizing navigational safety and regulatory compliance.
- 2025/01: Growing adoption of predictive analytics for weather forecasting and risk assessment within voyage management systems, leading to more proactive decision-making in challenging maritime conditions.
Strategic Outlook for Voyage Management Solution Market
The strategic outlook for the Voyage Management Solution market is exceptionally positive, driven by ongoing digitalization and the imperative for operational efficiency and sustainability in the maritime industry. Future growth catalysts include the continued integration of AI and ML for predictive analytics, leading to further optimization of fuel consumption and voyage execution. The growing emphasis on decarbonization will spur demand for solutions that support eco-friendly operations. The development of autonomous shipping will necessitate highly sophisticated and integrated voyage management systems. Strategic partnerships and M&A activities are expected to continue, leading to market consolidation and the emergence of comprehensive digital maritime platforms. The increasing adoption of cloud-based solutions will offer greater flexibility and scalability. The market is well-positioned for sustained expansion, with innovation and adaptability being key to success.
Voyage Management Solution Segmentation
-
1. Application
- 1.1. Commercial Shipping Companies
- 1.2. Naval and Defense
- 1.3. Offshore Industry
- 1.4. Others
-
2. Type
- 2.1. Cloud-based
- 2.2. On-Premises
Voyage Management Solution Segmentation By Geography
-
1. North America
- 1.1. United States
- 1.2. Canada
- 1.3. Mexico
-
2. South America
- 2.1. Brazil
- 2.2. Argentina
- 2.3. Rest of South America
-
3. Europe
- 3.1. United Kingdom
- 3.2. Germany
- 3.3. France
- 3.4. Italy
- 3.5. Spain
- 3.6. Russia
- 3.7. Benelux
- 3.8. Nordics
- 3.9. Rest of Europe
-
4. Middle East & Africa
- 4.1. Turkey
- 4.2. Israel
- 4.3. GCC
- 4.4. North Africa
- 4.5. South Africa
- 4.6. Rest of Middle East & Africa
-
5. Asia Pacific
- 5.1. China
- 5.2. India
- 5.3. Japan
- 5.4. South Korea
- 5.5. ASEAN
- 5.6. Oceania
- 5.7. Rest of Asia Pacific
Voyage Management Solution REPORT HIGHLIGHTS
| Aspects | Details |
|---|---|
| Study Period | 2019-2033 |
| Base Year | 2024 |
| Estimated Year | 2025 |
| Forecast Period | 2025-2033 |
| Historical Period | 2019-2024 |
| Growth Rate | CAGR of 4.7% from 2019-2033 |
| Segmentation |
|
Table of Contents
- 1. Introduction
- 1.1. Research Scope
- 1.2. Market Segmentation
- 1.3. Research Methodology
- 1.4. Definitions and Assumptions
- 2. Executive Summary
- 2.1. Introduction
- 3. Market Dynamics
- 3.1. Introduction
- 3.2. Market Drivers
- 3.3. Market Restrains
- 3.4. Market Trends
- 4. Market Factor Analysis
- 4.1. Porters Five Forces
- 4.2. Supply/Value Chain
- 4.3. PESTEL analysis
- 4.4. Market Entropy
- 4.5. Patent/Trademark Analysis
- 5. Global Voyage Management Solution Analysis, Insights and Forecast, 2019-2031
- 5.1. Market Analysis, Insights and Forecast - by Application
- 5.1.1. Commercial Shipping Companies
- 5.1.2. Naval and Defense
- 5.1.3. Offshore Industry
- 5.1.4. Others
- 5.2. Market Analysis, Insights and Forecast - by Type
- 5.2.1. Cloud-based
- 5.2.2. On-Premises
- 5.3. Market Analysis, Insights and Forecast - by Region
- 5.3.1. North America
- 5.3.2. South America
- 5.3.3. Europe
- 5.3.4. Middle East & Africa
- 5.3.5. Asia Pacific
- 5.1. Market Analysis, Insights and Forecast - by Application
- 6. North America Voyage Management Solution Analysis, Insights and Forecast, 2019-2031
- 6.1. Market Analysis, Insights and Forecast - by Application
- 6.1.1. Commercial Shipping Companies
- 6.1.2. Naval and Defense
- 6.1.3. Offshore Industry
- 6.1.4. Others
- 6.2. Market Analysis, Insights and Forecast - by Type
- 6.2.1. Cloud-based
- 6.2.2. On-Premises
- 6.1. Market Analysis, Insights and Forecast - by Application
- 7. South America Voyage Management Solution Analysis, Insights and Forecast, 2019-2031
- 7.1. Market Analysis, Insights and Forecast - by Application
- 7.1.1. Commercial Shipping Companies
- 7.1.2. Naval and Defense
- 7.1.3. Offshore Industry
- 7.1.4. Others
- 7.2. Market Analysis, Insights and Forecast - by Type
- 7.2.1. Cloud-based
- 7.2.2. On-Premises
- 7.1. Market Analysis, Insights and Forecast - by Application
- 8. Europe Voyage Management Solution Analysis, Insights and Forecast, 2019-2031
- 8.1. Market Analysis, Insights and Forecast - by Application
- 8.1.1. Commercial Shipping Companies
- 8.1.2. Naval and Defense
- 8.1.3. Offshore Industry
- 8.1.4. Others
- 8.2. Market Analysis, Insights and Forecast - by Type
- 8.2.1. Cloud-based
- 8.2.2. On-Premises
- 8.1. Market Analysis, Insights and Forecast - by Application
- 9. Middle East & Africa Voyage Management Solution Analysis, Insights and Forecast, 2019-2031
- 9.1. Market Analysis, Insights and Forecast - by Application
- 9.1.1. Commercial Shipping Companies
- 9.1.2. Naval and Defense
- 9.1.3. Offshore Industry
- 9.1.4. Others
- 9.2. Market Analysis, Insights and Forecast - by Type
- 9.2.1. Cloud-based
- 9.2.2. On-Premises
- 9.1. Market Analysis, Insights and Forecast - by Application
- 10. Asia Pacific Voyage Management Solution Analysis, Insights and Forecast, 2019-2031
- 10.1. Market Analysis, Insights and Forecast - by Application
- 10.1.1. Commercial Shipping Companies
- 10.1.2. Naval and Defense
- 10.1.3. Offshore Industry
- 10.1.4. Others
- 10.2. Market Analysis, Insights and Forecast - by Type
- 10.2.1. Cloud-based
- 10.2.2. On-Premises
- 10.1. Market Analysis, Insights and Forecast - by Application
- 11. Competitive Analysis
- 11.1. Global Market Share Analysis 2024
- 11.2. Company Profiles
- 11.2.1 Wärtsilä
- 11.2.1.1. Overview
- 11.2.1.2. Products
- 11.2.1.3. SWOT Analysis
- 11.2.1.4. Recent Developments
- 11.2.1.5. Financials (Based on Availability)
- 11.2.2 Furuno
- 11.2.2.1. Overview
- 11.2.2.2. Products
- 11.2.2.3. SWOT Analysis
- 11.2.2.4. Recent Developments
- 11.2.2.5. Financials (Based on Availability)
- 11.2.3 NAVTOR
- 11.2.3.1. Overview
- 11.2.3.2. Products
- 11.2.3.3. SWOT Analysis
- 11.2.3.4. Recent Developments
- 11.2.3.5. Financials (Based on Availability)
- 11.2.4 DNV
- 11.2.4.1. Overview
- 11.2.4.2. Products
- 11.2.4.3. SWOT Analysis
- 11.2.4.4. Recent Developments
- 11.2.4.5. Financials (Based on Availability)
- 11.2.5 Kongsberg Maritime
- 11.2.5.1. Overview
- 11.2.5.2. Products
- 11.2.5.3. SWOT Analysis
- 11.2.5.4. Recent Developments
- 11.2.5.5. Financials (Based on Availability)
- 11.2.6 ChartWorld
- 11.2.6.1. Overview
- 11.2.6.2. Products
- 11.2.6.3. SWOT Analysis
- 11.2.6.4. Recent Developments
- 11.2.6.5. Financials (Based on Availability)
- 11.2.7 MarineTraffic
- 11.2.7.1. Overview
- 11.2.7.2. Products
- 11.2.7.3. SWOT Analysis
- 11.2.7.4. Recent Developments
- 11.2.7.5. Financials (Based on Availability)
- 11.2.8 StormGeo
- 11.2.8.1. Overview
- 11.2.8.2. Products
- 11.2.8.3. SWOT Analysis
- 11.2.8.4. Recent Developments
- 11.2.8.5. Financials (Based on Availability)
- 11.2.9 SevenCs
- 11.2.9.1. Overview
- 11.2.9.2. Products
- 11.2.9.3. SWOT Analysis
- 11.2.9.4. Recent Developments
- 11.2.9.5. Financials (Based on Availability)
- 11.2.10 Transas Marine
- 11.2.10.1. Overview
- 11.2.10.2. Products
- 11.2.10.3. SWOT Analysis
- 11.2.10.4. Recent Developments
- 11.2.10.5. Financials (Based on Availability)
- 11.2.11 i4 Insight
- 11.2.11.1. Overview
- 11.2.11.2. Products
- 11.2.11.3. SWOT Analysis
- 11.2.11.4. Recent Developments
- 11.2.11.5. Financials (Based on Availability)
- 11.2.12 ShipNet
- 11.2.12.1. Overview
- 11.2.12.2. Products
- 11.2.12.3. SWOT Analysis
- 11.2.12.4. Recent Developments
- 11.2.12.5. Financials (Based on Availability)
- 11.2.13 Orca AI
- 11.2.13.1. Overview
- 11.2.13.2. Products
- 11.2.13.3. SWOT Analysis
- 11.2.13.4. Recent Developments
- 11.2.13.5. Financials (Based on Availability)
- 11.2.14 Dataloy Systems
- 11.2.14.1. Overview
- 11.2.14.2. Products
- 11.2.14.3. SWOT Analysis
- 11.2.14.4. Recent Developments
- 11.2.14.5. Financials (Based on Availability)
- 11.2.15 NAPA
- 11.2.15.1. Overview
- 11.2.15.2. Products
- 11.2.15.3. SWOT Analysis
- 11.2.15.4. Recent Developments
- 11.2.15.5. Financials (Based on Availability)
- 11.2.16 Raymarine
- 11.2.16.1. Overview
- 11.2.16.2. Products
- 11.2.16.3. SWOT Analysis
- 11.2.16.4. Recent Developments
- 11.2.16.5. Financials (Based on Availability)
- 11.2.1 Wärtsilä
List of Figures
- Figure 1: Global Voyage Management Solution Revenue Breakdown (million, %) by Region 2024 & 2032
- Figure 2: North America Voyage Management Solution Revenue (million), by Application 2024 & 2032
- Figure 3: North America Voyage Management Solution Revenue Share (%), by Application 2024 & 2032
- Figure 4: North America Voyage Management Solution Revenue (million), by Type 2024 & 2032
- Figure 5: North America Voyage Management Solution Revenue Share (%), by Type 2024 & 2032
- Figure 6: North America Voyage Management Solution Revenue (million), by Country 2024 & 2032
- Figure 7: North America Voyage Management Solution Revenue Share (%), by Country 2024 & 2032
- Figure 8: South America Voyage Management Solution Revenue (million), by Application 2024 & 2032
- Figure 9: South America Voyage Management Solution Revenue Share (%), by Application 2024 & 2032
- Figure 10: South America Voyage Management Solution Revenue (million), by Type 2024 & 2032
- Figure 11: South America Voyage Management Solution Revenue Share (%), by Type 2024 & 2032
- Figure 12: South America Voyage Management Solution Revenue (million), by Country 2024 & 2032
- Figure 13: South America Voyage Management Solution Revenue Share (%), by Country 2024 & 2032
- Figure 14: Europe Voyage Management Solution Revenue (million), by Application 2024 & 2032
- Figure 15: Europe Voyage Management Solution Revenue Share (%), by Application 2024 & 2032
- Figure 16: Europe Voyage Management Solution Revenue (million), by Type 2024 & 2032
- Figure 17: Europe Voyage Management Solution Revenue Share (%), by Type 2024 & 2032
- Figure 18: Europe Voyage Management Solution Revenue (million), by Country 2024 & 2032
- Figure 19: Europe Voyage Management Solution Revenue Share (%), by Country 2024 & 2032
- Figure 20: Middle East & Africa Voyage Management Solution Revenue (million), by Application 2024 & 2032
- Figure 21: Middle East & Africa Voyage Management Solution Revenue Share (%), by Application 2024 & 2032
- Figure 22: Middle East & Africa Voyage Management Solution Revenue (million), by Type 2024 & 2032
- Figure 23: Middle East & Africa Voyage Management Solution Revenue Share (%), by Type 2024 & 2032
- Figure 24: Middle East & Africa Voyage Management Solution Revenue (million), by Country 2024 & 2032
- Figure 25: Middle East & Africa Voyage Management Solution Revenue Share (%), by Country 2024 & 2032
- Figure 26: Asia Pacific Voyage Management Solution Revenue (million), by Application 2024 & 2032
- Figure 27: Asia Pacific Voyage Management Solution Revenue Share (%), by Application 2024 & 2032
- Figure 28: Asia Pacific Voyage Management Solution Revenue (million), by Type 2024 & 2032
- Figure 29: Asia Pacific Voyage Management Solution Revenue Share (%), by Type 2024 & 2032
- Figure 30: Asia Pacific Voyage Management Solution Revenue (million), by Country 2024 & 2032
- Figure 31: Asia Pacific Voyage Management Solution Revenue Share (%), by Country 2024 & 2032
List of Tables
- Table 1: Global Voyage Management Solution Revenue million Forecast, by Region 2019 & 2032
- Table 2: Global Voyage Management Solution Revenue million Forecast, by Application 2019 & 2032
- Table 3: Global Voyage Management Solution Revenue million Forecast, by Type 2019 & 2032
- Table 4: Global Voyage Management Solution Revenue million Forecast, by Region 2019 & 2032
- Table 5: Global Voyage Management Solution Revenue million Forecast, by Application 2019 & 2032
- Table 6: Global Voyage Management Solution Revenue million Forecast, by Type 2019 & 2032
- Table 7: Global Voyage Management Solution Revenue million Forecast, by Country 2019 & 2032
- Table 8: United States Voyage Management Solution Revenue (million) Forecast, by Application 2019 & 2032
- Table 9: Canada Voyage Management Solution Revenue (million) Forecast, by Application 2019 & 2032
- Table 10: Mexico Voyage Management Solution Revenue (million) Forecast, by Application 2019 & 2032
- Table 11: Global Voyage Management Solution Revenue million Forecast, by Application 2019 & 2032
- Table 12: Global Voyage Management Solution Revenue million Forecast, by Type 2019 & 2032
- Table 13: Global Voyage Management Solution Revenue million Forecast, by Country 2019 & 2032
- Table 14: Brazil Voyage Management Solution Revenue (million) Forecast, by Application 2019 & 2032
- Table 15: Argentina Voyage Management Solution Revenue (million) Forecast, by Application 2019 & 2032
- Table 16: Rest of South America Voyage Management Solution Revenue (million) Forecast, by Application 2019 & 2032
- Table 17: Global Voyage Management Solution Revenue million Forecast, by Application 2019 & 2032
- Table 18: Global Voyage Management Solution Revenue million Forecast, by Type 2019 & 2032
- Table 19: Global Voyage Management Solution Revenue million Forecast, by Country 2019 & 2032
- Table 20: United Kingdom Voyage Management Solution Revenue (million) Forecast, by Application 2019 & 2032
- Table 21: Germany Voyage Management Solution Revenue (million) Forecast, by Application 2019 & 2032
- Table 22: France Voyage Management Solution Revenue (million) Forecast, by Application 2019 & 2032
- Table 23: Italy Voyage Management Solution Revenue (million) Forecast, by Application 2019 & 2032
- Table 24: Spain Voyage Management Solution Revenue (million) Forecast, by Application 2019 & 2032
- Table 25: Russia Voyage Management Solution Revenue (million) Forecast, by Application 2019 & 2032
- Table 26: Benelux Voyage Management Solution Revenue (million) Forecast, by Application 2019 & 2032
- Table 27: Nordics Voyage Management Solution Revenue (million) Forecast, by Application 2019 & 2032
- Table 28: Rest of Europe Voyage Management Solution Revenue (million) Forecast, by Application 2019 & 2032
- Table 29: Global Voyage Management Solution Revenue million Forecast, by Application 2019 & 2032
- Table 30: Global Voyage Management Solution Revenue million Forecast, by Type 2019 & 2032
- Table 31: Global Voyage Management Solution Revenue million Forecast, by Country 2019 & 2032
- Table 32: Turkey Voyage Management Solution Revenue (million) Forecast, by Application 2019 & 2032
- Table 33: Israel Voyage Management Solution Revenue (million) Forecast, by Application 2019 & 2032
- Table 34: GCC Voyage Management Solution Revenue (million) Forecast, by Application 2019 & 2032
- Table 35: North Africa Voyage Management Solution Revenue (million) Forecast, by Application 2019 & 2032
- Table 36: South Africa Voyage Management Solution Revenue (million) Forecast, by Application 2019 & 2032
- Table 37: Rest of Middle East & Africa Voyage Management Solution Revenue (million) Forecast, by Application 2019 & 2032
- Table 38: Global Voyage Management Solution Revenue million Forecast, by Application 2019 & 2032
- Table 39: Global Voyage Management Solution Revenue million Forecast, by Type 2019 & 2032
- Table 40: Global Voyage Management Solution Revenue million Forecast, by Country 2019 & 2032
- Table 41: China Voyage Management Solution Revenue (million) Forecast, by Application 2019 & 2032
- Table 42: India Voyage Management Solution Revenue (million) Forecast, by Application 2019 & 2032
- Table 43: Japan Voyage Management Solution Revenue (million) Forecast, by Application 2019 & 2032
- Table 44: South Korea Voyage Management Solution Revenue (million) Forecast, by Application 2019 & 2032
- Table 45: ASEAN Voyage Management Solution Revenue (million) Forecast, by Application 2019 & 2032
- Table 46: Oceania Voyage Management Solution Revenue (million) Forecast, by Application 2019 & 2032
- Table 47: Rest of Asia Pacific Voyage Management Solution Revenue (million) Forecast, by Application 2019 & 2032
Frequently Asked Questions
1. What is the projected Compound Annual Growth Rate (CAGR) of the Voyage Management Solution?
The projected CAGR is approximately 4.7%.
2. Which companies are prominent players in the Voyage Management Solution?
Key companies in the market include Wärtsilä, Furuno, NAVTOR, DNV, Kongsberg Maritime, ChartWorld, MarineTraffic, StormGeo, SevenCs, Transas Marine, i4 Insight, ShipNet, Orca AI, Dataloy Systems, NAPA, Raymarine.
3. What are the main segments of the Voyage Management Solution?
The market segments include Application, Type.
4. Can you provide details about the market size?
The market size is estimated to be USD 175 million as of 2022.
5. What are some drivers contributing to market growth?
N/A
6. What are the notable trends driving market growth?
N/A
7. Are there any restraints impacting market growth?
N/A
8. Can you provide examples of recent developments in the market?
N/A
9. What pricing options are available for accessing the report?
Pricing options include single-user, multi-user, and enterprise licenses priced at USD 2900.00, USD 4350.00, and USD 5800.00 respectively.
10. Is the market size provided in terms of value or volume?
The market size is provided in terms of value, measured in million.
11. Are there any specific market keywords associated with the report?
Yes, the market keyword associated with the report is "Voyage Management Solution," which aids in identifying and referencing the specific market segment covered.
12. How do I determine which pricing option suits my needs best?
The pricing options vary based on user requirements and access needs. Individual users may opt for single-user licenses, while businesses requiring broader access may choose multi-user or enterprise licenses for cost-effective access to the report.
13. Are there any additional resources or data provided in the Voyage Management Solution report?
While the report offers comprehensive insights, it's advisable to review the specific contents or supplementary materials provided to ascertain if additional resources or data are available.
14. How can I stay updated on further developments or reports in the Voyage Management Solution?
To stay informed about further developments, trends, and reports in the Voyage Management Solution, consider subscribing to industry newsletters, following relevant companies and organizations, or regularly checking reputable industry news sources and publications.
Methodology
Step 1 - Identification of Relevant Samples Size from Population Database


Step 2 - Approaches for Defining Global Market Size (Value, Volume* & Price*)

Note*: In applicable scenarios
Step 3 - Data Sources
Primary Research
- Web Analytics
- Survey Reports
- Research Institute
- Latest Research Reports
- Opinion Leaders
Secondary Research
- Annual Reports
- White Paper
- Latest Press Release
- Industry Association
- Paid Database
- Investor Presentations

Step 4 - Data Triangulation
Involves using different sources of information in order to increase the validity of a study
These sources are likely to be stakeholders in a program - participants, other researchers, program staff, other community members, and so on.
Then we put all data in single framework & apply various statistical tools to find out the dynamic on the market.
During the analysis stage, feedback from the stakeholder groups would be compared to determine areas of agreement as well as areas of divergence


