

Key Insights
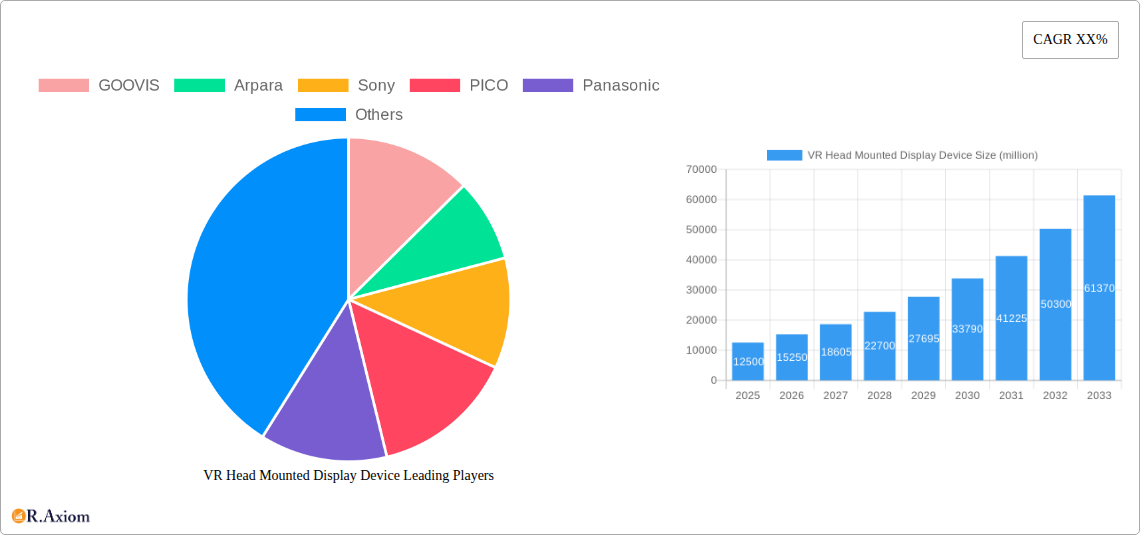
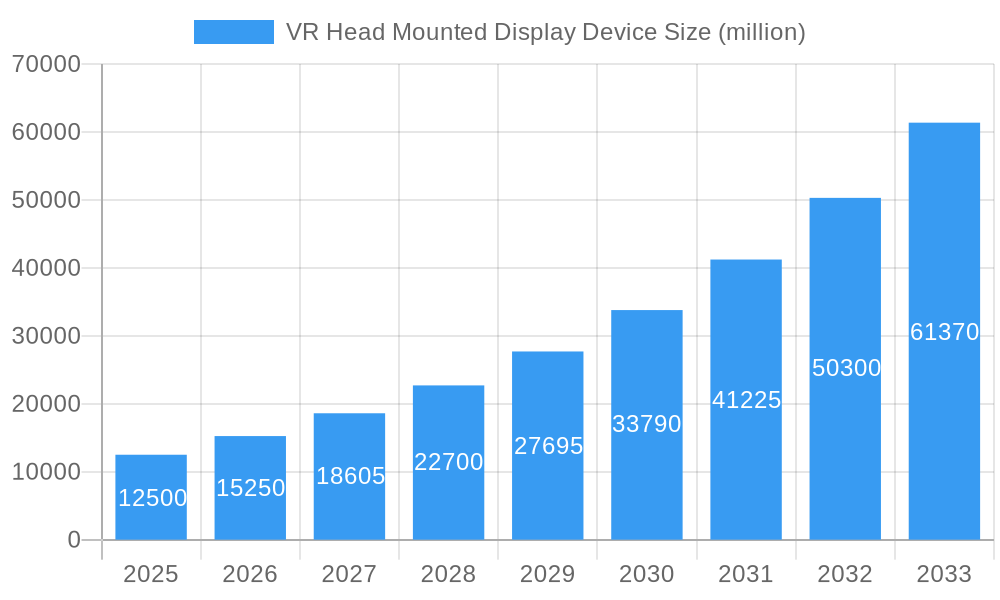
The Virtual Reality (VR) Head-Mounted Display (HMD) Device market is poised for significant expansion, projected to reach an estimated market size of approximately USD 12,500 million by 2025, with a robust Compound Annual Growth Rate (CAGR) of around 22% anticipated throughout the forecast period of 2025-2033. This dynamic growth is fueled by an increasing consumer appetite for immersive entertainment, particularly in gaming, and a burgeoning adoption of VR technology in professional sectors such as medical training and simulation. Advancements in display technology, wider field-of-view capabilities, and improved comfort and ergonomics are key drivers propelling this market forward. Furthermore, the integration of higher resolution displays and more intuitive interaction methods are enhancing the user experience, making VR HMDs more accessible and appealing to a broader audience. The market's trajectory is also influenced by the decreasing cost of components and increasing computational power, making sophisticated VR experiences more attainable for both individual consumers and businesses.
VR Head Mounted Display Device Market Size (In Billion)
Despite the promising outlook, the VR HMD market faces certain challenges that could temper its growth. The high cost of premium VR systems, although decreasing, remains a barrier for some potential adopters. Content availability, while expanding, still requires further diversification to cater to a wider range of interests beyond core gaming applications. Technical limitations such as motion sickness for sensitive individuals and the need for powerful processing hardware also present hurdles. However, ongoing research and development efforts are actively addressing these restraints. The emergence of standalone VR headsets, which offer untethered experiences and simplify setup, is a significant trend. The growing investment from major technology players and the development of the metaverse concept further underscore the long-term potential for VR HMDs to become a mainstream computing and entertainment platform, driving innovation across applications and types, including all-in-one and split-type machines.
VR Head Mounted Display Device Company Market Share
VR Head Mounted Display Device Market Concentration & Innovation
The VR Head Mounted Display (HMD) device market is characterized by a dynamic interplay of established giants and agile innovators. Market concentration is moderately high, with leading companies like Sony, Meta, and Apple demonstrating significant influence through substantial R&D investments and established distribution channels. Sony's PlayStation VR series and Meta's Quest line have captured substantial market share, projected to exceed over 50 million units sold annually by 2025. Apple's entry, while recent, is expected to reshape the premium segment, with initial projections suggesting a market entry value of over 10 million units in its first year. Emerging players like GOOVIS, Arpara, Eteamxr, and Cordex Intelligence are aggressively pursuing niche segments, focusing on specialized applications and advanced optics, contributing to a vibrant innovation landscape. Innovation drivers are primarily fueled by advancements in display technology (micro-OLEDs, higher resolutions), reduced form factors, improved processing power, and the development of sophisticated tracking systems. Regulatory frameworks, particularly concerning data privacy and content moderation within VR environments, are evolving and will play a crucial role in shaping market adoption. Product substitutes, while not directly competitive, include AR glasses and advanced mobile gaming solutions, influencing the perceived value proposition of VR HMDs. End-user trends indicate a growing demand for immersive gaming experiences and professional training simulations, with a projected increase in adoption rates by over 25% annually for these sectors. Mergers and acquisitions (M&A) activity is steadily increasing, with recent significant deals valuing over several hundred million dollars, indicating a consolidation trend as larger companies seek to acquire cutting-edge technologies and talent. For instance, the acquisition of a promising XR interface company by a major tech player was valued at over 500 million.
VR Head Mounted Display Device Industry Trends & Insights
The VR Head Mounted Display device industry is experiencing robust growth, propelled by a confluence of technological advancements, expanding application areas, and increasing consumer adoption. The market is projected to witness a Compound Annual Growth Rate (CAGR) of over 22% from 2025 to 2033, reaching an estimated market size of over 150 million units by the end of the forecast period. This expansion is underpinned by several key trends. Technological disruptions are at the forefront, with continuous improvements in display resolution, field of view, refresh rates, and tracking accuracy. The integration of eye-tracking, foveated rendering, and inside-out tracking is enhancing user immersion and reducing motion sickness, making VR more accessible and enjoyable for a wider audience. Furthermore, the miniaturization and weight reduction of HMDs, coupled with advancements in battery technology, are improving user comfort and portability.
Consumer preferences are shifting towards more accessible and standalone VR solutions, leading to the dominance of all-in-one machines. However, specialized split-type devices continue to hold a significant share in professional and enterprise markets where high-fidelity graphics and extensive processing power are paramount. The gaming segment remains a primary driver of adoption, with a growing library of immersive titles and increasing hardware capabilities. Beyond gaming, the adoption of VR in education, healthcare, and remote collaboration is accelerating. Medical applications, including surgical training, pain management, and therapy, are witnessing significant investment and development, with an estimated market penetration of over 15% in specialized medical fields by 2030. Similarly, the adoption of VR for architectural visualization, product design, and employee training is creating substantial demand in the enterprise sector.
Competitive dynamics are intensifying as established players like Meta, Sony, and Samsung invest heavily in R&D and expand their product portfolios. Emerging players, including Apple with its anticipated entry into the market, Arpara, and Eteamxr, are focusing on premium offerings and unique technological innovations to capture market share. Companies like Panasonic and GOOVIS are also contributing to the diversification of the market with their specialized HMD solutions. The growing ecosystem of VR content developers and platform providers is further fueling market growth by ensuring a steady stream of engaging experiences. The increasing affordability of VR HMDs, driven by economies of scale and technological maturation, is also a significant factor in expanding market penetration beyond early adopters.
Dominant Markets & Segments in VR Head Mounted Display Device
The VR Head Mounted Display (HMD) device market exhibits distinct regional dominance and segment leadership, driven by varying adoption rates, economic conditions, and strategic investments. North America currently leads the global market, accounting for over 35% of market share, primarily due to strong consumer demand for gaming and entertainment, coupled with significant enterprise adoption in sectors like manufacturing and healthcare. The United States, in particular, is a powerhouse, fueled by a robust tech ecosystem and a high disposable income.
Leading Region: North America, with the United States as the primary driver.
- Key Drivers: High consumer spending power, advanced technological infrastructure, early adoption of gaming and entertainment technologies, and significant R&D investments by leading tech companies.
- Economic Policies: Favorable venture capital funding and government initiatives supporting digital transformation indirectly benefit VR HMD adoption.
- Infrastructure: Widespread high-speed internet access and a strong digital content creation industry support the VR ecosystem.
Dominant Application Segment: Gaming
- Gaming constitutes the largest application segment, representing over 45% of the total market revenue. The increasing realism, social interactivity, and availability of AAA VR titles are key attractors. Major players like Sony with its PlayStation VR and Meta with its Quest line are heavily invested in this segment.
- Drivers: Advancements in VR-specific game development, increasing comfort and affordability of VR HMDs, and the growing popularity of esports and virtual social experiences.
Dominant Type: All-In-One Machine
- All-in-one VR HMDs, such as Meta's Quest series, dominate the market due to their standalone nature, ease of use, and competitive pricing. These devices eliminate the need for external PCs or consoles, making VR more accessible to a broader consumer base. Their market share is estimated to be over 60% of the total HMD shipments.
- Drivers: Portability, wireless connectivity, integrated processing power, and a growing library of optimized content, reducing setup complexity for end-users.
Emerging Application Segment: Medical
- The medical segment is experiencing rapid growth, driven by its potential in surgical training, patient rehabilitation, pain management, and mental health therapy. Companies like Virnect and Hidden Brains are developing specialized VR solutions for healthcare professionals and patients. While currently a smaller segment (estimated at over 10% of the market), its growth rate is projected to exceed 30% annually.
- Drivers: The demand for cost-effective and safe training environments, the increasing use of VR for non-pharmacological pain relief, and advancements in medical simulation technology.
Emerging Type: Split Type (Professional Use)
- While all-in-one machines cater to the mass market, split-type VR HMDs, which connect to high-performance PCs or workstations, remain crucial for professional applications requiring the highest fidelity graphics and complex simulations. Companies like Panasonic and Eteamxr are active in this segment, often targeting enterprise and research institutions.
- Drivers: Need for advanced graphical processing, high-resolution displays for detailed visualization, and integration with complex industrial software.
The market also sees significant traction in Asia-Pacific, particularly China, driven by government support for emerging technologies and a large consumer base. Samsung is a notable player in this region, contributing to the growth of mobile-based VR solutions.
VR Head Mounted Display Device Product Developments
Recent product developments in the VR Head Mounted Display (HMD) device market are centered on enhancing immersion, comfort, and functionality. Innovations include higher resolution displays with micro-OLED technology, wider fields of view, and improved refresh rates from companies like Sony and Apple, promising more photorealistic visuals. Miniaturization and weight reduction are key trends, with a focus on sleeker designs that improve user comfort for extended use, evident in the design philosophy of many new entrants. Eye-tracking and foveated rendering technologies are being integrated by players like Meta and GOOVIS to optimize performance and visual fidelity, allowing the headset to render only the area the user is directly looking at in high detail. Advancements in inside-out tracking systems from companies like PICO are further simplifying setup and increasing usability. These developments collectively aim to bridge the gap between virtual and physical realities, making VR HMDs more appealing for a wider range of applications, from gaming and entertainment to professional training and medical interventions.
Report Scope & Segmentation Analysis
This report provides a comprehensive analysis of the VR Head Mounted Display (HMD) device market, covering its market size, growth projections, and competitive landscape across key segments. The segmentation is based on critical factors influencing market dynamics and adoption rates.
Application Segmentation:
- Game: This segment is expected to dominate the market, driven by the continuous development of immersive virtual reality games and increasing consumer interest in interactive entertainment. Projected market size by 2033 is over 80 million units.
- Video: Encompassing VR movies, 360-degree video content, and virtual tourism, this segment offers significant growth potential as content libraries expand and streaming capabilities improve. Projected market size by 2033 is over 30 million units.
- Medical: This rapidly expanding segment includes applications such as surgical training, patient rehabilitation, pain management, and mental health therapy. Its growth is fueled by increasing adoption in healthcare institutions and a growing understanding of VR's therapeutic benefits. Projected market size by 2033 is over 20 million units.
- Other: This category includes enterprise applications like architectural visualization, product design, employee training, remote collaboration, and education. This segment is poised for substantial growth due to increasing enterprise investment in immersive technologies. Projected market size by 2033 is over 20 million units.
Type Segmentation:
- All-In-One Machine: These standalone VR devices, requiring no external computing power, are expected to lead the market due to their user-friendliness, portability, and increasing affordability, catering to the mass consumer market. Projected market size by 2033 is over 110 million units.
- Split Type: These devices, which connect to external PCs or consoles, are crucial for high-fidelity gaming and demanding professional applications, offering superior processing power and graphics. Projected market size by 2033 is over 40 million units.
The analysis delves into the growth trajectories, market shares, and competitive strategies within each of these segments, providing actionable insights for stakeholders.
Key Drivers of VR Head Mounted Display Device Growth
The growth of the VR Head Mounted Display (HMD) device market is propelled by a multifaceted set of drivers. Technological advancements are paramount, with continuous improvements in display resolution, refresh rates, and field of view, leading to more realistic and immersive experiences. The development of more comfortable, lightweight, and affordable HMDs is crucial for wider consumer adoption. The expansion of VR content libraries across gaming, entertainment, and professional applications is a significant catalyst, creating greater demand for hardware. Increasing investment by major technology companies like Meta, Sony, and Apple, along with emerging players like Arpara and Eteamxr, fuels innovation and market competition. Furthermore, the growing recognition of VR's utility in sectors beyond gaming, such as education, healthcare (e.g., surgical training, therapy), and enterprise (e.g., remote collaboration, design visualization), is opening up new markets and driving demand. Economic factors, including the increasing disposable income in key regions and the maturation of manufacturing processes leading to more competitive pricing, also contribute to market expansion.
Challenges in the VR Head Mounted Display Device Sector
Despite its promising growth, the VR Head Mounted Display (HMD) device sector faces several significant challenges. High hardware costs remain a barrier for widespread consumer adoption, particularly for high-end devices that require powerful PCs. Motion sickness, while improving with technological advancements, still deters a portion of potential users. The fragmentation of the VR ecosystem, with varying platforms and content compatibility issues, can lead to consumer confusion and limit content accessibility. Developing compelling and diverse VR content that justifies the hardware investment is an ongoing challenge for developers. Regulatory hurdles, particularly concerning data privacy and the potential for addictive use, are still being defined and could impact market growth. Supply chain disruptions and the cost of raw materials can also affect production volumes and pricing. The competitive pressure from other immersive technologies, such as advanced augmented reality (AR) glasses, also presents a challenge to market share.
Emerging Opportunities in VR Head Mounted Display Device
The VR Head Mounted Display (HMD) device market is brimming with emerging opportunities. The continued growth of the metaverse concept presents a significant long-term opportunity for VR HMDs as the primary gateway to virtual worlds. Advancements in haptic feedback technology offer the potential to create truly multi-sensory VR experiences, enhancing realism and engagement. The expansion of enterprise applications, including virtual training simulations for industries like aerospace, manufacturing, and healthcare, represents a substantial untapped market. The development of smaller, more discreet, and stylish VR devices that blur the lines with everyday wearables could broaden consumer appeal. Furthermore, the integration of AI within VR environments can create more dynamic and personalized user experiences, driving engagement and utility. Exploring new markets in emerging economies and tailoring offerings to local preferences can unlock significant growth potential.
Leading Players in the VR Head Mounted Display Device Market
- GOOVIS
- Arpara
- Sony
- PICO
- Panasonic
- Apple
- Eteamxr
- Meta
- Cordex Intelligence
- Hidden Brains
- Virnect
- Samsung
Key Developments in VR Head Mounted Display Device Industry
- 2023/09: Apple announces its Vision Pro headset, marking a significant entry into the spatial computing market with a focus on high-fidelity mixed reality experiences.
- 2023/08: Meta launches the Quest 3, an affordable and capable all-in-one headset with enhanced mixed reality capabilities and a focus on gaming and social experiences.
- 2023/07: PICO expands its VR headset offerings with new models, emphasizing a competitive price point and strong performance for gaming and entertainment.
- 2023/06: GOOVIS introduces advanced micro-OLED display technology in its latest HMD prototypes, promising significantly higher resolution and color accuracy.
- 2023/05: Virnect showcases its industrial VR solutions for remote assistance and training, highlighting increasing enterprise adoption.
- 2023/04: Sony PlayStation VR2 continues to see strong sales, driven by exclusive gaming titles and its integration with the PlayStation 5 console.
- 2023/03: Arpara announces its ultra-lightweight VR headset, targeting the premium consumer segment with a focus on advanced optics and comfort.
- 2023/02: Samsung showcases potential advancements in flexible display technology that could lead to more comfortable and adaptable VR HMD designs.
- 2023/01: Cordex Intelligence patents new eye-tracking technology for VR, aimed at improving user immersion and reducing computational load.
- 2022/12: Hidden Brains expands its VR development services for healthcare, focusing on therapeutic and diagnostic applications.
- 2022/11: Panasonic continues research into advanced optical solutions for VR, aiming to improve clarity and reduce distortion.
- 2022/10: Eteamxr unveils a high-performance enterprise VR headset designed for complex simulations and professional visualization.
Strategic Outlook for VR Head Mounted Display Device Market
The strategic outlook for the VR Head Mounted Display (HMD) device market is exceptionally positive, driven by a clear trajectory towards greater immersion, accessibility, and practical utility. The continued refinement of display technologies, coupled with innovations in form factor and tracking, will make VR HMDs more appealing to a broader consumer base. The expansion of the metaverse and the increasing integration of VR into enterprise workflows for training, design, and collaboration are significant growth catalysts. Strategic investments in content development, ecosystem building, and strategic partnerships will be crucial for players to capture market share. Emerging opportunities in healthcare and education, where VR offers unique benefits, present substantial growth avenues. As hardware costs decrease and user experiences improve, the market is poised for exponential growth, transitioning from a niche entertainment device to an indispensable tool across various industries.
VR Head Mounted Display Device Segmentation
-
1. Application
- 1.1. Game
- 1.2. Video
- 1.3. Medical
- 1.4. Other
-
2. Types
- 2.1. All-In-One Machine
- 2.2. Split Type
VR Head Mounted Display Device Segmentation By Geography
-
1. North America
- 1.1. United States
- 1.2. Canada
- 1.3. Mexico
-
2. South America
- 2.1. Brazil
- 2.2. Argentina
- 2.3. Rest of South America
-
3. Europe
- 3.1. United Kingdom
- 3.2. Germany
- 3.3. France
- 3.4. Italy
- 3.5. Spain
- 3.6. Russia
- 3.7. Benelux
- 3.8. Nordics
- 3.9. Rest of Europe
-
4. Middle East & Africa
- 4.1. Turkey
- 4.2. Israel
- 4.3. GCC
- 4.4. North Africa
- 4.5. South Africa
- 4.6. Rest of Middle East & Africa
-
5. Asia Pacific
- 5.1. China
- 5.2. India
- 5.3. Japan
- 5.4. South Korea
- 5.5. ASEAN
- 5.6. Oceania
- 5.7. Rest of Asia Pacific
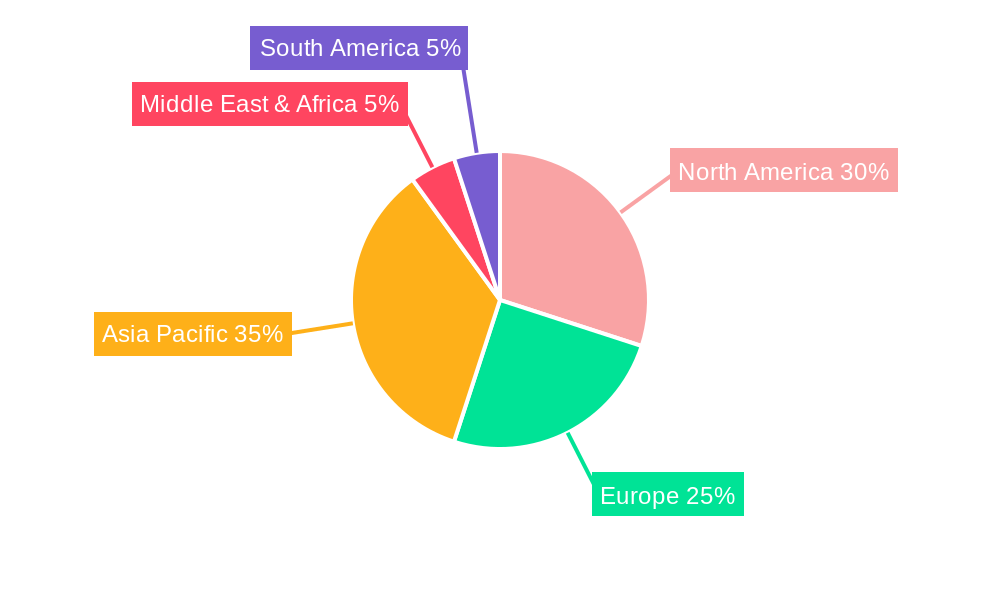
VR Head Mounted Display Device Regional Market Share
Geographic Coverage of VR Head Mounted Display Device
VR Head Mounted Display Device REPORT HIGHLIGHTS
| Aspects | Details |
|---|---|
| Study Period | 2020-2034 |
| Base Year | 2025 |
| Estimated Year | 2026 |
| Forecast Period | 2026-2034 |
| Historical Period | 2020-2025 |
| Growth Rate | CAGR of 20% from 2020-2034 |
| Segmentation |
|
Table of Contents
- 1. Introduction
- 1.1. Research Scope
- 1.2. Market Segmentation
- 1.3. Research Methodology
- 1.4. Definitions and Assumptions
- 2. Executive Summary
- 2.1. Introduction
- 3. Market Dynamics
- 3.1. Introduction
- 3.2. Market Drivers
- 3.3. Market Restrains
- 3.4. Market Trends
- 4. Market Factor Analysis
- 4.1. Porters Five Forces
- 4.2. Supply/Value Chain
- 4.3. PESTEL analysis
- 4.4. Market Entropy
- 4.5. Patent/Trademark Analysis
- 5. Global VR Head Mounted Display Device Analysis, Insights and Forecast, 2020-2032
- 5.1. Market Analysis, Insights and Forecast - by Application
- 5.1.1. Game
- 5.1.2. Video
- 5.1.3. Medical
- 5.1.4. Other
- 5.2. Market Analysis, Insights and Forecast - by Types
- 5.2.1. All-In-One Machine
- 5.2.2. Split Type
- 5.3. Market Analysis, Insights and Forecast - by Region
- 5.3.1. North America
- 5.3.2. South America
- 5.3.3. Europe
- 5.3.4. Middle East & Africa
- 5.3.5. Asia Pacific
- 5.1. Market Analysis, Insights and Forecast - by Application
- 6. North America VR Head Mounted Display Device Analysis, Insights and Forecast, 2020-2032
- 6.1. Market Analysis, Insights and Forecast - by Application
- 6.1.1. Game
- 6.1.2. Video
- 6.1.3. Medical
- 6.1.4. Other
- 6.2. Market Analysis, Insights and Forecast - by Types
- 6.2.1. All-In-One Machine
- 6.2.2. Split Type
- 6.1. Market Analysis, Insights and Forecast - by Application
- 7. South America VR Head Mounted Display Device Analysis, Insights and Forecast, 2020-2032
- 7.1. Market Analysis, Insights and Forecast - by Application
- 7.1.1. Game
- 7.1.2. Video
- 7.1.3. Medical
- 7.1.4. Other
- 7.2. Market Analysis, Insights and Forecast - by Types
- 7.2.1. All-In-One Machine
- 7.2.2. Split Type
- 7.1. Market Analysis, Insights and Forecast - by Application
- 8. Europe VR Head Mounted Display Device Analysis, Insights and Forecast, 2020-2032
- 8.1. Market Analysis, Insights and Forecast - by Application
- 8.1.1. Game
- 8.1.2. Video
- 8.1.3. Medical
- 8.1.4. Other
- 8.2. Market Analysis, Insights and Forecast - by Types
- 8.2.1. All-In-One Machine
- 8.2.2. Split Type
- 8.1. Market Analysis, Insights and Forecast - by Application
- 9. Middle East & Africa VR Head Mounted Display Device Analysis, Insights and Forecast, 2020-2032
- 9.1. Market Analysis, Insights and Forecast - by Application
- 9.1.1. Game
- 9.1.2. Video
- 9.1.3. Medical
- 9.1.4. Other
- 9.2. Market Analysis, Insights and Forecast - by Types
- 9.2.1. All-In-One Machine
- 9.2.2. Split Type
- 9.1. Market Analysis, Insights and Forecast - by Application
- 10. Asia Pacific VR Head Mounted Display Device Analysis, Insights and Forecast, 2020-2032
- 10.1. Market Analysis, Insights and Forecast - by Application
- 10.1.1. Game
- 10.1.2. Video
- 10.1.3. Medical
- 10.1.4. Other
- 10.2. Market Analysis, Insights and Forecast - by Types
- 10.2.1. All-In-One Machine
- 10.2.2. Split Type
- 10.1. Market Analysis, Insights and Forecast - by Application
- 11. Competitive Analysis
- 11.1. Global Market Share Analysis 2025
- 11.2. Company Profiles
- 11.2.1 GOOVIS
- 11.2.1.1. Overview
- 11.2.1.2. Products
- 11.2.1.3. SWOT Analysis
- 11.2.1.4. Recent Developments
- 11.2.1.5. Financials (Based on Availability)
- 11.2.2 Arpara
- 11.2.2.1. Overview
- 11.2.2.2. Products
- 11.2.2.3. SWOT Analysis
- 11.2.2.4. Recent Developments
- 11.2.2.5. Financials (Based on Availability)
- 11.2.3 Sony
- 11.2.3.1. Overview
- 11.2.3.2. Products
- 11.2.3.3. SWOT Analysis
- 11.2.3.4. Recent Developments
- 11.2.3.5. Financials (Based on Availability)
- 11.2.4 PICO
- 11.2.4.1. Overview
- 11.2.4.2. Products
- 11.2.4.3. SWOT Analysis
- 11.2.4.4. Recent Developments
- 11.2.4.5. Financials (Based on Availability)
- 11.2.5 Panasonic
- 11.2.5.1. Overview
- 11.2.5.2. Products
- 11.2.5.3. SWOT Analysis
- 11.2.5.4. Recent Developments
- 11.2.5.5. Financials (Based on Availability)
- 11.2.6 Apple
- 11.2.6.1. Overview
- 11.2.6.2. Products
- 11.2.6.3. SWOT Analysis
- 11.2.6.4. Recent Developments
- 11.2.6.5. Financials (Based on Availability)
- 11.2.7 Eteamxr
- 11.2.7.1. Overview
- 11.2.7.2. Products
- 11.2.7.3. SWOT Analysis
- 11.2.7.4. Recent Developments
- 11.2.7.5. Financials (Based on Availability)
- 11.2.8 Meta
- 11.2.8.1. Overview
- 11.2.8.2. Products
- 11.2.8.3. SWOT Analysis
- 11.2.8.4. Recent Developments
- 11.2.8.5. Financials (Based on Availability)
- 11.2.9 Cordex Intelligence
- 11.2.9.1. Overview
- 11.2.9.2. Products
- 11.2.9.3. SWOT Analysis
- 11.2.9.4. Recent Developments
- 11.2.9.5. Financials (Based on Availability)
- 11.2.10 Hidden Brains
- 11.2.10.1. Overview
- 11.2.10.2. Products
- 11.2.10.3. SWOT Analysis
- 11.2.10.4. Recent Developments
- 11.2.10.5. Financials (Based on Availability)
- 11.2.11 Virnect
- 11.2.11.1. Overview
- 11.2.11.2. Products
- 11.2.11.3. SWOT Analysis
- 11.2.11.4. Recent Developments
- 11.2.11.5. Financials (Based on Availability)
- 11.2.12 Samsung
- 11.2.12.1. Overview
- 11.2.12.2. Products
- 11.2.12.3. SWOT Analysis
- 11.2.12.4. Recent Developments
- 11.2.12.5. Financials (Based on Availability)
- 11.2.1 GOOVIS
List of Figures
- Figure 1: Global VR Head Mounted Display Device Revenue Breakdown (undefined, %) by Region 2025 & 2033
- Figure 2: Global VR Head Mounted Display Device Volume Breakdown (K, %) by Region 2025 & 2033
- Figure 3: North America VR Head Mounted Display Device Revenue (undefined), by Application 2025 & 2033
- Figure 4: North America VR Head Mounted Display Device Volume (K), by Application 2025 & 2033
- Figure 5: North America VR Head Mounted Display Device Revenue Share (%), by Application 2025 & 2033
- Figure 6: North America VR Head Mounted Display Device Volume Share (%), by Application 2025 & 2033
- Figure 7: North America VR Head Mounted Display Device Revenue (undefined), by Types 2025 & 2033
- Figure 8: North America VR Head Mounted Display Device Volume (K), by Types 2025 & 2033
- Figure 9: North America VR Head Mounted Display Device Revenue Share (%), by Types 2025 & 2033
- Figure 10: North America VR Head Mounted Display Device Volume Share (%), by Types 2025 & 2033
- Figure 11: North America VR Head Mounted Display Device Revenue (undefined), by Country 2025 & 2033
- Figure 12: North America VR Head Mounted Display Device Volume (K), by Country 2025 & 2033
- Figure 13: North America VR Head Mounted Display Device Revenue Share (%), by Country 2025 & 2033
- Figure 14: North America VR Head Mounted Display Device Volume Share (%), by Country 2025 & 2033
- Figure 15: South America VR Head Mounted Display Device Revenue (undefined), by Application 2025 & 2033
- Figure 16: South America VR Head Mounted Display Device Volume (K), by Application 2025 & 2033
- Figure 17: South America VR Head Mounted Display Device Revenue Share (%), by Application 2025 & 2033
- Figure 18: South America VR Head Mounted Display Device Volume Share (%), by Application 2025 & 2033
- Figure 19: South America VR Head Mounted Display Device Revenue (undefined), by Types 2025 & 2033
- Figure 20: South America VR Head Mounted Display Device Volume (K), by Types 2025 & 2033
- Figure 21: South America VR Head Mounted Display Device Revenue Share (%), by Types 2025 & 2033
- Figure 22: South America VR Head Mounted Display Device Volume Share (%), by Types 2025 & 2033
- Figure 23: South America VR Head Mounted Display Device Revenue (undefined), by Country 2025 & 2033
- Figure 24: South America VR Head Mounted Display Device Volume (K), by Country 2025 & 2033
- Figure 25: South America VR Head Mounted Display Device Revenue Share (%), by Country 2025 & 2033
- Figure 26: South America VR Head Mounted Display Device Volume Share (%), by Country 2025 & 2033
- Figure 27: Europe VR Head Mounted Display Device Revenue (undefined), by Application 2025 & 2033
- Figure 28: Europe VR Head Mounted Display Device Volume (K), by Application 2025 & 2033
- Figure 29: Europe VR Head Mounted Display Device Revenue Share (%), by Application 2025 & 2033
- Figure 30: Europe VR Head Mounted Display Device Volume Share (%), by Application 2025 & 2033
- Figure 31: Europe VR Head Mounted Display Device Revenue (undefined), by Types 2025 & 2033
- Figure 32: Europe VR Head Mounted Display Device Volume (K), by Types 2025 & 2033
- Figure 33: Europe VR Head Mounted Display Device Revenue Share (%), by Types 2025 & 2033
- Figure 34: Europe VR Head Mounted Display Device Volume Share (%), by Types 2025 & 2033
- Figure 35: Europe VR Head Mounted Display Device Revenue (undefined), by Country 2025 & 2033
- Figure 36: Europe VR Head Mounted Display Device Volume (K), by Country 2025 & 2033
- Figure 37: Europe VR Head Mounted Display Device Revenue Share (%), by Country 2025 & 2033
- Figure 38: Europe VR Head Mounted Display Device Volume Share (%), by Country 2025 & 2033
- Figure 39: Middle East & Africa VR Head Mounted Display Device Revenue (undefined), by Application 2025 & 2033
- Figure 40: Middle East & Africa VR Head Mounted Display Device Volume (K), by Application 2025 & 2033
- Figure 41: Middle East & Africa VR Head Mounted Display Device Revenue Share (%), by Application 2025 & 2033
- Figure 42: Middle East & Africa VR Head Mounted Display Device Volume Share (%), by Application 2025 & 2033
- Figure 43: Middle East & Africa VR Head Mounted Display Device Revenue (undefined), by Types 2025 & 2033
- Figure 44: Middle East & Africa VR Head Mounted Display Device Volume (K), by Types 2025 & 2033
- Figure 45: Middle East & Africa VR Head Mounted Display Device Revenue Share (%), by Types 2025 & 2033
- Figure 46: Middle East & Africa VR Head Mounted Display Device Volume Share (%), by Types 2025 & 2033
- Figure 47: Middle East & Africa VR Head Mounted Display Device Revenue (undefined), by Country 2025 & 2033
- Figure 48: Middle East & Africa VR Head Mounted Display Device Volume (K), by Country 2025 & 2033
- Figure 49: Middle East & Africa VR Head Mounted Display Device Revenue Share (%), by Country 2025 & 2033
- Figure 50: Middle East & Africa VR Head Mounted Display Device Volume Share (%), by Country 2025 & 2033
- Figure 51: Asia Pacific VR Head Mounted Display Device Revenue (undefined), by Application 2025 & 2033
- Figure 52: Asia Pacific VR Head Mounted Display Device Volume (K), by Application 2025 & 2033
- Figure 53: Asia Pacific VR Head Mounted Display Device Revenue Share (%), by Application 2025 & 2033
- Figure 54: Asia Pacific VR Head Mounted Display Device Volume Share (%), by Application 2025 & 2033
- Figure 55: Asia Pacific VR Head Mounted Display Device Revenue (undefined), by Types 2025 & 2033
- Figure 56: Asia Pacific VR Head Mounted Display Device Volume (K), by Types 2025 & 2033
- Figure 57: Asia Pacific VR Head Mounted Display Device Revenue Share (%), by Types 2025 & 2033
- Figure 58: Asia Pacific VR Head Mounted Display Device Volume Share (%), by Types 2025 & 2033
- Figure 59: Asia Pacific VR Head Mounted Display Device Revenue (undefined), by Country 2025 & 2033
- Figure 60: Asia Pacific VR Head Mounted Display Device Volume (K), by Country 2025 & 2033
- Figure 61: Asia Pacific VR Head Mounted Display Device Revenue Share (%), by Country 2025 & 2033
- Figure 62: Asia Pacific VR Head Mounted Display Device Volume Share (%), by Country 2025 & 2033
List of Tables
- Table 1: Global VR Head Mounted Display Device Revenue undefined Forecast, by Application 2020 & 2033
- Table 2: Global VR Head Mounted Display Device Volume K Forecast, by Application 2020 & 2033
- Table 3: Global VR Head Mounted Display Device Revenue undefined Forecast, by Types 2020 & 2033
- Table 4: Global VR Head Mounted Display Device Volume K Forecast, by Types 2020 & 2033
- Table 5: Global VR Head Mounted Display Device Revenue undefined Forecast, by Region 2020 & 2033
- Table 6: Global VR Head Mounted Display Device Volume K Forecast, by Region 2020 & 2033
- Table 7: Global VR Head Mounted Display Device Revenue undefined Forecast, by Application 2020 & 2033
- Table 8: Global VR Head Mounted Display Device Volume K Forecast, by Application 2020 & 2033
- Table 9: Global VR Head Mounted Display Device Revenue undefined Forecast, by Types 2020 & 2033
- Table 10: Global VR Head Mounted Display Device Volume K Forecast, by Types 2020 & 2033
- Table 11: Global VR Head Mounted Display Device Revenue undefined Forecast, by Country 2020 & 2033
- Table 12: Global VR Head Mounted Display Device Volume K Forecast, by Country 2020 & 2033
- Table 13: United States VR Head Mounted Display Device Revenue (undefined) Forecast, by Application 2020 & 2033
- Table 14: United States VR Head Mounted Display Device Volume (K) Forecast, by Application 2020 & 2033
- Table 15: Canada VR Head Mounted Display Device Revenue (undefined) Forecast, by Application 2020 & 2033
- Table 16: Canada VR Head Mounted Display Device Volume (K) Forecast, by Application 2020 & 2033
- Table 17: Mexico VR Head Mounted Display Device Revenue (undefined) Forecast, by Application 2020 & 2033
- Table 18: Mexico VR Head Mounted Display Device Volume (K) Forecast, by Application 2020 & 2033
- Table 19: Global VR Head Mounted Display Device Revenue undefined Forecast, by Application 2020 & 2033
- Table 20: Global VR Head Mounted Display Device Volume K Forecast, by Application 2020 & 2033
- Table 21: Global VR Head Mounted Display Device Revenue undefined Forecast, by Types 2020 & 2033
- Table 22: Global VR Head Mounted Display Device Volume K Forecast, by Types 2020 & 2033
- Table 23: Global VR Head Mounted Display Device Revenue undefined Forecast, by Country 2020 & 2033
- Table 24: Global VR Head Mounted Display Device Volume K Forecast, by Country 2020 & 2033
- Table 25: Brazil VR Head Mounted Display Device Revenue (undefined) Forecast, by Application 2020 & 2033
- Table 26: Brazil VR Head Mounted Display Device Volume (K) Forecast, by Application 2020 & 2033
- Table 27: Argentina VR Head Mounted Display Device Revenue (undefined) Forecast, by Application 2020 & 2033
- Table 28: Argentina VR Head Mounted Display Device Volume (K) Forecast, by Application 2020 & 2033
- Table 29: Rest of South America VR Head Mounted Display Device Revenue (undefined) Forecast, by Application 2020 & 2033
- Table 30: Rest of South America VR Head Mounted Display Device Volume (K) Forecast, by Application 2020 & 2033
- Table 31: Global VR Head Mounted Display Device Revenue undefined Forecast, by Application 2020 & 2033
- Table 32: Global VR Head Mounted Display Device Volume K Forecast, by Application 2020 & 2033
- Table 33: Global VR Head Mounted Display Device Revenue undefined Forecast, by Types 2020 & 2033
- Table 34: Global VR Head Mounted Display Device Volume K Forecast, by Types 2020 & 2033
- Table 35: Global VR Head Mounted Display Device Revenue undefined Forecast, by Country 2020 & 2033
- Table 36: Global VR Head Mounted Display Device Volume K Forecast, by Country 2020 & 2033
- Table 37: United Kingdom VR Head Mounted Display Device Revenue (undefined) Forecast, by Application 2020 & 2033
- Table 38: United Kingdom VR Head Mounted Display Device Volume (K) Forecast, by Application 2020 & 2033
- Table 39: Germany VR Head Mounted Display Device Revenue (undefined) Forecast, by Application 2020 & 2033
- Table 40: Germany VR Head Mounted Display Device Volume (K) Forecast, by Application 2020 & 2033
- Table 41: France VR Head Mounted Display Device Revenue (undefined) Forecast, by Application 2020 & 2033
- Table 42: France VR Head Mounted Display Device Volume (K) Forecast, by Application 2020 & 2033
- Table 43: Italy VR Head Mounted Display Device Revenue (undefined) Forecast, by Application 2020 & 2033
- Table 44: Italy VR Head Mounted Display Device Volume (K) Forecast, by Application 2020 & 2033
- Table 45: Spain VR Head Mounted Display Device Revenue (undefined) Forecast, by Application 2020 & 2033
- Table 46: Spain VR Head Mounted Display Device Volume (K) Forecast, by Application 2020 & 2033
- Table 47: Russia VR Head Mounted Display Device Revenue (undefined) Forecast, by Application 2020 & 2033
- Table 48: Russia VR Head Mounted Display Device Volume (K) Forecast, by Application 2020 & 2033
- Table 49: Benelux VR Head Mounted Display Device Revenue (undefined) Forecast, by Application 2020 & 2033
- Table 50: Benelux VR Head Mounted Display Device Volume (K) Forecast, by Application 2020 & 2033
- Table 51: Nordics VR Head Mounted Display Device Revenue (undefined) Forecast, by Application 2020 & 2033
- Table 52: Nordics VR Head Mounted Display Device Volume (K) Forecast, by Application 2020 & 2033
- Table 53: Rest of Europe VR Head Mounted Display Device Revenue (undefined) Forecast, by Application 2020 & 2033
- Table 54: Rest of Europe VR Head Mounted Display Device Volume (K) Forecast, by Application 2020 & 2033
- Table 55: Global VR Head Mounted Display Device Revenue undefined Forecast, by Application 2020 & 2033
- Table 56: Global VR Head Mounted Display Device Volume K Forecast, by Application 2020 & 2033
- Table 57: Global VR Head Mounted Display Device Revenue undefined Forecast, by Types 2020 & 2033
- Table 58: Global VR Head Mounted Display Device Volume K Forecast, by Types 2020 & 2033
- Table 59: Global VR Head Mounted Display Device Revenue undefined Forecast, by Country 2020 & 2033
- Table 60: Global VR Head Mounted Display Device Volume K Forecast, by Country 2020 & 2033
- Table 61: Turkey VR Head Mounted Display Device Revenue (undefined) Forecast, by Application 2020 & 2033
- Table 62: Turkey VR Head Mounted Display Device Volume (K) Forecast, by Application 2020 & 2033
- Table 63: Israel VR Head Mounted Display Device Revenue (undefined) Forecast, by Application 2020 & 2033
- Table 64: Israel VR Head Mounted Display Device Volume (K) Forecast, by Application 2020 & 2033
- Table 65: GCC VR Head Mounted Display Device Revenue (undefined) Forecast, by Application 2020 & 2033
- Table 66: GCC VR Head Mounted Display Device Volume (K) Forecast, by Application 2020 & 2033
- Table 67: North Africa VR Head Mounted Display Device Revenue (undefined) Forecast, by Application 2020 & 2033
- Table 68: North Africa VR Head Mounted Display Device Volume (K) Forecast, by Application 2020 & 2033
- Table 69: South Africa VR Head Mounted Display Device Revenue (undefined) Forecast, by Application 2020 & 2033
- Table 70: South Africa VR Head Mounted Display Device Volume (K) Forecast, by Application 2020 & 2033
- Table 71: Rest of Middle East & Africa VR Head Mounted Display Device Revenue (undefined) Forecast, by Application 2020 & 2033
- Table 72: Rest of Middle East & Africa VR Head Mounted Display Device Volume (K) Forecast, by Application 2020 & 2033
- Table 73: Global VR Head Mounted Display Device Revenue undefined Forecast, by Application 2020 & 2033
- Table 74: Global VR Head Mounted Display Device Volume K Forecast, by Application 2020 & 2033
- Table 75: Global VR Head Mounted Display Device Revenue undefined Forecast, by Types 2020 & 2033
- Table 76: Global VR Head Mounted Display Device Volume K Forecast, by Types 2020 & 2033
- Table 77: Global VR Head Mounted Display Device Revenue undefined Forecast, by Country 2020 & 2033
- Table 78: Global VR Head Mounted Display Device Volume K Forecast, by Country 2020 & 2033
- Table 79: China VR Head Mounted Display Device Revenue (undefined) Forecast, by Application 2020 & 2033
- Table 80: China VR Head Mounted Display Device Volume (K) Forecast, by Application 2020 & 2033
- Table 81: India VR Head Mounted Display Device Revenue (undefined) Forecast, by Application 2020 & 2033
- Table 82: India VR Head Mounted Display Device Volume (K) Forecast, by Application 2020 & 2033
- Table 83: Japan VR Head Mounted Display Device Revenue (undefined) Forecast, by Application 2020 & 2033
- Table 84: Japan VR Head Mounted Display Device Volume (K) Forecast, by Application 2020 & 2033
- Table 85: South Korea VR Head Mounted Display Device Revenue (undefined) Forecast, by Application 2020 & 2033
- Table 86: South Korea VR Head Mounted Display Device Volume (K) Forecast, by Application 2020 & 2033
- Table 87: ASEAN VR Head Mounted Display Device Revenue (undefined) Forecast, by Application 2020 & 2033
- Table 88: ASEAN VR Head Mounted Display Device Volume (K) Forecast, by Application 2020 & 2033
- Table 89: Oceania VR Head Mounted Display Device Revenue (undefined) Forecast, by Application 2020 & 2033
- Table 90: Oceania VR Head Mounted Display Device Volume (K) Forecast, by Application 2020 & 2033
- Table 91: Rest of Asia Pacific VR Head Mounted Display Device Revenue (undefined) Forecast, by Application 2020 & 2033
- Table 92: Rest of Asia Pacific VR Head Mounted Display Device Volume (K) Forecast, by Application 2020 & 2033
Frequently Asked Questions
1. What is the projected Compound Annual Growth Rate (CAGR) of the VR Head Mounted Display Device?
The projected CAGR is approximately 20%.
2. Which companies are prominent players in the VR Head Mounted Display Device?
Key companies in the market include GOOVIS, Arpara, Sony, PICO, Panasonic, Apple, Eteamxr, Meta, Cordex Intelligence, Hidden Brains, Virnect, Samsung.
3. What are the main segments of the VR Head Mounted Display Device?
The market segments include Application, Types.
4. Can you provide details about the market size?
The market size is estimated to be USD XXX N/A as of 2022.
5. What are some drivers contributing to market growth?
N/A
6. What are the notable trends driving market growth?
N/A
7. Are there any restraints impacting market growth?
N/A
8. Can you provide examples of recent developments in the market?
N/A
9. What pricing options are available for accessing the report?
Pricing options include single-user, multi-user, and enterprise licenses priced at USD 3950.00, USD 5925.00, and USD 7900.00 respectively.
10. Is the market size provided in terms of value or volume?
The market size is provided in terms of value, measured in N/A and volume, measured in K.
11. Are there any specific market keywords associated with the report?
Yes, the market keyword associated with the report is "VR Head Mounted Display Device," which aids in identifying and referencing the specific market segment covered.
12. How do I determine which pricing option suits my needs best?
The pricing options vary based on user requirements and access needs. Individual users may opt for single-user licenses, while businesses requiring broader access may choose multi-user or enterprise licenses for cost-effective access to the report.
13. Are there any additional resources or data provided in the VR Head Mounted Display Device report?
While the report offers comprehensive insights, it's advisable to review the specific contents or supplementary materials provided to ascertain if additional resources or data are available.
14. How can I stay updated on further developments or reports in the VR Head Mounted Display Device?
To stay informed about further developments, trends, and reports in the VR Head Mounted Display Device, consider subscribing to industry newsletters, following relevant companies and organizations, or regularly checking reputable industry news sources and publications.
Methodology
Step 1 - Identification of Relevant Samples Size from Population Database


Step 2 - Approaches for Defining Global Market Size (Value, Volume* & Price*)

Note*: In applicable scenarios
Step 3 - Data Sources
Primary Research
- Web Analytics
- Survey Reports
- Research Institute
- Latest Research Reports
- Opinion Leaders
Secondary Research
- Annual Reports
- White Paper
- Latest Press Release
- Industry Association
- Paid Database
- Investor Presentations

Step 4 - Data Triangulation
Involves using different sources of information in order to increase the validity of a study
These sources are likely to be stakeholders in a program - participants, other researchers, program staff, other community members, and so on.
Then we put all data in single framework & apply various statistical tools to find out the dynamic on the market.
During the analysis stage, feedback from the stakeholder groups would be compared to determine areas of agreement as well as areas of divergence