Key Insights
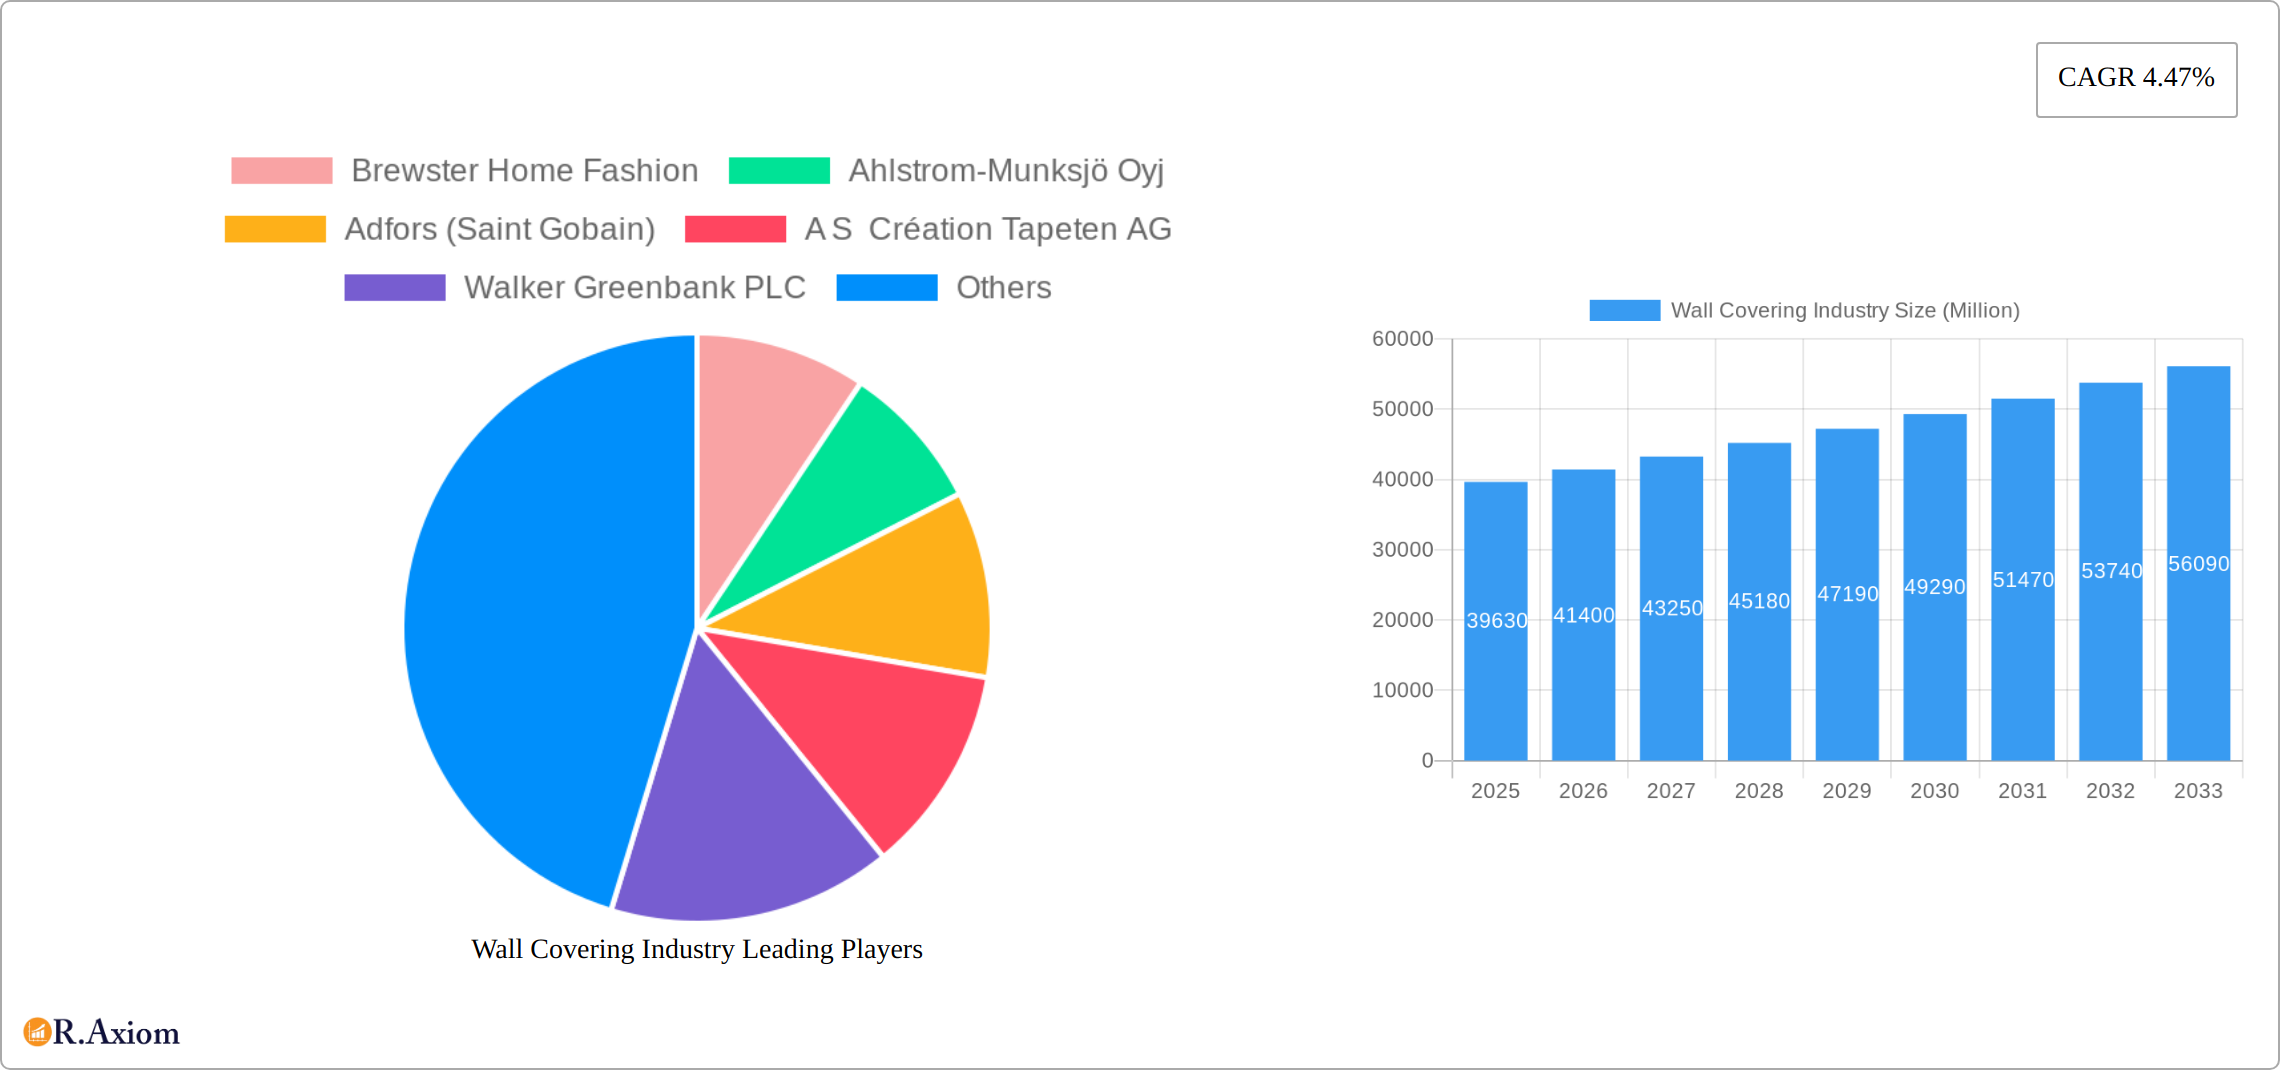
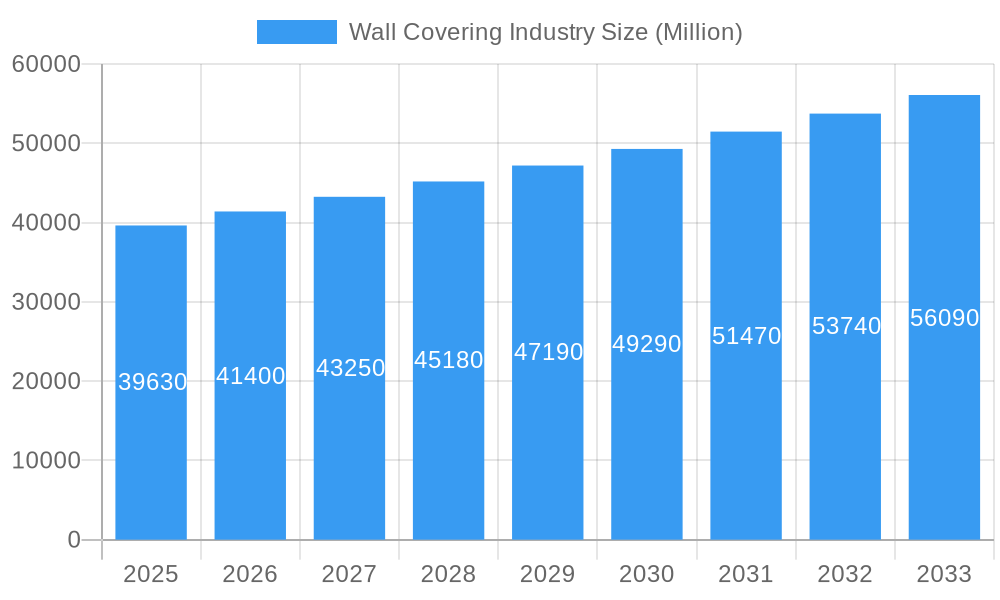
The global wall covering market, valued at $39.63 billion in 2025, is projected to experience robust growth, exhibiting a Compound Annual Growth Rate (CAGR) of 4.47% from 2025 to 2033. This expansion is driven by several key factors. Increasing urbanization and rising disposable incomes in developing economies fuel demand for home renovations and new construction, significantly impacting wall covering sales. The growing popularity of aesthetically pleasing and durable wall covering options, such as textured wallpapers and innovative tile alternatives, caters to diverse consumer preferences and design trends. Furthermore, the e-commerce boom has broadened distribution channels, improving accessibility and boosting market penetration. The residential sector remains the largest application segment, although commercial applications, particularly in hospitality and office spaces, are experiencing significant growth. While potential restraints like fluctuating raw material prices and increasing competition exist, the overall market outlook remains positive, fueled by ongoing innovation and the sustained demand for aesthetically enhanced interiors.
Wall Covering Industry Market Size (In Billion)
The market segmentation reveals a diverse landscape. The residential segment is the dominant application area, followed by commercial spaces. Within distribution channels, specialty stores and home centers hold a significant market share, reflecting consumer preference for in-person product selection and expert advice. However, the e-commerce segment is witnessing rapid growth, benefiting from its convenience and wide product selection. In terms of product type, wallpaper remains a popular choice, although innovative materials like tile and metal wall coverings are gaining traction, catering to modern design trends and specialized requirements for durability and ease of maintenance. Regional analysis indicates strong growth in Asia-Pacific, driven by rapid urbanization and infrastructure development in countries like China and India. North America and Europe also represent substantial markets, with mature yet dynamic consumer bases. Key players are strategically focusing on product diversification, innovative designs, and strategic partnerships to maintain their competitive edge in this growing market.
Wall Covering Industry Company Market Share
Wall Covering Industry: A Comprehensive Market Report (2019-2033)
This comprehensive report provides a detailed analysis of the global wall covering industry, offering valuable insights for industry stakeholders, investors, and businesses seeking to understand this dynamic market. The report covers the period 2019-2033, with a base year of 2025 and a forecast period of 2025-2033. The total market value is estimated at $XX Million in 2025, projecting significant growth throughout the forecast period.
Wall Covering Industry Market Concentration & Innovation
The global wall covering market exhibits a moderately concentrated landscape, dominated by a few key players holding substantial market share. Prominent companies such as Brewster Home Fashion, Ahlstrom-Munksjö Oyj, and Asian Paints Ltd. command significant portions of the market, although precise figures remain commercially sensitive. This competitive dynamic is further shaped by ongoing innovation fueled by evolving consumer preferences, technological breakthroughs, and the increasing demand for sustainable and environmentally responsible products. Mergers and acquisitions (M&A) activity significantly influences market dynamics, with recent deals primarily focused on expanding product portfolios and extending geographical reach. For instance, the estimated value of major M&A transactions between 2021 and 2024 is substantial (specific figures are confidential). Regulatory compliance regarding material safety and environmental standards exerts a considerable influence on product development and manufacturing processes. Moreover, the adoption of digital printing technologies and the introduction of novel materials, including metal and tile wall coverings, are driving significant transformations within the sector. The industry also faces competitive pressure from substitute materials like paint and textured plaster. End-user trends strongly indicate a growing preference for personalized designs, custom patterns, and environmentally conscious options.
- Market Share Concentration: Highly concentrated among leading players.
- M&A Activity: Robust activity focused on expansion and diversification. Significant deal value observed (2021-2024).
- Innovation Drivers: Technological advancements, sustainability priorities, and shifting consumer preferences.
- Regulatory Framework: Substantial impact on materials and manufacturing processes, requiring ongoing compliance.
Wall Covering Industry Industry Trends & Insights
The global wall covering market is experiencing robust growth, driven by factors such as rising disposable incomes, increasing urbanization, and the growing emphasis on home improvement and interior design. The compound annual growth rate (CAGR) is estimated to be xx% during the forecast period. Technological disruptions, primarily the introduction of digital printing technologies, allow for greater customization and design flexibility, thereby fueling market expansion. Consumer preferences are shifting towards eco-friendly, durable, and easy-to-install wall coverings. Market penetration of digital printing technologies is steadily increasing, with an estimated xx% penetration rate by 2033. Competitive dynamics are characterized by both price competition and differentiation through product innovation and brand building. Key trends include the growth of e-commerce channels, the increasing popularity of sustainable wall coverings, and the integration of smart home technology. The market is also segmented by product type, with wallpaper continuing to dominate, followed by wall panels.
Dominant Markets & Segments in Wall Covering Industry
North America currently leads the global wall covering market, driven by robust construction activity, high disposable incomes, and a strong consumer preference for home improvement projects. This regional dominance is further reinforced by factors such as the established home improvement culture and the availability of extensive retail channels.
- By Distribution Channel: Specialty stores and large home improvement centers maintain the largest market share, although online e-commerce platforms are experiencing rapid expansion, challenging traditional distribution models.
- By Product Type: Wallpaper retains a dominant market position, while wall panels are demonstrating robust growth, reflecting changing design trends and consumer preferences.
- By Application: The residential sector commands the largest market share, followed by the commercial sector.
- Key Drivers (Residential): Rising disposable incomes, increasing homeownership rates, and a sustained focus on home improvement and renovation projects.
- Key Drivers (Commercial): Growth in commercial construction, a rise in renovation projects, and evolving interior design trends which favor high-quality wall coverings.
Dominance Analysis: The residential sector in North America currently represents the most dominant market segment, driven by high homeownership rates and increased investment in home improvement. While specialty stores and large home improvement centers maintain significant market share within distribution channels, the rapid growth of online retailers is reshaping the competitive landscape.
Wall Covering Industry Product Developments
Recent product innovations include the introduction of eco-friendly materials, digitally printed wallpapers with personalized designs, and wall coverings with enhanced acoustic properties. These developments aim to cater to the growing demand for sustainable, aesthetically appealing, and functional wall coverings. Technological advancements in printing technology, material science, and installation methods contribute significantly to improved product quality and ease of use. The market is also seeing the rise of innovative product types, such as textured wall panels and 3D wallpapers. These new products appeal to consumers seeking unique aesthetics and functional benefits.
Report Scope & Segmentation Analysis
This report segments the wall covering market based on distribution channel (specialty store, home center, building material dealer, furniture store, mass merchandiser, e-commerce, other), product type (wall panel, wallpaper, tile, metal, other), and application (commercial, residential). Each segment's growth projections, market sizes, and competitive dynamics are thoroughly analyzed, revealing substantial growth potential across all segments, particularly within the e-commerce and eco-friendly product categories. Detailed estimations of market size for each segment in 2025 and projected values for 2033 are included within the full report.
Key Drivers of Wall Covering Industry Growth
The growth trajectory of the wall covering industry is propelled by several key factors. These include rising disposable incomes, resulting in increased spending on home improvement projects; urbanization, driving demand for new construction and extensive renovation; and technological advancements, enabling greater product customization and design flexibility. Furthermore, supportive economic policies and government initiatives within the construction sector provide additional impetus to market expansion. The growing preference for aesthetically pleasing and functional interior spaces, along with a rising awareness of environmental impact, constitutes another major growth driver.
Challenges in the Wall Covering Industry Sector
The wall covering industry faces several challenges. Fluctuations in raw material prices and supply chain disruptions can impact profitability. Increasing competition, particularly from substitute materials like paint, necessitates continuous innovation and product differentiation. Stringent environmental regulations regarding VOC emissions pose a considerable challenge. The impact of these factors on overall market growth is estimated at approximately xx% reduction in overall projected growth.
Emerging Opportunities in Wall Covering Industry
The wall covering industry presents numerous promising opportunities for growth and innovation. The increasing popularity of eco-friendly and sustainable wall coverings presents a significant growth avenue, aligning with the growing consumer awareness of environmental issues. Expansion into new geographical markets, particularly in developing economies experiencing rapid urbanization, offers substantial potential. The integration of smart home technologies into wall covering products and the development of innovative designs and patterns will further fuel market expansion. Finally, the e-commerce channel offers a significant avenue for expanding market reach and improving sales efficiency.
Leading Players in the Wall Covering Industry Market
- Brewster Home Fashion
- Ahlstrom-Munksjö Oyj
- Adfors (Saint Gobain)
- A S Création Tapeten AG
- Walker Greenbank PLC
- Grandeco Wallfashion Group
- Benjamin Moore & Co
- J Josephson Inc
- Asian Paints Ltd
- York Wallcoverings Inc
Key Developments in Wall Covering Industry Industry
- May 2023: Asian Paints launched its home studio in Chennai, showcasing new home decor collections, including wallpapers. This signifies increased market penetration and diversification of product offerings.
- August 2022: Sanderson Design Group's partnership with Disney broadened its product line and access to a wider consumer base. This strategic move demonstrates a focus on leveraging licensing opportunities.
Strategic Outlook for Wall Covering Industry Market
The wall covering industry is poised for continued growth, driven by a confluence of factors including innovation, sustainability initiatives, and the expanding reach of e-commerce. The focus on personalized designs, eco-friendly materials, and functional attributes will enhance the market's attractiveness to consumers and investors alike. Companies that successfully adapt to evolving consumer preferences and technological advancements will be best positioned for long-term success and profitability. The sustained demand for aesthetically pleasing and functional wall coverings will provide ample opportunities for growth and expansion within the market.
Wall Covering Industry Segmentation
-
1. Product Type
- 1.1. Wall Panel
-
1.2. Wall Paper
- 1.2.1. Vinyl Wallpaper
- 1.2.2. Non-woven Wallpaper
- 1.2.3. Paper-based Wallpaper
- 1.2.4. Fabric Wallpaper
- 1.2.5. Other Wallpaper Types
- 1.3. Tile
- 1.4. Metal Wall Covering
- 1.5. Other Product Types
-
2. Application
- 2.1. Commercial
- 2.2. Residential
-
3. Distribution Channel
- 3.1. Specialty Store
- 3.2. Home Center
- 3.3. Building Material Dealer
- 3.4. Furniture Store
- 3.5. Mass Merchandizer
- 3.6. E-commerce
- 3.7. Other Distribution Channels
Wall Covering Industry Segmentation By Geography
-
1. North America
- 1.1. United States
- 1.2. Canada
-
2. Europe
- 2.1. United Kingdom
- 2.2. Germany
- 2.3. France
- 2.4. Spain
- 2.5. Italy
-
3. Asia Pacific
- 3.1. China
- 3.2. India
- 3.3. Japan
- 4. Australia and New Zealand
-
5. Latin America
- 5.1. Brazil
- 5.2. Mexico
- 5.3. Argentina
-
6. Middle East and Africa
- 6.1. Saudi Arabia
- 6.2. United Arab Emirates
- 6.3. South Africa
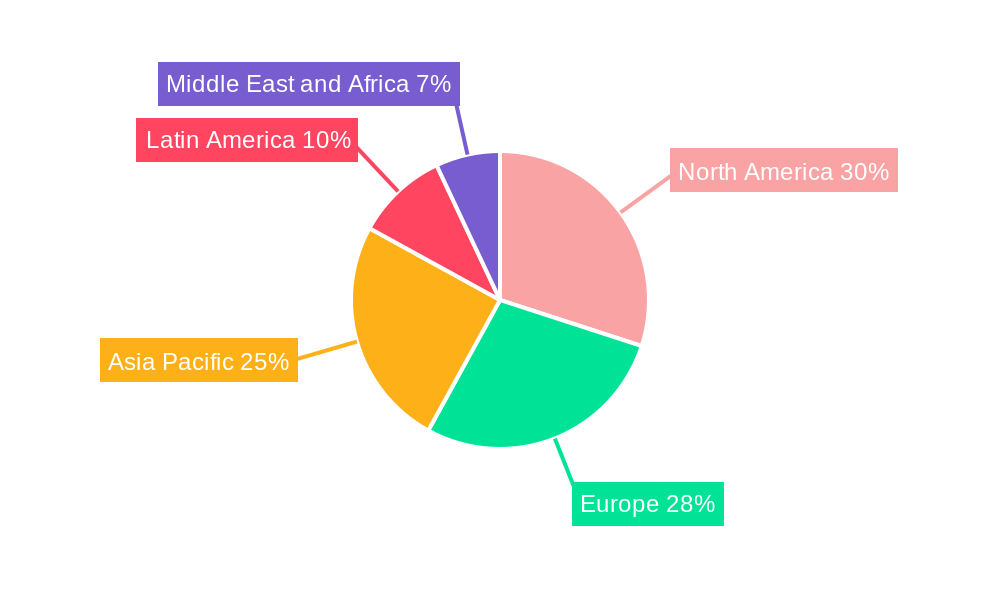
Wall Covering Industry Regional Market Share
Geographic Coverage of Wall Covering Industry
Wall Covering Industry REPORT HIGHLIGHTS
| Aspects | Details |
|---|---|
| Study Period | 2020-2034 |
| Base Year | 2025 |
| Estimated Year | 2026 |
| Forecast Period | 2026-2034 |
| Historical Period | 2020-2025 |
| Growth Rate | CAGR of 4.47% from 2020-2034 |
| Segmentation |
|
Table of Contents
- 1. Introduction
- 1.1. Research Scope
- 1.2. Market Segmentation
- 1.3. Research Objective
- 1.4. Definitions and Assumptions
- 2. Executive Summary
- 2.1. Market Snapshot
- 3. Market Dynamics
- 3.1. Market Drivers
- 3.2. Market Restrains
- 3.3. Market Trends
- 3.4. Market Opportunities
- 4. Market Factor Analysis
- 4.1. Porters Five Forces
- 4.1.1. Bargaining Power of Suppliers
- 4.1.2. Bargaining Power of Buyers
- 4.1.3. Threat of New Entrants
- 4.1.4. Threat of Substitutes
- 4.1.5. Competitive Rivalry
- 4.2. PESTEL analysis
- 4.3. BCG Analysis
- 4.3.1. Stars (High Growth, High Market Share)
- 4.3.2. Cash Cows (Low Growth, High Market Share)
- 4.3.3. Question Mark (High Growth, Low Market Share)
- 4.3.4. Dogs (Low Growth, Low Market Share)
- 4.4. Ansoff Matrix Analysis
- 4.5. Supply Chain Analysis
- 4.6. Regulatory Landscape
- 4.7. Current Market Potential and Opportunity Assessment (TAM–SAM–SOM Framework)
- 4.8. RAX Analyst Note
- 4.1. Porters Five Forces
- 5. Market Analysis, Insights and Forecast 2021-2033
- 5.1. Market Analysis, Insights and Forecast - by Product Type
- 5.1.1. Wall Panel
- 5.1.2. Wall Paper
- 5.1.2.1. Vinyl Wallpaper
- 5.1.2.2. Non-woven Wallpaper
- 5.1.2.3. Paper-based Wallpaper
- 5.1.2.4. Fabric Wallpaper
- 5.1.2.5. Other Wallpaper Types
- 5.1.3. Tile
- 5.1.4. Metal Wall Covering
- 5.1.5. Other Product Types
- 5.2. Market Analysis, Insights and Forecast - by Application
- 5.2.1. Commercial
- 5.2.2. Residential
- 5.3. Market Analysis, Insights and Forecast - by Distribution Channel
- 5.3.1. Specialty Store
- 5.3.2. Home Center
- 5.3.3. Building Material Dealer
- 5.3.4. Furniture Store
- 5.3.5. Mass Merchandizer
- 5.3.6. E-commerce
- 5.3.7. Other Distribution Channels
- 5.4. Market Analysis, Insights and Forecast - by Region
- 5.4.1. North America
- 5.4.2. Europe
- 5.4.3. Asia Pacific
- 5.4.4. Australia and New Zealand
- 5.4.5. Latin America
- 5.4.6. Middle East and Africa
- 5.1. Market Analysis, Insights and Forecast - by Product Type
- 6. Global Wall Covering Industry Analysis, Insights and Forecast, 2021-2033
- 6.1. Market Analysis, Insights and Forecast - by Product Type
- 6.1.1. Wall Panel
- 6.1.2. Wall Paper
- 6.1.2.1. Vinyl Wallpaper
- 6.1.2.2. Non-woven Wallpaper
- 6.1.2.3. Paper-based Wallpaper
- 6.1.2.4. Fabric Wallpaper
- 6.1.2.5. Other Wallpaper Types
- 6.1.3. Tile
- 6.1.4. Metal Wall Covering
- 6.1.5. Other Product Types
- 6.2. Market Analysis, Insights and Forecast - by Application
- 6.2.1. Commercial
- 6.2.2. Residential
- 6.3. Market Analysis, Insights and Forecast - by Distribution Channel
- 6.3.1. Specialty Store
- 6.3.2. Home Center
- 6.3.3. Building Material Dealer
- 6.3.4. Furniture Store
- 6.3.5. Mass Merchandizer
- 6.3.6. E-commerce
- 6.3.7. Other Distribution Channels
- 6.1. Market Analysis, Insights and Forecast - by Product Type
- 7. North America Wall Covering Industry Analysis, Insights and Forecast, 2020-2032
- 7.1. Market Analysis, Insights and Forecast - by Product Type
- 7.1.1. Wall Panel
- 7.1.2. Wall Paper
- 7.1.2.1. Vinyl Wallpaper
- 7.1.2.2. Non-woven Wallpaper
- 7.1.2.3. Paper-based Wallpaper
- 7.1.2.4. Fabric Wallpaper
- 7.1.2.5. Other Wallpaper Types
- 7.1.3. Tile
- 7.1.4. Metal Wall Covering
- 7.1.5. Other Product Types
- 7.2. Market Analysis, Insights and Forecast - by Application
- 7.2.1. Commercial
- 7.2.2. Residential
- 7.3. Market Analysis, Insights and Forecast - by Distribution Channel
- 7.3.1. Specialty Store
- 7.3.2. Home Center
- 7.3.3. Building Material Dealer
- 7.3.4. Furniture Store
- 7.3.5. Mass Merchandizer
- 7.3.6. E-commerce
- 7.3.7. Other Distribution Channels
- 7.1. Market Analysis, Insights and Forecast - by Product Type
- 8. Europe Wall Covering Industry Analysis, Insights and Forecast, 2020-2032
- 8.1. Market Analysis, Insights and Forecast - by Product Type
- 8.1.1. Wall Panel
- 8.1.2. Wall Paper
- 8.1.2.1. Vinyl Wallpaper
- 8.1.2.2. Non-woven Wallpaper
- 8.1.2.3. Paper-based Wallpaper
- 8.1.2.4. Fabric Wallpaper
- 8.1.2.5. Other Wallpaper Types
- 8.1.3. Tile
- 8.1.4. Metal Wall Covering
- 8.1.5. Other Product Types
- 8.2. Market Analysis, Insights and Forecast - by Application
- 8.2.1. Commercial
- 8.2.2. Residential
- 8.3. Market Analysis, Insights and Forecast - by Distribution Channel
- 8.3.1. Specialty Store
- 8.3.2. Home Center
- 8.3.3. Building Material Dealer
- 8.3.4. Furniture Store
- 8.3.5. Mass Merchandizer
- 8.3.6. E-commerce
- 8.3.7. Other Distribution Channels
- 8.1. Market Analysis, Insights and Forecast - by Product Type
- 9. Asia Pacific Wall Covering Industry Analysis, Insights and Forecast, 2020-2032
- 9.1. Market Analysis, Insights and Forecast - by Product Type
- 9.1.1. Wall Panel
- 9.1.2. Wall Paper
- 9.1.2.1. Vinyl Wallpaper
- 9.1.2.2. Non-woven Wallpaper
- 9.1.2.3. Paper-based Wallpaper
- 9.1.2.4. Fabric Wallpaper
- 9.1.2.5. Other Wallpaper Types
- 9.1.3. Tile
- 9.1.4. Metal Wall Covering
- 9.1.5. Other Product Types
- 9.2. Market Analysis, Insights and Forecast - by Application
- 9.2.1. Commercial
- 9.2.2. Residential
- 9.3. Market Analysis, Insights and Forecast - by Distribution Channel
- 9.3.1. Specialty Store
- 9.3.2. Home Center
- 9.3.3. Building Material Dealer
- 9.3.4. Furniture Store
- 9.3.5. Mass Merchandizer
- 9.3.6. E-commerce
- 9.3.7. Other Distribution Channels
- 9.1. Market Analysis, Insights and Forecast - by Product Type
- 10. Australia and New Zealand Wall Covering Industry Analysis, Insights and Forecast, 2020-2032
- 10.1. Market Analysis, Insights and Forecast - by Product Type
- 10.1.1. Wall Panel
- 10.1.2. Wall Paper
- 10.1.2.1. Vinyl Wallpaper
- 10.1.2.2. Non-woven Wallpaper
- 10.1.2.3. Paper-based Wallpaper
- 10.1.2.4. Fabric Wallpaper
- 10.1.2.5. Other Wallpaper Types
- 10.1.3. Tile
- 10.1.4. Metal Wall Covering
- 10.1.5. Other Product Types
- 10.2. Market Analysis, Insights and Forecast - by Application
- 10.2.1. Commercial
- 10.2.2. Residential
- 10.3. Market Analysis, Insights and Forecast - by Distribution Channel
- 10.3.1. Specialty Store
- 10.3.2. Home Center
- 10.3.3. Building Material Dealer
- 10.3.4. Furniture Store
- 10.3.5. Mass Merchandizer
- 10.3.6. E-commerce
- 10.3.7. Other Distribution Channels
- 10.1. Market Analysis, Insights and Forecast - by Product Type
- 11. Latin America Wall Covering Industry Analysis, Insights and Forecast, 2020-2032
- 11.1. Market Analysis, Insights and Forecast - by Product Type
- 11.1.1. Wall Panel
- 11.1.2. Wall Paper
- 11.1.2.1. Vinyl Wallpaper
- 11.1.2.2. Non-woven Wallpaper
- 11.1.2.3. Paper-based Wallpaper
- 11.1.2.4. Fabric Wallpaper
- 11.1.2.5. Other Wallpaper Types
- 11.1.3. Tile
- 11.1.4. Metal Wall Covering
- 11.1.5. Other Product Types
- 11.2. Market Analysis, Insights and Forecast - by Application
- 11.2.1. Commercial
- 11.2.2. Residential
- 11.3. Market Analysis, Insights and Forecast - by Distribution Channel
- 11.3.1. Specialty Store
- 11.3.2. Home Center
- 11.3.3. Building Material Dealer
- 11.3.4. Furniture Store
- 11.3.5. Mass Merchandizer
- 11.3.6. E-commerce
- 11.3.7. Other Distribution Channels
- 11.1. Market Analysis, Insights and Forecast - by Product Type
- 12. Middle East and Africa Wall Covering Industry Analysis, Insights and Forecast, 2020-2032
- 12.1. Market Analysis, Insights and Forecast - by Product Type
- 12.1.1. Wall Panel
- 12.1.2. Wall Paper
- 12.1.2.1. Vinyl Wallpaper
- 12.1.2.2. Non-woven Wallpaper
- 12.1.2.3. Paper-based Wallpaper
- 12.1.2.4. Fabric Wallpaper
- 12.1.2.5. Other Wallpaper Types
- 12.1.3. Tile
- 12.1.4. Metal Wall Covering
- 12.1.5. Other Product Types
- 12.2. Market Analysis, Insights and Forecast - by Application
- 12.2.1. Commercial
- 12.2.2. Residential
- 12.3. Market Analysis, Insights and Forecast - by Distribution Channel
- 12.3.1. Specialty Store
- 12.3.2. Home Center
- 12.3.3. Building Material Dealer
- 12.3.4. Furniture Store
- 12.3.5. Mass Merchandizer
- 12.3.6. E-commerce
- 12.3.7. Other Distribution Channels
- 12.1. Market Analysis, Insights and Forecast - by Product Type
- 13. Competitive Analysis
- 13.1. Company Profiles
- 13.1.1 Brewster Home Fashion
- 13.1.1.1. Company Overview
- 13.1.1.2. Products
- 13.1.1.3. Company Financials
- 13.1.1.4. SWOT Analysis
- 13.1.2 Ahlstrom-Munksjö Oyj
- 13.1.2.1. Company Overview
- 13.1.2.2. Products
- 13.1.2.3. Company Financials
- 13.1.2.4. SWOT Analysis
- 13.1.3 Adfors (Saint Gobain)
- 13.1.3.1. Company Overview
- 13.1.3.2. Products
- 13.1.3.3. Company Financials
- 13.1.3.4. SWOT Analysis
- 13.1.4 A S Création Tapeten AG
- 13.1.4.1. Company Overview
- 13.1.4.2. Products
- 13.1.4.3. Company Financials
- 13.1.4.4. SWOT Analysis
- 13.1.5 Walker Greenbank PLC
- 13.1.5.1. Company Overview
- 13.1.5.2. Products
- 13.1.5.3. Company Financials
- 13.1.5.4. SWOT Analysis
- 13.1.6 Grandeco Wallfashion Group
- 13.1.6.1. Company Overview
- 13.1.6.2. Products
- 13.1.6.3. Company Financials
- 13.1.6.4. SWOT Analysis
- 13.1.7 Benjamin Moore & Co
- 13.1.7.1. Company Overview
- 13.1.7.2. Products
- 13.1.7.3. Company Financials
- 13.1.7.4. SWOT Analysis
- 13.1.8 J Josephson Inc
- 13.1.8.1. Company Overview
- 13.1.8.2. Products
- 13.1.8.3. Company Financials
- 13.1.8.4. SWOT Analysis
- 13.1.9 Asian Paints Ltd
- 13.1.9.1. Company Overview
- 13.1.9.2. Products
- 13.1.9.3. Company Financials
- 13.1.9.4. SWOT Analysis
- 13.1.10 York Wallcoverings Inc
- 13.1.10.1. Company Overview
- 13.1.10.2. Products
- 13.1.10.3. Company Financials
- 13.1.10.4. SWOT Analysis
- 13.1.1 Brewster Home Fashion
- 13.2. Market Entropy
- 13.2.1 Company's Key Areas Served
- 13.2.2 Recent Developments
- 13.3. Company Market Share Analysis 2025
- 13.3.1 Top 5 Companies Market Share Analysis
- 13.3.2 Top 3 Companies Market Share Analysis
- 13.4. List of Potential Customers
- 14. Research Methodology
List of Figures
- Figure 1: Global Wall Covering Industry Revenue Breakdown (Million, %) by Region 2025 & 2033
- Figure 2: North America Wall Covering Industry Revenue (Million), by Product Type 2025 & 2033
- Figure 3: North America Wall Covering Industry Revenue Share (%), by Product Type 2025 & 2033
- Figure 4: North America Wall Covering Industry Revenue (Million), by Application 2025 & 2033
- Figure 5: North America Wall Covering Industry Revenue Share (%), by Application 2025 & 2033
- Figure 6: North America Wall Covering Industry Revenue (Million), by Distribution Channel 2025 & 2033
- Figure 7: North America Wall Covering Industry Revenue Share (%), by Distribution Channel 2025 & 2033
- Figure 8: North America Wall Covering Industry Revenue (Million), by Country 2025 & 2033
- Figure 9: North America Wall Covering Industry Revenue Share (%), by Country 2025 & 2033
- Figure 10: Europe Wall Covering Industry Revenue (Million), by Product Type 2025 & 2033
- Figure 11: Europe Wall Covering Industry Revenue Share (%), by Product Type 2025 & 2033
- Figure 12: Europe Wall Covering Industry Revenue (Million), by Application 2025 & 2033
- Figure 13: Europe Wall Covering Industry Revenue Share (%), by Application 2025 & 2033
- Figure 14: Europe Wall Covering Industry Revenue (Million), by Distribution Channel 2025 & 2033
- Figure 15: Europe Wall Covering Industry Revenue Share (%), by Distribution Channel 2025 & 2033
- Figure 16: Europe Wall Covering Industry Revenue (Million), by Country 2025 & 2033
- Figure 17: Europe Wall Covering Industry Revenue Share (%), by Country 2025 & 2033
- Figure 18: Asia Pacific Wall Covering Industry Revenue (Million), by Product Type 2025 & 2033
- Figure 19: Asia Pacific Wall Covering Industry Revenue Share (%), by Product Type 2025 & 2033
- Figure 20: Asia Pacific Wall Covering Industry Revenue (Million), by Application 2025 & 2033
- Figure 21: Asia Pacific Wall Covering Industry Revenue Share (%), by Application 2025 & 2033
- Figure 22: Asia Pacific Wall Covering Industry Revenue (Million), by Distribution Channel 2025 & 2033
- Figure 23: Asia Pacific Wall Covering Industry Revenue Share (%), by Distribution Channel 2025 & 2033
- Figure 24: Asia Pacific Wall Covering Industry Revenue (Million), by Country 2025 & 2033
- Figure 25: Asia Pacific Wall Covering Industry Revenue Share (%), by Country 2025 & 2033
- Figure 26: Australia and New Zealand Wall Covering Industry Revenue (Million), by Product Type 2025 & 2033
- Figure 27: Australia and New Zealand Wall Covering Industry Revenue Share (%), by Product Type 2025 & 2033
- Figure 28: Australia and New Zealand Wall Covering Industry Revenue (Million), by Application 2025 & 2033
- Figure 29: Australia and New Zealand Wall Covering Industry Revenue Share (%), by Application 2025 & 2033
- Figure 30: Australia and New Zealand Wall Covering Industry Revenue (Million), by Distribution Channel 2025 & 2033
- Figure 31: Australia and New Zealand Wall Covering Industry Revenue Share (%), by Distribution Channel 2025 & 2033
- Figure 32: Australia and New Zealand Wall Covering Industry Revenue (Million), by Country 2025 & 2033
- Figure 33: Australia and New Zealand Wall Covering Industry Revenue Share (%), by Country 2025 & 2033
- Figure 34: Latin America Wall Covering Industry Revenue (Million), by Product Type 2025 & 2033
- Figure 35: Latin America Wall Covering Industry Revenue Share (%), by Product Type 2025 & 2033
- Figure 36: Latin America Wall Covering Industry Revenue (Million), by Application 2025 & 2033
- Figure 37: Latin America Wall Covering Industry Revenue Share (%), by Application 2025 & 2033
- Figure 38: Latin America Wall Covering Industry Revenue (Million), by Distribution Channel 2025 & 2033
- Figure 39: Latin America Wall Covering Industry Revenue Share (%), by Distribution Channel 2025 & 2033
- Figure 40: Latin America Wall Covering Industry Revenue (Million), by Country 2025 & 2033
- Figure 41: Latin America Wall Covering Industry Revenue Share (%), by Country 2025 & 2033
- Figure 42: Middle East and Africa Wall Covering Industry Revenue (Million), by Product Type 2025 & 2033
- Figure 43: Middle East and Africa Wall Covering Industry Revenue Share (%), by Product Type 2025 & 2033
- Figure 44: Middle East and Africa Wall Covering Industry Revenue (Million), by Application 2025 & 2033
- Figure 45: Middle East and Africa Wall Covering Industry Revenue Share (%), by Application 2025 & 2033
- Figure 46: Middle East and Africa Wall Covering Industry Revenue (Million), by Distribution Channel 2025 & 2033
- Figure 47: Middle East and Africa Wall Covering Industry Revenue Share (%), by Distribution Channel 2025 & 2033
- Figure 48: Middle East and Africa Wall Covering Industry Revenue (Million), by Country 2025 & 2033
- Figure 49: Middle East and Africa Wall Covering Industry Revenue Share (%), by Country 2025 & 2033
List of Tables
- Table 1: Global Wall Covering Industry Revenue Million Forecast, by Product Type 2020 & 2033
- Table 2: Global Wall Covering Industry Revenue Million Forecast, by Application 2020 & 2033
- Table 3: Global Wall Covering Industry Revenue Million Forecast, by Distribution Channel 2020 & 2033
- Table 4: Global Wall Covering Industry Revenue Million Forecast, by Region 2020 & 2033
- Table 5: Global Wall Covering Industry Revenue Million Forecast, by Product Type 2020 & 2033
- Table 6: Global Wall Covering Industry Revenue Million Forecast, by Application 2020 & 2033
- Table 7: Global Wall Covering Industry Revenue Million Forecast, by Distribution Channel 2020 & 2033
- Table 8: Global Wall Covering Industry Revenue Million Forecast, by Country 2020 & 2033
- Table 9: United States Wall Covering Industry Revenue (Million) Forecast, by Application 2020 & 2033
- Table 10: Canada Wall Covering Industry Revenue (Million) Forecast, by Application 2020 & 2033
- Table 11: Global Wall Covering Industry Revenue Million Forecast, by Product Type 2020 & 2033
- Table 12: Global Wall Covering Industry Revenue Million Forecast, by Application 2020 & 2033
- Table 13: Global Wall Covering Industry Revenue Million Forecast, by Distribution Channel 2020 & 2033
- Table 14: Global Wall Covering Industry Revenue Million Forecast, by Country 2020 & 2033
- Table 15: United Kingdom Wall Covering Industry Revenue (Million) Forecast, by Application 2020 & 2033
- Table 16: Germany Wall Covering Industry Revenue (Million) Forecast, by Application 2020 & 2033
- Table 17: France Wall Covering Industry Revenue (Million) Forecast, by Application 2020 & 2033
- Table 18: Spain Wall Covering Industry Revenue (Million) Forecast, by Application 2020 & 2033
- Table 19: Italy Wall Covering Industry Revenue (Million) Forecast, by Application 2020 & 2033
- Table 20: Global Wall Covering Industry Revenue Million Forecast, by Product Type 2020 & 2033
- Table 21: Global Wall Covering Industry Revenue Million Forecast, by Application 2020 & 2033
- Table 22: Global Wall Covering Industry Revenue Million Forecast, by Distribution Channel 2020 & 2033
- Table 23: Global Wall Covering Industry Revenue Million Forecast, by Country 2020 & 2033
- Table 24: China Wall Covering Industry Revenue (Million) Forecast, by Application 2020 & 2033
- Table 25: India Wall Covering Industry Revenue (Million) Forecast, by Application 2020 & 2033
- Table 26: Japan Wall Covering Industry Revenue (Million) Forecast, by Application 2020 & 2033
- Table 27: Global Wall Covering Industry Revenue Million Forecast, by Product Type 2020 & 2033
- Table 28: Global Wall Covering Industry Revenue Million Forecast, by Application 2020 & 2033
- Table 29: Global Wall Covering Industry Revenue Million Forecast, by Distribution Channel 2020 & 2033
- Table 30: Global Wall Covering Industry Revenue Million Forecast, by Country 2020 & 2033
- Table 31: Global Wall Covering Industry Revenue Million Forecast, by Product Type 2020 & 2033
- Table 32: Global Wall Covering Industry Revenue Million Forecast, by Application 2020 & 2033
- Table 33: Global Wall Covering Industry Revenue Million Forecast, by Distribution Channel 2020 & 2033
- Table 34: Global Wall Covering Industry Revenue Million Forecast, by Country 2020 & 2033
- Table 35: Brazil Wall Covering Industry Revenue (Million) Forecast, by Application 2020 & 2033
- Table 36: Mexico Wall Covering Industry Revenue (Million) Forecast, by Application 2020 & 2033
- Table 37: Argentina Wall Covering Industry Revenue (Million) Forecast, by Application 2020 & 2033
- Table 38: Global Wall Covering Industry Revenue Million Forecast, by Product Type 2020 & 2033
- Table 39: Global Wall Covering Industry Revenue Million Forecast, by Application 2020 & 2033
- Table 40: Global Wall Covering Industry Revenue Million Forecast, by Distribution Channel 2020 & 2033
- Table 41: Global Wall Covering Industry Revenue Million Forecast, by Country 2020 & 2033
- Table 42: Saudi Arabia Wall Covering Industry Revenue (Million) Forecast, by Application 2020 & 2033
- Table 43: United Arab Emirates Wall Covering Industry Revenue (Million) Forecast, by Application 2020 & 2033
- Table 44: South Africa Wall Covering Industry Revenue (Million) Forecast, by Application 2020 & 2033
Frequently Asked Questions
1. What is the projected Compound Annual Growth Rate (CAGR) of the Wall Covering Industry?
The projected CAGR is approximately 4.47%.
2. Which companies are prominent players in the Wall Covering Industry?
Key companies in the market include Brewster Home Fashion, Ahlstrom-Munksjö Oyj, Adfors (Saint Gobain), A S Création Tapeten AG, Walker Greenbank PLC, Grandeco Wallfashion Group, Benjamin Moore & Co, J Josephson Inc, Asian Paints Ltd, York Wallcoverings Inc.
3. What are the main segments of the Wall Covering Industry?
The market segments include Product Type, Application, Distribution Channel.
4. Can you provide details about the market size?
The market size is estimated to be USD 39.63 Million as of 2022.
5. What are some drivers contributing to market growth?
Increasing Number of Residential Buildings; Availability of Styled Products; Increase in Do-it-yourself (DIY) Trends.
6. What are the notable trends driving market growth?
Wall Panel Segment is Expected Hold Significant Market Share.
7. Are there any restraints impacting market growth?
Limiting Availability and High Cost of Raw Materials.
8. Can you provide examples of recent developments in the market?
May 2023: Asian Paints announced the launch of the homes studio in Chennai and the 2023 collection for home decor. The studio offers a garden selection of fabrics, wallpapers, bedding, and rugs.
9. What pricing options are available for accessing the report?
Pricing options include single-user, multi-user, and enterprise licenses priced at USD 4750, USD 5250, and USD 8750 respectively.
10. Is the market size provided in terms of value or volume?
The market size is provided in terms of value, measured in Million.
11. Are there any specific market keywords associated with the report?
Yes, the market keyword associated with the report is "Wall Covering Industry," which aids in identifying and referencing the specific market segment covered.
12. How do I determine which pricing option suits my needs best?
The pricing options vary based on user requirements and access needs. Individual users may opt for single-user licenses, while businesses requiring broader access may choose multi-user or enterprise licenses for cost-effective access to the report.
13. Are there any additional resources or data provided in the Wall Covering Industry report?
While the report offers comprehensive insights, it's advisable to review the specific contents or supplementary materials provided to ascertain if additional resources or data are available.
14. How can I stay updated on further developments or reports in the Wall Covering Industry?
To stay informed about further developments, trends, and reports in the Wall Covering Industry, consider subscribing to industry newsletters, following relevant companies and organizations, or regularly checking reputable industry news sources and publications.
Methodology
Step 1 - Identification of Relevant Samples Size from Population Database


Step 2 - Approaches for Defining Global Market Size (Value, Volume* & Price*)

Note*: In applicable scenarios
Step 3 - Data Sources
Primary Research
- Web Analytics
- Survey Reports
- Research Institute
- Latest Research Reports
- Opinion Leaders
Secondary Research
- Annual Reports
- White Paper
- Latest Press Release
- Industry Association
- Paid Database
- Investor Presentations

Step 4 - Data Triangulation
Involves using different sources of information in order to increase the validity of a study
These sources are likely to be stakeholders in a program - participants, other researchers, program staff, other community members, and so on.
Then we put all data in single framework & apply various statistical tools to find out the dynamic on the market.
During the analysis stage, feedback from the stakeholder groups would be compared to determine areas of agreement as well as areas of divergence

