

Key Insights
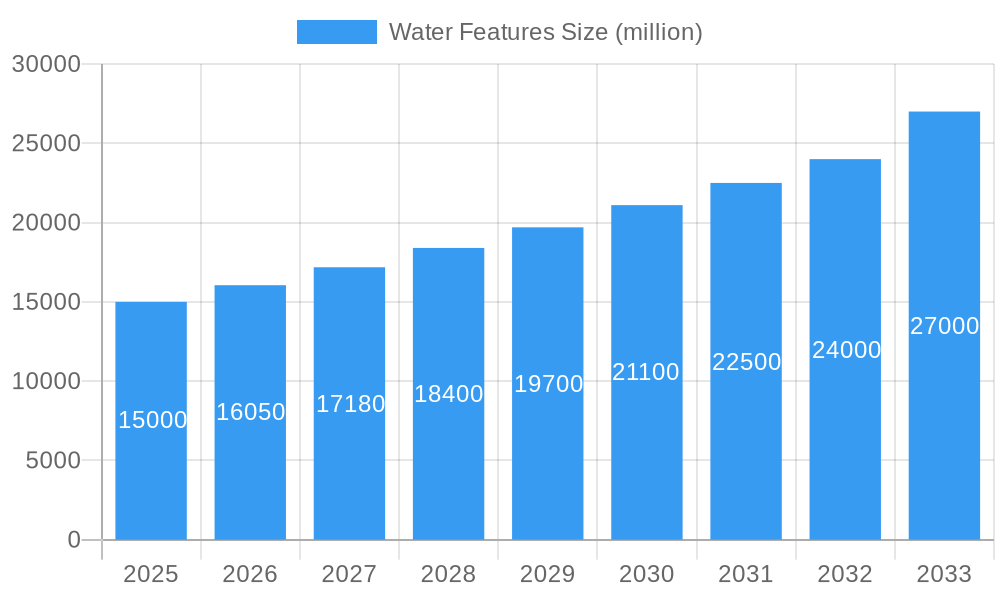
The global water features market is poised for significant expansion, driven by urbanization, rising disposable incomes, and a growing demand for aesthetically pleasing and eco-conscious landscaping. The market, valued at $2247.42 million in the base year 2025, is projected to grow at a Compound Annual Growth Rate (CAGR) of 6% through 2033. This growth is attributed to the increasing adoption of water features in the hospitality and commercial sectors, which enhance property appeal and create tranquil environments. Residential demand is also rising as homeowners seek to add value and serenity to their properties. Technological innovations, including energy-efficient pumps and LED lighting, are further stimulating market growth by reducing operational costs and expanding design possibilities.
Water Features Market Size (In Billion)
Despite promising growth, the market faces challenges such as high initial investment costs and concerns over water scarcity and usage. The market is segmented by application (residential, commercial, public), size, design, and material. Leading companies are focusing on technological advancements and strategic collaborations to maintain competitiveness. While North America and Europe currently dominate market share, the Asia-Pacific region is anticipated to experience the most rapid growth due to accelerated infrastructure development and urbanization. Market participants must prioritize innovation and adaptability to seize opportunities and navigate evolving challenges.
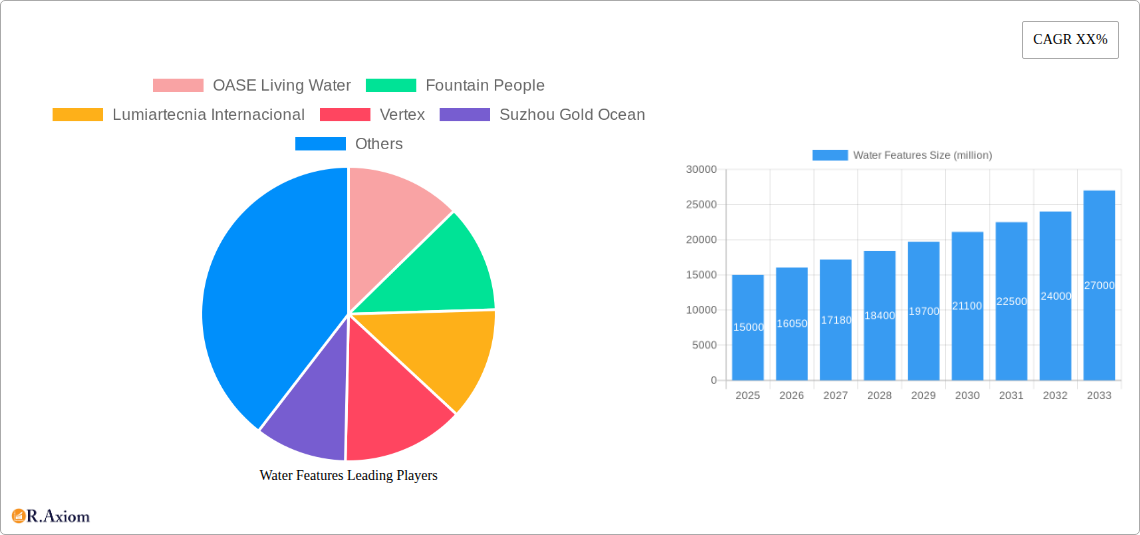
Water Features Company Market Share
Water Features Market Report: 2019-2033 - A Comprehensive Analysis of a $XX Million Industry
This comprehensive report provides an in-depth analysis of the global water features market, encompassing market size, growth drivers, key players, and future trends. The study period covers 2019-2033, with 2025 serving as the base and estimated year. The forecast period spans 2025-2033, while the historical period encompasses 2019-2024. This report is crucial for industry stakeholders, investors, and businesses seeking to understand and capitalize on the opportunities within this dynamic $XX million market.
Water Features Market Concentration & Innovation
The global water features market exhibits a moderately concentrated landscape, with several major players holding significant market share. Companies like OASE Living Water, Fountain People, Lumiartecnia Internacional, and Vertex collectively account for an estimated xx% of the market in 2025. However, the presence of numerous smaller, regional players indicates a competitive environment. Market share fluctuations are influenced by factors such as innovation cycles, M&A activity, and evolving consumer preferences.
- Market Concentration: The Herfindahl-Hirschman Index (HHI) for 2025 is estimated at xx, suggesting a moderately concentrated market.
- Innovation Drivers: Technological advancements in water-efficient designs, smart controls, and customizable features are driving market growth. The increasing popularity of sustainable and eco-friendly products further fuels innovation.
- Regulatory Frameworks: Stringent environmental regulations concerning water usage and energy efficiency are shaping product development and influencing market dynamics.
- Product Substitutes: Landscaping alternatives, such as dry landscapes and minimalist designs, pose a competitive threat to the water features market, especially in water-scarce regions.
- End-User Trends: Growing demand for aesthetically pleasing and relaxing outdoor spaces is driving adoption of water features in both residential and commercial settings. Demand for customizable, sustainable water features is also on the rise.
- M&A Activities: The past five years have witnessed several significant M&A deals in the water features industry, with a total estimated value of $XX million in transactions. These deals have primarily focused on expanding geographic reach and product portfolios.
Water Features Industry Trends & Insights
The global water features market is projected to experience robust growth, with a Compound Annual Growth Rate (CAGR) of xx% during the forecast period (2025-2033). This growth is fueled by several key factors: rising disposable incomes, increasing urbanization, and a growing preference for aesthetically pleasing outdoor spaces. Technological advancements, such as the integration of smart technology and energy-efficient designs, are also contributing to the market expansion. Consumer preferences are shifting towards eco-friendly and sustainable solutions, driving demand for water-efficient and low-maintenance water features. Competitive dynamics are characterized by intense rivalry amongst established players and the emergence of new entrants offering innovative products and services. Market penetration in emerging economies remains relatively low, presenting significant growth opportunities. The shift towards personalized and customizable water features is a significant trend.
Dominant Markets & Segments in Water Features
The North American market currently holds the largest share of the global water features market, driven by high disposable incomes, robust construction activity, and a strong preference for aesthetically pleasing outdoor landscapes. However, Asia-Pacific is expected to experience the fastest growth rate during the forecast period due to rapid urbanization, increasing tourism, and rising government investments in infrastructure projects.
- Key Drivers of North American Dominance:
- High disposable incomes
- Strong preference for outdoor landscaping
- Robust residential and commercial construction activities
- Key Drivers of Asia-Pacific Growth:
- Rapid urbanization and rising middle class
- Increased tourism and hospitality sector investments
- Government initiatives promoting infrastructure development
The residential segment dominates the market, accounting for approximately xx% of total revenue in 2025. However, the commercial segment is also witnessing significant growth, driven by increasing demand for water features in hotels, resorts, and public spaces.
Water Features Product Developments
Recent product innovations focus on energy-efficient pumps, LED lighting integration, and smart control systems that allow for remote operation and customization. Manufacturers are emphasizing sustainable materials and designs to cater to growing environmental concerns. Competitive advantages are derived from offering unique designs, superior durability, and advanced technological features. These advancements are making water features more accessible, affordable, and appealing to a broader customer base.
Report Scope & Segmentation Analysis
This report segments the water features market by product type (residential, commercial), material (stone, metal, plastic), application (residential gardens, commercial spaces, public areas), and region (North America, Europe, Asia-Pacific, Middle East & Africa, South America). Each segment's growth projections, market size, and competitive dynamics are analyzed extensively.
The residential segment is characterized by a wide variety of product offerings, catering to diverse preferences and budgets. The commercial segment focuses on larger-scale installations and bespoke designs, often incorporating advanced technology. Regional variations reflect diverse climatic conditions, architectural styles, and consumer preferences.
Key Drivers of Water Features Growth
Several factors contribute to the market's growth. Rising disposable incomes in developed and developing economies fuel demand for luxury outdoor amenities. Increasing urbanization leads to a greater need for aesthetically pleasing public spaces. Technological advancements enhance product functionality and efficiency, making them more attractive to consumers. Government initiatives promoting green spaces and sustainable landscaping encourage market adoption.
Challenges in the Water Features Sector
The water features sector faces challenges such as fluctuating raw material prices, supply chain disruptions, and increasing competition. Water scarcity in certain regions restricts market expansion, and stringent environmental regulations increase production costs. Maintaining consistent quality and durability of products is also a concern.
Emerging Opportunities in Water Features
Emerging opportunities include the integration of smart home technology, customizable designs, and the development of eco-friendly materials. Expansion into emerging markets with a growing middle class presents significant potential. The rising popularity of sustainable tourism and green spaces opens new opportunities for innovative water feature solutions.
Leading Players in the Water Features Market
- OASE Living Water
- Fountain People
- Lumiartecnia Internacional
- Vertex
- Suzhou Gold Ocean
- Otterbine
- Safe-Rain
- Delta Fountains
- Aqua Control
- Fontana Fountains
- Yixing Sea Fountain Equipment
- Kasco Marine
- Hall Fountains
- Eagle Fountains
- AquaTec Fountains
- Adagio Water Features
- Formedacqua
Key Developments in Water Features Industry
- 2022 Q3: OASE Living Water launched a new line of energy-efficient water pumps.
- 2023 Q1: A major merger occurred between two leading manufacturers, resulting in increased market consolidation.
- 2024 Q4: Several companies introduced water features incorporating smart technology and remote control capabilities. (Further details of specific events with dates would go here)
Strategic Outlook for Water Features Market
The water features market is poised for sustained growth, driven by ongoing urbanization, rising disposable incomes, and technological advancements. The focus on sustainability, smart technology, and customized designs will continue to shape market trends. Emerging economies offer considerable untapped potential, while further consolidation through M&A activity is expected.
Water Features Segmentation
-
1. Application
- 1.1. Residential
- 1.2. Commercial
- 1.3. Municipal
-
2. Types
- 2.1. Outdoor Fountains
- 2.2. Indoor Fountains
- 2.3. Waterfalls/Water Curtains
- 2.4. Other
Water Features Segmentation By Geography
-
1. North America
- 1.1. United States
- 1.2. Canada
- 1.3. Mexico
-
2. South America
- 2.1. Brazil
- 2.2. Argentina
- 2.3. Rest of South America
-
3. Europe
- 3.1. United Kingdom
- 3.2. Germany
- 3.3. France
- 3.4. Italy
- 3.5. Spain
- 3.6. Russia
- 3.7. Benelux
- 3.8. Nordics
- 3.9. Rest of Europe
-
4. Middle East & Africa
- 4.1. Turkey
- 4.2. Israel
- 4.3. GCC
- 4.4. North Africa
- 4.5. South Africa
- 4.6. Rest of Middle East & Africa
-
5. Asia Pacific
- 5.1. China
- 5.2. India
- 5.3. Japan
- 5.4. South Korea
- 5.5. ASEAN
- 5.6. Oceania
- 5.7. Rest of Asia Pacific

Water Features Regional Market Share
Geographic Coverage of Water Features
Water Features REPORT HIGHLIGHTS
| Aspects | Details |
|---|---|
| Study Period | 2020-2034 |
| Base Year | 2025 |
| Estimated Year | 2026 |
| Forecast Period | 2026-2034 |
| Historical Period | 2020-2025 |
| Growth Rate | CAGR of 6% from 2020-2034 |
| Segmentation |
|
Table of Contents
- 1. Introduction
- 1.1. Research Scope
- 1.2. Market Segmentation
- 1.3. Research Objective
- 1.4. Definitions and Assumptions
- 2. Executive Summary
- 2.1. Market Snapshot
- 3. Market Dynamics
- 3.1. Market Drivers
- 3.2. Market Restrains
- 3.3. Market Trends
- 3.4. Market Opportunities
- 4. Market Factor Analysis
- 4.1. Porters Five Forces
- 4.1.1. Bargaining Power of Suppliers
- 4.1.2. Bargaining Power of Buyers
- 4.1.3. Threat of New Entrants
- 4.1.4. Threat of Substitutes
- 4.1.5. Competitive Rivalry
- 4.2. PESTEL analysis
- 4.3. BCG Analysis
- 4.3.1. Stars (High Growth, High Market Share)
- 4.3.2. Cash Cows (Low Growth, High Market Share)
- 4.3.3. Question Mark (High Growth, Low Market Share)
- 4.3.4. Dogs (Low Growth, Low Market Share)
- 4.4. Ansoff Matrix Analysis
- 4.5. Supply Chain Analysis
- 4.6. Regulatory Landscape
- 4.7. Current Market Potential and Opportunity Assessment (TAM–SAM–SOM Framework)
- 4.8. RAX Analyst Note
- 4.1. Porters Five Forces
- 5. Market Analysis, Insights and Forecast 2021-2033
- 5.1. Market Analysis, Insights and Forecast - by Application
- 5.1.1. Residential
- 5.1.2. Commercial
- 5.1.3. Municipal
- 5.2. Market Analysis, Insights and Forecast - by Types
- 5.2.1. Outdoor Fountains
- 5.2.2. Indoor Fountains
- 5.2.3. Waterfalls/Water Curtains
- 5.2.4. Other
- 5.3. Market Analysis, Insights and Forecast - by Region
- 5.3.1. North America
- 5.3.2. South America
- 5.3.3. Europe
- 5.3.4. Middle East & Africa
- 5.3.5. Asia Pacific
- 5.1. Market Analysis, Insights and Forecast - by Application
- 6. Global Water Features Analysis, Insights and Forecast, 2021-2033
- 6.1. Market Analysis, Insights and Forecast - by Application
- 6.1.1. Residential
- 6.1.2. Commercial
- 6.1.3. Municipal
- 6.2. Market Analysis, Insights and Forecast - by Types
- 6.2.1. Outdoor Fountains
- 6.2.2. Indoor Fountains
- 6.2.3. Waterfalls/Water Curtains
- 6.2.4. Other
- 6.1. Market Analysis, Insights and Forecast - by Application
- 7. North America Water Features Analysis, Insights and Forecast, 2020-2032
- 7.1. Market Analysis, Insights and Forecast - by Application
- 7.1.1. Residential
- 7.1.2. Commercial
- 7.1.3. Municipal
- 7.2. Market Analysis, Insights and Forecast - by Types
- 7.2.1. Outdoor Fountains
- 7.2.2. Indoor Fountains
- 7.2.3. Waterfalls/Water Curtains
- 7.2.4. Other
- 7.1. Market Analysis, Insights and Forecast - by Application
- 8. South America Water Features Analysis, Insights and Forecast, 2020-2032
- 8.1. Market Analysis, Insights and Forecast - by Application
- 8.1.1. Residential
- 8.1.2. Commercial
- 8.1.3. Municipal
- 8.2. Market Analysis, Insights and Forecast - by Types
- 8.2.1. Outdoor Fountains
- 8.2.2. Indoor Fountains
- 8.2.3. Waterfalls/Water Curtains
- 8.2.4. Other
- 8.1. Market Analysis, Insights and Forecast - by Application
- 9. Europe Water Features Analysis, Insights and Forecast, 2020-2032
- 9.1. Market Analysis, Insights and Forecast - by Application
- 9.1.1. Residential
- 9.1.2. Commercial
- 9.1.3. Municipal
- 9.2. Market Analysis, Insights and Forecast - by Types
- 9.2.1. Outdoor Fountains
- 9.2.2. Indoor Fountains
- 9.2.3. Waterfalls/Water Curtains
- 9.2.4. Other
- 9.1. Market Analysis, Insights and Forecast - by Application
- 10. Middle East & Africa Water Features Analysis, Insights and Forecast, 2020-2032
- 10.1. Market Analysis, Insights and Forecast - by Application
- 10.1.1. Residential
- 10.1.2. Commercial
- 10.1.3. Municipal
- 10.2. Market Analysis, Insights and Forecast - by Types
- 10.2.1. Outdoor Fountains
- 10.2.2. Indoor Fountains
- 10.2.3. Waterfalls/Water Curtains
- 10.2.4. Other
- 10.1. Market Analysis, Insights and Forecast - by Application
- 11. Asia Pacific Water Features Analysis, Insights and Forecast, 2020-2032
- 11.1. Market Analysis, Insights and Forecast - by Application
- 11.1.1. Residential
- 11.1.2. Commercial
- 11.1.3. Municipal
- 11.2. Market Analysis, Insights and Forecast - by Types
- 11.2.1. Outdoor Fountains
- 11.2.2. Indoor Fountains
- 11.2.3. Waterfalls/Water Curtains
- 11.2.4. Other
- 11.1. Market Analysis, Insights and Forecast - by Application
- 12. Competitive Analysis
- 12.1. Company Profiles
- 12.1.1 OASE Living Water
- 12.1.1.1. Company Overview
- 12.1.1.2. Products
- 12.1.1.3. Company Financials
- 12.1.1.4. SWOT Analysis
- 12.1.2 Fountain People
- 12.1.2.1. Company Overview
- 12.1.2.2. Products
- 12.1.2.3. Company Financials
- 12.1.2.4. SWOT Analysis
- 12.1.3 Lumiartecnia Internacional
- 12.1.3.1. Company Overview
- 12.1.3.2. Products
- 12.1.3.3. Company Financials
- 12.1.3.4. SWOT Analysis
- 12.1.4 Vertex
- 12.1.4.1. Company Overview
- 12.1.4.2. Products
- 12.1.4.3. Company Financials
- 12.1.4.4. SWOT Analysis
- 12.1.5 Suzhou Gold Ocean
- 12.1.5.1. Company Overview
- 12.1.5.2. Products
- 12.1.5.3. Company Financials
- 12.1.5.4. SWOT Analysis
- 12.1.6 Otterbine
- 12.1.6.1. Company Overview
- 12.1.6.2. Products
- 12.1.6.3. Company Financials
- 12.1.6.4. SWOT Analysis
- 12.1.7 Safe-Rain
- 12.1.7.1. Company Overview
- 12.1.7.2. Products
- 12.1.7.3. Company Financials
- 12.1.7.4. SWOT Analysis
- 12.1.8 Delta Fountains
- 12.1.8.1. Company Overview
- 12.1.8.2. Products
- 12.1.8.3. Company Financials
- 12.1.8.4. SWOT Analysis
- 12.1.9 Aqua Control
- 12.1.9.1. Company Overview
- 12.1.9.2. Products
- 12.1.9.3. Company Financials
- 12.1.9.4. SWOT Analysis
- 12.1.10 Fontana Fountains
- 12.1.10.1. Company Overview
- 12.1.10.2. Products
- 12.1.10.3. Company Financials
- 12.1.10.4. SWOT Analysis
- 12.1.11 Yixing Sea Fountain Equipment
- 12.1.11.1. Company Overview
- 12.1.11.2. Products
- 12.1.11.3. Company Financials
- 12.1.11.4. SWOT Analysis
- 12.1.12 Kasco Marine
- 12.1.12.1. Company Overview
- 12.1.12.2. Products
- 12.1.12.3. Company Financials
- 12.1.12.4. SWOT Analysis
- 12.1.13 Hall Fountains
- 12.1.13.1. Company Overview
- 12.1.13.2. Products
- 12.1.13.3. Company Financials
- 12.1.13.4. SWOT Analysis
- 12.1.14 Eagle Fountains
- 12.1.14.1. Company Overview
- 12.1.14.2. Products
- 12.1.14.3. Company Financials
- 12.1.14.4. SWOT Analysis
- 12.1.15 AquaTec Fountains
- 12.1.15.1. Company Overview
- 12.1.15.2. Products
- 12.1.15.3. Company Financials
- 12.1.15.4. SWOT Analysis
- 12.1.16 Adagio Water Features
- 12.1.16.1. Company Overview
- 12.1.16.2. Products
- 12.1.16.3. Company Financials
- 12.1.16.4. SWOT Analysis
- 12.1.17 Formedacqua
- 12.1.17.1. Company Overview
- 12.1.17.2. Products
- 12.1.17.3. Company Financials
- 12.1.17.4. SWOT Analysis
- 12.1.1 OASE Living Water
- 12.2. Market Entropy
- 12.2.1 Company's Key Areas Served
- 12.2.2 Recent Developments
- 12.3. Company Market Share Analysis 2025
- 12.3.1 Top 5 Companies Market Share Analysis
- 12.3.2 Top 3 Companies Market Share Analysis
- 12.4. List of Potential Customers
- 13. Research Methodology
List of Figures
- Figure 1: Global Water Features Revenue Breakdown (million, %) by Region 2025 & 2033
- Figure 2: Global Water Features Volume Breakdown (K, %) by Region 2025 & 2033
- Figure 3: North America Water Features Revenue (million), by Application 2025 & 2033
- Figure 4: North America Water Features Volume (K), by Application 2025 & 2033
- Figure 5: North America Water Features Revenue Share (%), by Application 2025 & 2033
- Figure 6: North America Water Features Volume Share (%), by Application 2025 & 2033
- Figure 7: North America Water Features Revenue (million), by Types 2025 & 2033
- Figure 8: North America Water Features Volume (K), by Types 2025 & 2033
- Figure 9: North America Water Features Revenue Share (%), by Types 2025 & 2033
- Figure 10: North America Water Features Volume Share (%), by Types 2025 & 2033
- Figure 11: North America Water Features Revenue (million), by Country 2025 & 2033
- Figure 12: North America Water Features Volume (K), by Country 2025 & 2033
- Figure 13: North America Water Features Revenue Share (%), by Country 2025 & 2033
- Figure 14: North America Water Features Volume Share (%), by Country 2025 & 2033
- Figure 15: South America Water Features Revenue (million), by Application 2025 & 2033
- Figure 16: South America Water Features Volume (K), by Application 2025 & 2033
- Figure 17: South America Water Features Revenue Share (%), by Application 2025 & 2033
- Figure 18: South America Water Features Volume Share (%), by Application 2025 & 2033
- Figure 19: South America Water Features Revenue (million), by Types 2025 & 2033
- Figure 20: South America Water Features Volume (K), by Types 2025 & 2033
- Figure 21: South America Water Features Revenue Share (%), by Types 2025 & 2033
- Figure 22: South America Water Features Volume Share (%), by Types 2025 & 2033
- Figure 23: South America Water Features Revenue (million), by Country 2025 & 2033
- Figure 24: South America Water Features Volume (K), by Country 2025 & 2033
- Figure 25: South America Water Features Revenue Share (%), by Country 2025 & 2033
- Figure 26: South America Water Features Volume Share (%), by Country 2025 & 2033
- Figure 27: Europe Water Features Revenue (million), by Application 2025 & 2033
- Figure 28: Europe Water Features Volume (K), by Application 2025 & 2033
- Figure 29: Europe Water Features Revenue Share (%), by Application 2025 & 2033
- Figure 30: Europe Water Features Volume Share (%), by Application 2025 & 2033
- Figure 31: Europe Water Features Revenue (million), by Types 2025 & 2033
- Figure 32: Europe Water Features Volume (K), by Types 2025 & 2033
- Figure 33: Europe Water Features Revenue Share (%), by Types 2025 & 2033
- Figure 34: Europe Water Features Volume Share (%), by Types 2025 & 2033
- Figure 35: Europe Water Features Revenue (million), by Country 2025 & 2033
- Figure 36: Europe Water Features Volume (K), by Country 2025 & 2033
- Figure 37: Europe Water Features Revenue Share (%), by Country 2025 & 2033
- Figure 38: Europe Water Features Volume Share (%), by Country 2025 & 2033
- Figure 39: Middle East & Africa Water Features Revenue (million), by Application 2025 & 2033
- Figure 40: Middle East & Africa Water Features Volume (K), by Application 2025 & 2033
- Figure 41: Middle East & Africa Water Features Revenue Share (%), by Application 2025 & 2033
- Figure 42: Middle East & Africa Water Features Volume Share (%), by Application 2025 & 2033
- Figure 43: Middle East & Africa Water Features Revenue (million), by Types 2025 & 2033
- Figure 44: Middle East & Africa Water Features Volume (K), by Types 2025 & 2033
- Figure 45: Middle East & Africa Water Features Revenue Share (%), by Types 2025 & 2033
- Figure 46: Middle East & Africa Water Features Volume Share (%), by Types 2025 & 2033
- Figure 47: Middle East & Africa Water Features Revenue (million), by Country 2025 & 2033
- Figure 48: Middle East & Africa Water Features Volume (K), by Country 2025 & 2033
- Figure 49: Middle East & Africa Water Features Revenue Share (%), by Country 2025 & 2033
- Figure 50: Middle East & Africa Water Features Volume Share (%), by Country 2025 & 2033
- Figure 51: Asia Pacific Water Features Revenue (million), by Application 2025 & 2033
- Figure 52: Asia Pacific Water Features Volume (K), by Application 2025 & 2033
- Figure 53: Asia Pacific Water Features Revenue Share (%), by Application 2025 & 2033
- Figure 54: Asia Pacific Water Features Volume Share (%), by Application 2025 & 2033
- Figure 55: Asia Pacific Water Features Revenue (million), by Types 2025 & 2033
- Figure 56: Asia Pacific Water Features Volume (K), by Types 2025 & 2033
- Figure 57: Asia Pacific Water Features Revenue Share (%), by Types 2025 & 2033
- Figure 58: Asia Pacific Water Features Volume Share (%), by Types 2025 & 2033
- Figure 59: Asia Pacific Water Features Revenue (million), by Country 2025 & 2033
- Figure 60: Asia Pacific Water Features Volume (K), by Country 2025 & 2033
- Figure 61: Asia Pacific Water Features Revenue Share (%), by Country 2025 & 2033
- Figure 62: Asia Pacific Water Features Volume Share (%), by Country 2025 & 2033
List of Tables
- Table 1: Global Water Features Revenue million Forecast, by Application 2020 & 2033
- Table 2: Global Water Features Volume K Forecast, by Application 2020 & 2033
- Table 3: Global Water Features Revenue million Forecast, by Types 2020 & 2033
- Table 4: Global Water Features Volume K Forecast, by Types 2020 & 2033
- Table 5: Global Water Features Revenue million Forecast, by Region 2020 & 2033
- Table 6: Global Water Features Volume K Forecast, by Region 2020 & 2033
- Table 7: Global Water Features Revenue million Forecast, by Application 2020 & 2033
- Table 8: Global Water Features Volume K Forecast, by Application 2020 & 2033
- Table 9: Global Water Features Revenue million Forecast, by Types 2020 & 2033
- Table 10: Global Water Features Volume K Forecast, by Types 2020 & 2033
- Table 11: Global Water Features Revenue million Forecast, by Country 2020 & 2033
- Table 12: Global Water Features Volume K Forecast, by Country 2020 & 2033
- Table 13: United States Water Features Revenue (million) Forecast, by Application 2020 & 2033
- Table 14: United States Water Features Volume (K) Forecast, by Application 2020 & 2033
- Table 15: Canada Water Features Revenue (million) Forecast, by Application 2020 & 2033
- Table 16: Canada Water Features Volume (K) Forecast, by Application 2020 & 2033
- Table 17: Mexico Water Features Revenue (million) Forecast, by Application 2020 & 2033
- Table 18: Mexico Water Features Volume (K) Forecast, by Application 2020 & 2033
- Table 19: Global Water Features Revenue million Forecast, by Application 2020 & 2033
- Table 20: Global Water Features Volume K Forecast, by Application 2020 & 2033
- Table 21: Global Water Features Revenue million Forecast, by Types 2020 & 2033
- Table 22: Global Water Features Volume K Forecast, by Types 2020 & 2033
- Table 23: Global Water Features Revenue million Forecast, by Country 2020 & 2033
- Table 24: Global Water Features Volume K Forecast, by Country 2020 & 2033
- Table 25: Brazil Water Features Revenue (million) Forecast, by Application 2020 & 2033
- Table 26: Brazil Water Features Volume (K) Forecast, by Application 2020 & 2033
- Table 27: Argentina Water Features Revenue (million) Forecast, by Application 2020 & 2033
- Table 28: Argentina Water Features Volume (K) Forecast, by Application 2020 & 2033
- Table 29: Rest of South America Water Features Revenue (million) Forecast, by Application 2020 & 2033
- Table 30: Rest of South America Water Features Volume (K) Forecast, by Application 2020 & 2033
- Table 31: Global Water Features Revenue million Forecast, by Application 2020 & 2033
- Table 32: Global Water Features Volume K Forecast, by Application 2020 & 2033
- Table 33: Global Water Features Revenue million Forecast, by Types 2020 & 2033
- Table 34: Global Water Features Volume K Forecast, by Types 2020 & 2033
- Table 35: Global Water Features Revenue million Forecast, by Country 2020 & 2033
- Table 36: Global Water Features Volume K Forecast, by Country 2020 & 2033
- Table 37: United Kingdom Water Features Revenue (million) Forecast, by Application 2020 & 2033
- Table 38: United Kingdom Water Features Volume (K) Forecast, by Application 2020 & 2033
- Table 39: Germany Water Features Revenue (million) Forecast, by Application 2020 & 2033
- Table 40: Germany Water Features Volume (K) Forecast, by Application 2020 & 2033
- Table 41: France Water Features Revenue (million) Forecast, by Application 2020 & 2033
- Table 42: France Water Features Volume (K) Forecast, by Application 2020 & 2033
- Table 43: Italy Water Features Revenue (million) Forecast, by Application 2020 & 2033
- Table 44: Italy Water Features Volume (K) Forecast, by Application 2020 & 2033
- Table 45: Spain Water Features Revenue (million) Forecast, by Application 2020 & 2033
- Table 46: Spain Water Features Volume (K) Forecast, by Application 2020 & 2033
- Table 47: Russia Water Features Revenue (million) Forecast, by Application 2020 & 2033
- Table 48: Russia Water Features Volume (K) Forecast, by Application 2020 & 2033
- Table 49: Benelux Water Features Revenue (million) Forecast, by Application 2020 & 2033
- Table 50: Benelux Water Features Volume (K) Forecast, by Application 2020 & 2033
- Table 51: Nordics Water Features Revenue (million) Forecast, by Application 2020 & 2033
- Table 52: Nordics Water Features Volume (K) Forecast, by Application 2020 & 2033
- Table 53: Rest of Europe Water Features Revenue (million) Forecast, by Application 2020 & 2033
- Table 54: Rest of Europe Water Features Volume (K) Forecast, by Application 2020 & 2033
- Table 55: Global Water Features Revenue million Forecast, by Application 2020 & 2033
- Table 56: Global Water Features Volume K Forecast, by Application 2020 & 2033
- Table 57: Global Water Features Revenue million Forecast, by Types 2020 & 2033
- Table 58: Global Water Features Volume K Forecast, by Types 2020 & 2033
- Table 59: Global Water Features Revenue million Forecast, by Country 2020 & 2033
- Table 60: Global Water Features Volume K Forecast, by Country 2020 & 2033
- Table 61: Turkey Water Features Revenue (million) Forecast, by Application 2020 & 2033
- Table 62: Turkey Water Features Volume (K) Forecast, by Application 2020 & 2033
- Table 63: Israel Water Features Revenue (million) Forecast, by Application 2020 & 2033
- Table 64: Israel Water Features Volume (K) Forecast, by Application 2020 & 2033
- Table 65: GCC Water Features Revenue (million) Forecast, by Application 2020 & 2033
- Table 66: GCC Water Features Volume (K) Forecast, by Application 2020 & 2033
- Table 67: North Africa Water Features Revenue (million) Forecast, by Application 2020 & 2033
- Table 68: North Africa Water Features Volume (K) Forecast, by Application 2020 & 2033
- Table 69: South Africa Water Features Revenue (million) Forecast, by Application 2020 & 2033
- Table 70: South Africa Water Features Volume (K) Forecast, by Application 2020 & 2033
- Table 71: Rest of Middle East & Africa Water Features Revenue (million) Forecast, by Application 2020 & 2033
- Table 72: Rest of Middle East & Africa Water Features Volume (K) Forecast, by Application 2020 & 2033
- Table 73: Global Water Features Revenue million Forecast, by Application 2020 & 2033
- Table 74: Global Water Features Volume K Forecast, by Application 2020 & 2033
- Table 75: Global Water Features Revenue million Forecast, by Types 2020 & 2033
- Table 76: Global Water Features Volume K Forecast, by Types 2020 & 2033
- Table 77: Global Water Features Revenue million Forecast, by Country 2020 & 2033
- Table 78: Global Water Features Volume K Forecast, by Country 2020 & 2033
- Table 79: China Water Features Revenue (million) Forecast, by Application 2020 & 2033
- Table 80: China Water Features Volume (K) Forecast, by Application 2020 & 2033
- Table 81: India Water Features Revenue (million) Forecast, by Application 2020 & 2033
- Table 82: India Water Features Volume (K) Forecast, by Application 2020 & 2033
- Table 83: Japan Water Features Revenue (million) Forecast, by Application 2020 & 2033
- Table 84: Japan Water Features Volume (K) Forecast, by Application 2020 & 2033
- Table 85: South Korea Water Features Revenue (million) Forecast, by Application 2020 & 2033
- Table 86: South Korea Water Features Volume (K) Forecast, by Application 2020 & 2033
- Table 87: ASEAN Water Features Revenue (million) Forecast, by Application 2020 & 2033
- Table 88: ASEAN Water Features Volume (K) Forecast, by Application 2020 & 2033
- Table 89: Oceania Water Features Revenue (million) Forecast, by Application 2020 & 2033
- Table 90: Oceania Water Features Volume (K) Forecast, by Application 2020 & 2033
- Table 91: Rest of Asia Pacific Water Features Revenue (million) Forecast, by Application 2020 & 2033
- Table 92: Rest of Asia Pacific Water Features Volume (K) Forecast, by Application 2020 & 2033
Frequently Asked Questions
1. What is the projected Compound Annual Growth Rate (CAGR) of the Water Features?
The projected CAGR is approximately 6%.
2. Which companies are prominent players in the Water Features?
Key companies in the market include OASE Living Water, Fountain People, Lumiartecnia Internacional, Vertex, Suzhou Gold Ocean, Otterbine, Safe-Rain, Delta Fountains, Aqua Control, Fontana Fountains, Yixing Sea Fountain Equipment, Kasco Marine, Hall Fountains, Eagle Fountains, AquaTec Fountains, Adagio Water Features, Formedacqua.
3. What are the main segments of the Water Features?
The market segments include Application, Types.
4. Can you provide details about the market size?
The market size is estimated to be USD 2247.42 million as of 2022.
5. What are some drivers contributing to market growth?
N/A
6. What are the notable trends driving market growth?
N/A
7. Are there any restraints impacting market growth?
N/A
8. Can you provide examples of recent developments in the market?
N/A
9. What pricing options are available for accessing the report?
Pricing options include single-user, multi-user, and enterprise licenses priced at USD 3350.00, USD 5025.00, and USD 6700.00 respectively.
10. Is the market size provided in terms of value or volume?
The market size is provided in terms of value, measured in million and volume, measured in K.
11. Are there any specific market keywords associated with the report?
Yes, the market keyword associated with the report is "Water Features," which aids in identifying and referencing the specific market segment covered.
12. How do I determine which pricing option suits my needs best?
The pricing options vary based on user requirements and access needs. Individual users may opt for single-user licenses, while businesses requiring broader access may choose multi-user or enterprise licenses for cost-effective access to the report.
13. Are there any additional resources or data provided in the Water Features report?
While the report offers comprehensive insights, it's advisable to review the specific contents or supplementary materials provided to ascertain if additional resources or data are available.
14. How can I stay updated on further developments or reports in the Water Features?
To stay informed about further developments, trends, and reports in the Water Features, consider subscribing to industry newsletters, following relevant companies and organizations, or regularly checking reputable industry news sources and publications.
Methodology
Step 1 - Identification of Relevant Samples Size from Population Database


Step 2 - Approaches for Defining Global Market Size (Value, Volume* & Price*)

Note*: In applicable scenarios
Step 3 - Data Sources
Primary Research
- Web Analytics
- Survey Reports
- Research Institute
- Latest Research Reports
- Opinion Leaders
Secondary Research
- Annual Reports
- White Paper
- Latest Press Release
- Industry Association
- Paid Database
- Investor Presentations

Step 4 - Data Triangulation
Involves using different sources of information in order to increase the validity of a study
These sources are likely to be stakeholders in a program - participants, other researchers, program staff, other community members, and so on.
Then we put all data in single framework & apply various statistical tools to find out the dynamic on the market.
During the analysis stage, feedback from the stakeholder groups would be compared to determine areas of agreement as well as areas of divergence