

Key Insights
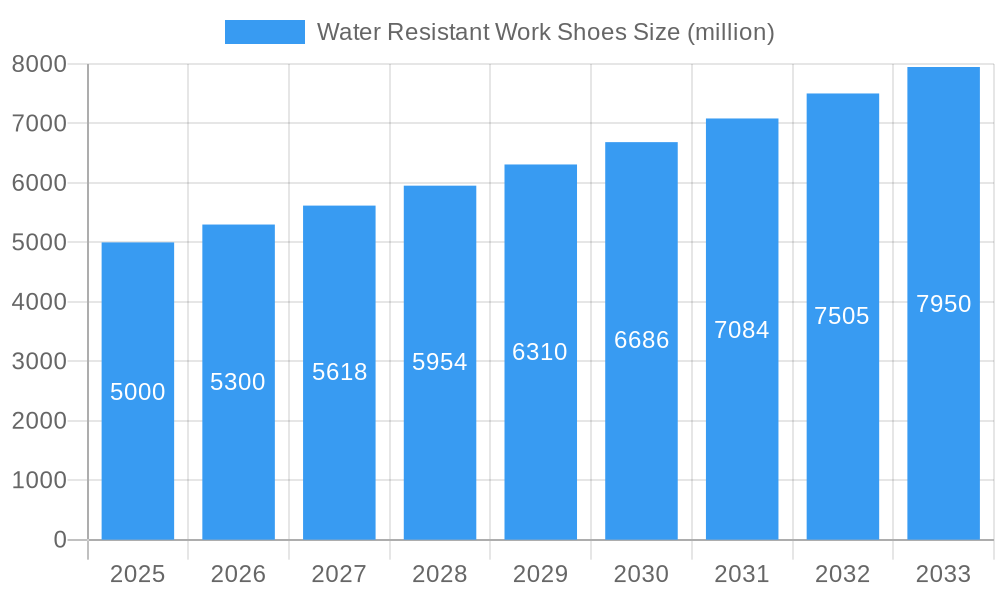
The global market for water-resistant work shoes is experiencing robust growth, driven by increasing demand across various industries. The construction, manufacturing, and healthcare sectors, among others, rely heavily on footwear that provides protection from water damage and hazardous conditions. This demand is further fueled by rising awareness of workplace safety regulations and the increasing prevalence of occupational injuries related to wet or damp environments. Technological advancements in materials science are leading to the development of lighter, more comfortable, and more durable water-resistant work shoes, enhancing worker productivity and satisfaction. Furthermore, the market is witnessing a shift towards specialized footwear designed for specific occupational needs, such as those catering to electricians, firefighters, or those working in cold climates. This segmentation is driving innovation and catering to niche requirements, further stimulating market expansion. We estimate the market size in 2025 to be approximately $5 billion, growing at a Compound Annual Growth Rate (CAGR) of 6% from 2025-2033. This projection incorporates factors such as consistent demand from existing industries and anticipated expansion into new sectors as well as ongoing product innovation and advancements in manufacturing technology.
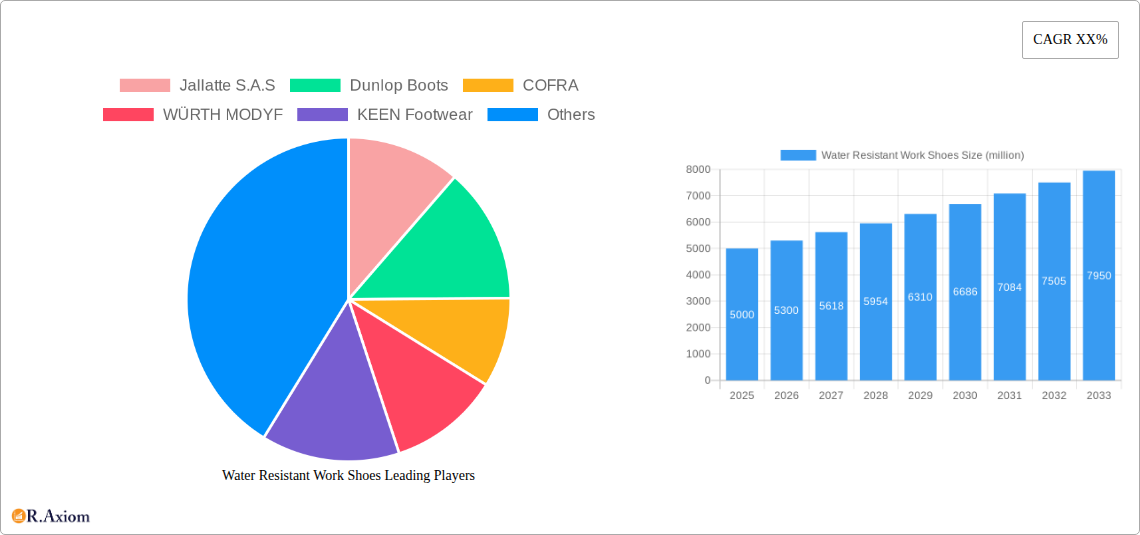
Water Resistant Work Shoes Market Size (In Billion)
Several factors are contributing to the sustained growth of the water-resistant work shoe market. These include stringent workplace safety regulations mandating protective footwear, a growing awareness of the importance of worker well-being, and rising disposable incomes in developing economies. However, challenges remain, such as the fluctuating prices of raw materials and potential disruptions to supply chains. Despite these, the long-term outlook for the market remains positive, driven by continued innovation and increasing demand for high-performance, comfortable, and durable water-resistant work shoes. The leading players, including Jallatte S.A.S, Dunlop Boots, and COFRA, are strategically investing in research and development to enhance product features and expand their market share. The focus on sustainability and environmentally friendly materials is also emerging as a key trend, shaping future market developments.
Water Resistant Work Shoes Company Market Share
This comprehensive report provides a detailed analysis of the global water resistant work shoes market, offering invaluable insights for manufacturers, distributors, investors, and industry stakeholders. The study covers the period 2019-2033, with a focus on the forecast period 2025-2033, using 2025 as the base and estimated year. The report leverages extensive data analysis to forecast a market valued at $XX million by 2033, illuminating key growth drivers, challenges, and opportunities within this crucial sector.
Water Resistant Work Shoes Market Concentration & Innovation
The global water resistant work shoes market exhibits a moderately concentrated landscape, with several major players commanding significant market share. Jallatte S.A.S, Dunlop Boots, COFRA, and KEEN Footwear are among the leading companies, each holding an estimated market share of between 5% and 15% in 2025 (exact figures are detailed in the full report). Smaller players, such as Rahman Group and Rock Fall, contribute to the overall market dynamism. Innovation in this sector is driven by advancements in materials science (e.g., lighter, more durable, and breathable waterproof materials), improved ergonomic designs, and the incorporation of smart technologies. Regulatory frameworks focusing on worker safety and environmental sustainability are increasingly influencing product development. Substitutes, such as traditional rubber boots, are gradually losing market share due to the superior comfort and protection offered by modern water-resistant work shoes. The increasing demand for enhanced safety features across various industries is a key end-user trend. Recent M&A activities within the sector have involved smaller companies being acquired by larger players to expand product portfolios and market reach, with estimated deal values ranging from $XX million to $XX million in recent years.
- Market Concentration: Moderately concentrated, with a few dominant players.
- Innovation Drivers: Advancements in materials, ergonomic design, smart technology integration.
- Regulatory Influence: Growing emphasis on worker safety and environmental standards.
- Product Substitutes: Traditional rubber boots facing declining market share.
- End-User Trends: Increased demand for enhanced safety and comfort features.
- M&A Activity: Several acquisitions in recent years, valued at $XX million to $XX million.
Water Resistant Work Shoes Industry Trends & Insights
The water resistant work shoes market is experiencing robust growth, projected to achieve a compound annual growth rate (CAGR) of XX% during the forecast period (2025-2033). This growth is fueled by several key factors. Firstly, the rising awareness of occupational health and safety is pushing for better protective footwear, thereby increasing the adoption of water-resistant work shoes across diverse industries like construction, manufacturing, and healthcare. Secondly, technological advancements in materials science continue to provide lighter, more durable, and comfortable alternatives to traditional safety footwear. Consumer preferences are shifting towards products that offer superior comfort, breathability, and flexibility without compromising safety. Intense competition among established and emerging players is leading to continuous product innovation, improved quality, and more competitive pricing. Market penetration is steadily increasing across various geographic regions, driven by factors such as economic growth and improving infrastructure. The increasing adoption of e-commerce platforms is also creating new opportunities for reaching a wider consumer base.
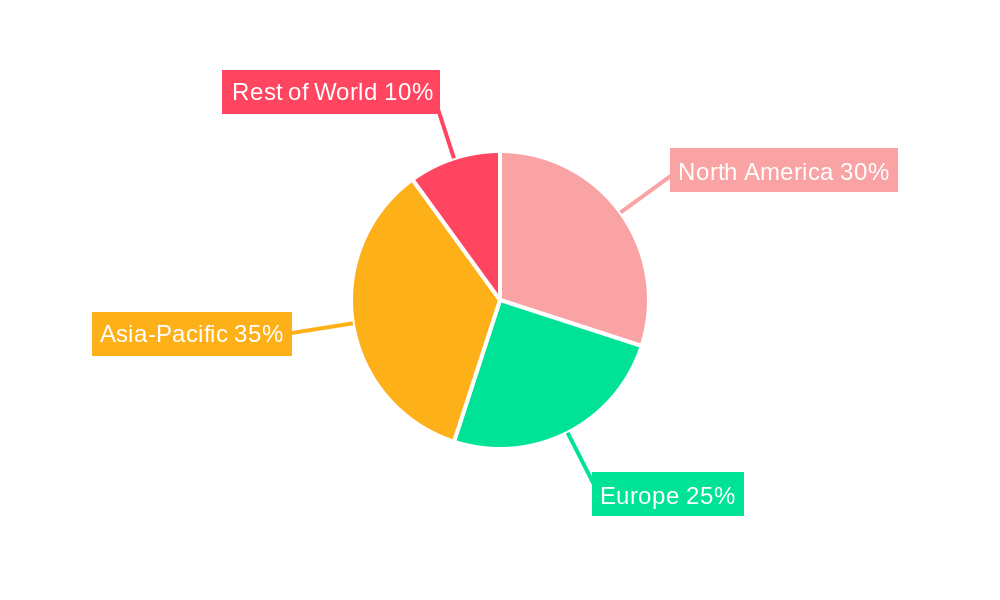
Dominant Markets & Segments in Water Resistant Work Shoes
The North American region currently holds the largest market share in water resistant work shoes, driven by strong construction and manufacturing industries. However, Asia-Pacific is expected to witness the fastest growth during the forecast period, fueled by rapid industrialization, infrastructure development, and a growing middle class.
- North America: Dominates market share, driven by robust construction and manufacturing sectors.
- Asia-Pacific: Fastest-growing region, driven by rapid industrialization and infrastructure development.
- Europe: Significant market presence, influenced by strong safety regulations and established industries.
- Key Drivers: Economic growth, infrastructure development, robust safety regulations, and increasing awareness of occupational health and safety.
This dominance is largely attributed to: *Strong economic growth and robust industrial activity. *Significant investments in infrastructure projects. *Stringent government regulations concerning workplace safety. *A growing awareness among workers regarding the importance of protective footwear.
Water Resistant Work Shoes Product Developments
Recent product innovations have focused on enhancing comfort, durability, and safety features. Lightweight materials, advanced waterproofing technologies, and ergonomic designs are key trends. Water-resistant work shoes are increasingly incorporating features like puncture-resistant soles, metatarsal guards, and improved ankle support to meet the diverse needs of various industries. The integration of smart technologies, such as sensors for tracking worker activity, is also gaining traction, offering unique competitive advantages.
Report Scope & Segmentation Analysis
The report segments the water resistant work shoes market by product type (e.g., boots, shoes), end-use industry (e.g., construction, manufacturing, healthcare), and region. Each segment's growth projection, market size, and competitive landscape are meticulously analyzed. The market is expected to grow significantly across all segments. The specific growth figures vary for each segment based on the unique dynamics, trends, and factors of influence for each segment. The competitive dynamics within each segment are influenced by factors such as product innovation, pricing strategies, brand reputation, and distribution channels.
Key Drivers of Water Resistant Work Shoes Growth
Several factors are driving the growth of the water resistant work shoes market. The stringent safety regulations enforced across many countries mandate the use of protective footwear in various industries, boosting demand. Furthermore, the rising awareness of occupational hazards and the consequent focus on worker safety are pivotal drivers. Economic growth, particularly in emerging economies, fuels infrastructure development and industrial expansion, driving demand for water resistant work shoes. Technological advancements in material science and manufacturing techniques have led to the development of more comfortable, durable, and stylish products.
Challenges in the Water Resistant Work Shoes Sector
The water resistant work shoes sector faces several challenges. Fluctuations in raw material prices impact production costs and profitability. Supply chain disruptions caused by geopolitical events can affect product availability. Intense competition among numerous players requires continuous innovation and cost optimization. Stringent regulatory requirements can increase compliance costs and pose hurdles for smaller players. The overall impact of these challenges is a projected XX% reduction in profit margins by 2033.
Emerging Opportunities in Water Resistant Work Shoes
Emerging trends such as the increasing adoption of sustainable and eco-friendly materials present significant opportunities. The integration of smart technologies offers avenues for improved safety and worker monitoring. Expansion into new and developing markets with growing industrial sectors holds vast potential. Catering to specific niche markets with tailored products could yield significant returns. These opportunities have the potential to increase market value by $XX million by 2033.
Leading Players in the Water Resistant Work Shoes Market
- Jallatte S.A.S
- Dunlop Boots
- COFRA
- WÜRTH MODYF
- KEEN Footwear
- Rahman Group
- Rock Fall
- CLUTE S.A
- V.F.
- Gearcor
- Bova Safety Footwear
- Gabri Safety Shoes
- Simon
- Anbu Safety Industrial
- CANIS SAFETY
- Walker Footwear Industries
- Bata Industrials
Key Developments in Water Resistant Work Shoes Industry
- 2022 Q4: Jallatte S.A.S launched a new line of water-resistant work shoes featuring enhanced puncture resistance.
- 2023 Q1: COFRA announced a strategic partnership with a leading material supplier to improve product durability.
- 2023 Q2: Dunlop Boots acquired a smaller competitor, expanding its market share. (Further details on other key developments are provided in the full report)
Strategic Outlook for Water Resistant Work Shoes Market
The water resistant work shoes market is poised for continued growth driven by increasing demand for safety and comfort, technological innovation, and expansion into new markets. Strategic opportunities include focusing on sustainable materials, developing specialized products for niche industries, and leveraging digital marketing to reach a wider audience. Companies that invest in research and development, adapt to evolving consumer preferences, and effectively manage supply chain risks are expected to thrive in this dynamic market. The potential for growth remains significant throughout the forecast period, paving the way for continued industry evolution and expansion.
Water Resistant Work Shoes Segmentation
-
1. Application
- 1.1. Oil & Gas
- 1.2. Manufacturing
- 1.3. Chemicals
- 1.4. Mining
- 1.5. Others
-
2. Types
- 2.1. Men's Work Shoes
- 2.2. Women's Work Shoes
Water Resistant Work Shoes Segmentation By Geography
-
1. North America
- 1.1. United States
- 1.2. Canada
- 1.3. Mexico
-
2. South America
- 2.1. Brazil
- 2.2. Argentina
- 2.3. Rest of South America
-
3. Europe
- 3.1. United Kingdom
- 3.2. Germany
- 3.3. France
- 3.4. Italy
- 3.5. Spain
- 3.6. Russia
- 3.7. Benelux
- 3.8. Nordics
- 3.9. Rest of Europe
-
4. Middle East & Africa
- 4.1. Turkey
- 4.2. Israel
- 4.3. GCC
- 4.4. North Africa
- 4.5. South Africa
- 4.6. Rest of Middle East & Africa
-
5. Asia Pacific
- 5.1. China
- 5.2. India
- 5.3. Japan
- 5.4. South Korea
- 5.5. ASEAN
- 5.6. Oceania
- 5.7. Rest of Asia Pacific
Water Resistant Work Shoes Regional Market Share
Geographic Coverage of Water Resistant Work Shoes
Water Resistant Work Shoes REPORT HIGHLIGHTS
| Aspects | Details |
|---|---|
| Study Period | 2020-2034 |
| Base Year | 2025 |
| Estimated Year | 2026 |
| Forecast Period | 2026-2034 |
| Historical Period | 2020-2025 |
| Growth Rate | CAGR of 4.3% from 2020-2034 |
| Segmentation |
|
Table of Contents
- 1. Introduction
- 1.1. Research Scope
- 1.2. Market Segmentation
- 1.3. Research Objective
- 1.4. Definitions and Assumptions
- 2. Executive Summary
- 2.1. Market Snapshot
- 3. Market Dynamics
- 3.1. Market Drivers
- 3.2. Market Restrains
- 3.3. Market Trends
- 3.4. Market Opportunities
- 4. Market Factor Analysis
- 4.1. Porters Five Forces
- 4.1.1. Bargaining Power of Suppliers
- 4.1.2. Bargaining Power of Buyers
- 4.1.3. Threat of New Entrants
- 4.1.4. Threat of Substitutes
- 4.1.5. Competitive Rivalry
- 4.2. PESTEL analysis
- 4.3. BCG Analysis
- 4.3.1. Stars (High Growth, High Market Share)
- 4.3.2. Cash Cows (Low Growth, High Market Share)
- 4.3.3. Question Mark (High Growth, Low Market Share)
- 4.3.4. Dogs (Low Growth, Low Market Share)
- 4.4. Ansoff Matrix Analysis
- 4.5. Supply Chain Analysis
- 4.6. Regulatory Landscape
- 4.7. Current Market Potential and Opportunity Assessment (TAM–SAM–SOM Framework)
- 4.8. RAX Analyst Note
- 4.1. Porters Five Forces
- 5. Market Analysis, Insights and Forecast 2021-2033
- 5.1. Market Analysis, Insights and Forecast - by Application
- 5.1.1. Oil & Gas
- 5.1.2. Manufacturing
- 5.1.3. Chemicals
- 5.1.4. Mining
- 5.1.5. Others
- 5.2. Market Analysis, Insights and Forecast - by Types
- 5.2.1. Men's Work Shoes
- 5.2.2. Women's Work Shoes
- 5.3. Market Analysis, Insights and Forecast - by Region
- 5.3.1. North America
- 5.3.2. South America
- 5.3.3. Europe
- 5.3.4. Middle East & Africa
- 5.3.5. Asia Pacific
- 5.1. Market Analysis, Insights and Forecast - by Application
- 6. Global Water Resistant Work Shoes Analysis, Insights and Forecast, 2021-2033
- 6.1. Market Analysis, Insights and Forecast - by Application
- 6.1.1. Oil & Gas
- 6.1.2. Manufacturing
- 6.1.3. Chemicals
- 6.1.4. Mining
- 6.1.5. Others
- 6.2. Market Analysis, Insights and Forecast - by Types
- 6.2.1. Men's Work Shoes
- 6.2.2. Women's Work Shoes
- 6.1. Market Analysis, Insights and Forecast - by Application
- 7. North America Water Resistant Work Shoes Analysis, Insights and Forecast, 2020-2032
- 7.1. Market Analysis, Insights and Forecast - by Application
- 7.1.1. Oil & Gas
- 7.1.2. Manufacturing
- 7.1.3. Chemicals
- 7.1.4. Mining
- 7.1.5. Others
- 7.2. Market Analysis, Insights and Forecast - by Types
- 7.2.1. Men's Work Shoes
- 7.2.2. Women's Work Shoes
- 7.1. Market Analysis, Insights and Forecast - by Application
- 8. South America Water Resistant Work Shoes Analysis, Insights and Forecast, 2020-2032
- 8.1. Market Analysis, Insights and Forecast - by Application
- 8.1.1. Oil & Gas
- 8.1.2. Manufacturing
- 8.1.3. Chemicals
- 8.1.4. Mining
- 8.1.5. Others
- 8.2. Market Analysis, Insights and Forecast - by Types
- 8.2.1. Men's Work Shoes
- 8.2.2. Women's Work Shoes
- 8.1. Market Analysis, Insights and Forecast - by Application
- 9. Europe Water Resistant Work Shoes Analysis, Insights and Forecast, 2020-2032
- 9.1. Market Analysis, Insights and Forecast - by Application
- 9.1.1. Oil & Gas
- 9.1.2. Manufacturing
- 9.1.3. Chemicals
- 9.1.4. Mining
- 9.1.5. Others
- 9.2. Market Analysis, Insights and Forecast - by Types
- 9.2.1. Men's Work Shoes
- 9.2.2. Women's Work Shoes
- 9.1. Market Analysis, Insights and Forecast - by Application
- 10. Middle East & Africa Water Resistant Work Shoes Analysis, Insights and Forecast, 2020-2032
- 10.1. Market Analysis, Insights and Forecast - by Application
- 10.1.1. Oil & Gas
- 10.1.2. Manufacturing
- 10.1.3. Chemicals
- 10.1.4. Mining
- 10.1.5. Others
- 10.2. Market Analysis, Insights and Forecast - by Types
- 10.2.1. Men's Work Shoes
- 10.2.2. Women's Work Shoes
- 10.1. Market Analysis, Insights and Forecast - by Application
- 11. Asia Pacific Water Resistant Work Shoes Analysis, Insights and Forecast, 2020-2032
- 11.1. Market Analysis, Insights and Forecast - by Application
- 11.1.1. Oil & Gas
- 11.1.2. Manufacturing
- 11.1.3. Chemicals
- 11.1.4. Mining
- 11.1.5. Others
- 11.2. Market Analysis, Insights and Forecast - by Types
- 11.2.1. Men's Work Shoes
- 11.2.2. Women's Work Shoes
- 11.1. Market Analysis, Insights and Forecast - by Application
- 12. Competitive Analysis
- 12.1. Company Profiles
- 12.1.1 Jallatte S.A.S
- 12.1.1.1. Company Overview
- 12.1.1.2. Products
- 12.1.1.3. Company Financials
- 12.1.1.4. SWOT Analysis
- 12.1.2 Dunlop Boots
- 12.1.2.1. Company Overview
- 12.1.2.2. Products
- 12.1.2.3. Company Financials
- 12.1.2.4. SWOT Analysis
- 12.1.3 COFRA
- 12.1.3.1. Company Overview
- 12.1.3.2. Products
- 12.1.3.3. Company Financials
- 12.1.3.4. SWOT Analysis
- 12.1.4 WÜRTH MODYF
- 12.1.4.1. Company Overview
- 12.1.4.2. Products
- 12.1.4.3. Company Financials
- 12.1.4.4. SWOT Analysis
- 12.1.5 KEEN Footwear
- 12.1.5.1. Company Overview
- 12.1.5.2. Products
- 12.1.5.3. Company Financials
- 12.1.5.4. SWOT Analysis
- 12.1.6 Rahman Group
- 12.1.6.1. Company Overview
- 12.1.6.2. Products
- 12.1.6.3. Company Financials
- 12.1.6.4. SWOT Analysis
- 12.1.7 Rock Fall
- 12.1.7.1. Company Overview
- 12.1.7.2. Products
- 12.1.7.3. Company Financials
- 12.1.7.4. SWOT Analysis
- 12.1.8 CLUTE S.A
- 12.1.8.1. Company Overview
- 12.1.8.2. Products
- 12.1.8.3. Company Financials
- 12.1.8.4. SWOT Analysis
- 12.1.9 V.F.
- 12.1.9.1. Company Overview
- 12.1.9.2. Products
- 12.1.9.3. Company Financials
- 12.1.9.4. SWOT Analysis
- 12.1.10 Gearcor
- 12.1.10.1. Company Overview
- 12.1.10.2. Products
- 12.1.10.3. Company Financials
- 12.1.10.4. SWOT Analysis
- 12.1.11 Bova Safety Footwear
- 12.1.11.1. Company Overview
- 12.1.11.2. Products
- 12.1.11.3. Company Financials
- 12.1.11.4. SWOT Analysis
- 12.1.12 Gabri Safety Shoes
- 12.1.12.1. Company Overview
- 12.1.12.2. Products
- 12.1.12.3. Company Financials
- 12.1.12.4. SWOT Analysis
- 12.1.13 Simon
- 12.1.13.1. Company Overview
- 12.1.13.2. Products
- 12.1.13.3. Company Financials
- 12.1.13.4. SWOT Analysis
- 12.1.14 Anbu Safety Industrial
- 12.1.14.1. Company Overview
- 12.1.14.2. Products
- 12.1.14.3. Company Financials
- 12.1.14.4. SWOT Analysis
- 12.1.15 CANIS SAFETY
- 12.1.15.1. Company Overview
- 12.1.15.2. Products
- 12.1.15.3. Company Financials
- 12.1.15.4. SWOT Analysis
- 12.1.16 Walker Footwear Industries
- 12.1.16.1. Company Overview
- 12.1.16.2. Products
- 12.1.16.3. Company Financials
- 12.1.16.4. SWOT Analysis
- 12.1.17 Bata Industrials
- 12.1.17.1. Company Overview
- 12.1.17.2. Products
- 12.1.17.3. Company Financials
- 12.1.17.4. SWOT Analysis
- 12.1.1 Jallatte S.A.S
- 12.2. Market Entropy
- 12.2.1 Company's Key Areas Served
- 12.2.2 Recent Developments
- 12.3. Company Market Share Analysis 2025
- 12.3.1 Top 5 Companies Market Share Analysis
- 12.3.2 Top 3 Companies Market Share Analysis
- 12.4. List of Potential Customers
- 13. Research Methodology
List of Figures
- Figure 1: Global Water Resistant Work Shoes Revenue Breakdown (undefined, %) by Region 2025 & 2033
- Figure 2: Global Water Resistant Work Shoes Volume Breakdown (K, %) by Region 2025 & 2033
- Figure 3: North America Water Resistant Work Shoes Revenue (undefined), by Application 2025 & 2033
- Figure 4: North America Water Resistant Work Shoes Volume (K), by Application 2025 & 2033
- Figure 5: North America Water Resistant Work Shoes Revenue Share (%), by Application 2025 & 2033
- Figure 6: North America Water Resistant Work Shoes Volume Share (%), by Application 2025 & 2033
- Figure 7: North America Water Resistant Work Shoes Revenue (undefined), by Types 2025 & 2033
- Figure 8: North America Water Resistant Work Shoes Volume (K), by Types 2025 & 2033
- Figure 9: North America Water Resistant Work Shoes Revenue Share (%), by Types 2025 & 2033
- Figure 10: North America Water Resistant Work Shoes Volume Share (%), by Types 2025 & 2033
- Figure 11: North America Water Resistant Work Shoes Revenue (undefined), by Country 2025 & 2033
- Figure 12: North America Water Resistant Work Shoes Volume (K), by Country 2025 & 2033
- Figure 13: North America Water Resistant Work Shoes Revenue Share (%), by Country 2025 & 2033
- Figure 14: North America Water Resistant Work Shoes Volume Share (%), by Country 2025 & 2033
- Figure 15: South America Water Resistant Work Shoes Revenue (undefined), by Application 2025 & 2033
- Figure 16: South America Water Resistant Work Shoes Volume (K), by Application 2025 & 2033
- Figure 17: South America Water Resistant Work Shoes Revenue Share (%), by Application 2025 & 2033
- Figure 18: South America Water Resistant Work Shoes Volume Share (%), by Application 2025 & 2033
- Figure 19: South America Water Resistant Work Shoes Revenue (undefined), by Types 2025 & 2033
- Figure 20: South America Water Resistant Work Shoes Volume (K), by Types 2025 & 2033
- Figure 21: South America Water Resistant Work Shoes Revenue Share (%), by Types 2025 & 2033
- Figure 22: South America Water Resistant Work Shoes Volume Share (%), by Types 2025 & 2033
- Figure 23: South America Water Resistant Work Shoes Revenue (undefined), by Country 2025 & 2033
- Figure 24: South America Water Resistant Work Shoes Volume (K), by Country 2025 & 2033
- Figure 25: South America Water Resistant Work Shoes Revenue Share (%), by Country 2025 & 2033
- Figure 26: South America Water Resistant Work Shoes Volume Share (%), by Country 2025 & 2033
- Figure 27: Europe Water Resistant Work Shoes Revenue (undefined), by Application 2025 & 2033
- Figure 28: Europe Water Resistant Work Shoes Volume (K), by Application 2025 & 2033
- Figure 29: Europe Water Resistant Work Shoes Revenue Share (%), by Application 2025 & 2033
- Figure 30: Europe Water Resistant Work Shoes Volume Share (%), by Application 2025 & 2033
- Figure 31: Europe Water Resistant Work Shoes Revenue (undefined), by Types 2025 & 2033
- Figure 32: Europe Water Resistant Work Shoes Volume (K), by Types 2025 & 2033
- Figure 33: Europe Water Resistant Work Shoes Revenue Share (%), by Types 2025 & 2033
- Figure 34: Europe Water Resistant Work Shoes Volume Share (%), by Types 2025 & 2033
- Figure 35: Europe Water Resistant Work Shoes Revenue (undefined), by Country 2025 & 2033
- Figure 36: Europe Water Resistant Work Shoes Volume (K), by Country 2025 & 2033
- Figure 37: Europe Water Resistant Work Shoes Revenue Share (%), by Country 2025 & 2033
- Figure 38: Europe Water Resistant Work Shoes Volume Share (%), by Country 2025 & 2033
- Figure 39: Middle East & Africa Water Resistant Work Shoes Revenue (undefined), by Application 2025 & 2033
- Figure 40: Middle East & Africa Water Resistant Work Shoes Volume (K), by Application 2025 & 2033
- Figure 41: Middle East & Africa Water Resistant Work Shoes Revenue Share (%), by Application 2025 & 2033
- Figure 42: Middle East & Africa Water Resistant Work Shoes Volume Share (%), by Application 2025 & 2033
- Figure 43: Middle East & Africa Water Resistant Work Shoes Revenue (undefined), by Types 2025 & 2033
- Figure 44: Middle East & Africa Water Resistant Work Shoes Volume (K), by Types 2025 & 2033
- Figure 45: Middle East & Africa Water Resistant Work Shoes Revenue Share (%), by Types 2025 & 2033
- Figure 46: Middle East & Africa Water Resistant Work Shoes Volume Share (%), by Types 2025 & 2033
- Figure 47: Middle East & Africa Water Resistant Work Shoes Revenue (undefined), by Country 2025 & 2033
- Figure 48: Middle East & Africa Water Resistant Work Shoes Volume (K), by Country 2025 & 2033
- Figure 49: Middle East & Africa Water Resistant Work Shoes Revenue Share (%), by Country 2025 & 2033
- Figure 50: Middle East & Africa Water Resistant Work Shoes Volume Share (%), by Country 2025 & 2033
- Figure 51: Asia Pacific Water Resistant Work Shoes Revenue (undefined), by Application 2025 & 2033
- Figure 52: Asia Pacific Water Resistant Work Shoes Volume (K), by Application 2025 & 2033
- Figure 53: Asia Pacific Water Resistant Work Shoes Revenue Share (%), by Application 2025 & 2033
- Figure 54: Asia Pacific Water Resistant Work Shoes Volume Share (%), by Application 2025 & 2033
- Figure 55: Asia Pacific Water Resistant Work Shoes Revenue (undefined), by Types 2025 & 2033
- Figure 56: Asia Pacific Water Resistant Work Shoes Volume (K), by Types 2025 & 2033
- Figure 57: Asia Pacific Water Resistant Work Shoes Revenue Share (%), by Types 2025 & 2033
- Figure 58: Asia Pacific Water Resistant Work Shoes Volume Share (%), by Types 2025 & 2033
- Figure 59: Asia Pacific Water Resistant Work Shoes Revenue (undefined), by Country 2025 & 2033
- Figure 60: Asia Pacific Water Resistant Work Shoes Volume (K), by Country 2025 & 2033
- Figure 61: Asia Pacific Water Resistant Work Shoes Revenue Share (%), by Country 2025 & 2033
- Figure 62: Asia Pacific Water Resistant Work Shoes Volume Share (%), by Country 2025 & 2033
List of Tables
- Table 1: Global Water Resistant Work Shoes Revenue undefined Forecast, by Application 2020 & 2033
- Table 2: Global Water Resistant Work Shoes Volume K Forecast, by Application 2020 & 2033
- Table 3: Global Water Resistant Work Shoes Revenue undefined Forecast, by Types 2020 & 2033
- Table 4: Global Water Resistant Work Shoes Volume K Forecast, by Types 2020 & 2033
- Table 5: Global Water Resistant Work Shoes Revenue undefined Forecast, by Region 2020 & 2033
- Table 6: Global Water Resistant Work Shoes Volume K Forecast, by Region 2020 & 2033
- Table 7: Global Water Resistant Work Shoes Revenue undefined Forecast, by Application 2020 & 2033
- Table 8: Global Water Resistant Work Shoes Volume K Forecast, by Application 2020 & 2033
- Table 9: Global Water Resistant Work Shoes Revenue undefined Forecast, by Types 2020 & 2033
- Table 10: Global Water Resistant Work Shoes Volume K Forecast, by Types 2020 & 2033
- Table 11: Global Water Resistant Work Shoes Revenue undefined Forecast, by Country 2020 & 2033
- Table 12: Global Water Resistant Work Shoes Volume K Forecast, by Country 2020 & 2033
- Table 13: United States Water Resistant Work Shoes Revenue (undefined) Forecast, by Application 2020 & 2033
- Table 14: United States Water Resistant Work Shoes Volume (K) Forecast, by Application 2020 & 2033
- Table 15: Canada Water Resistant Work Shoes Revenue (undefined) Forecast, by Application 2020 & 2033
- Table 16: Canada Water Resistant Work Shoes Volume (K) Forecast, by Application 2020 & 2033
- Table 17: Mexico Water Resistant Work Shoes Revenue (undefined) Forecast, by Application 2020 & 2033
- Table 18: Mexico Water Resistant Work Shoes Volume (K) Forecast, by Application 2020 & 2033
- Table 19: Global Water Resistant Work Shoes Revenue undefined Forecast, by Application 2020 & 2033
- Table 20: Global Water Resistant Work Shoes Volume K Forecast, by Application 2020 & 2033
- Table 21: Global Water Resistant Work Shoes Revenue undefined Forecast, by Types 2020 & 2033
- Table 22: Global Water Resistant Work Shoes Volume K Forecast, by Types 2020 & 2033
- Table 23: Global Water Resistant Work Shoes Revenue undefined Forecast, by Country 2020 & 2033
- Table 24: Global Water Resistant Work Shoes Volume K Forecast, by Country 2020 & 2033
- Table 25: Brazil Water Resistant Work Shoes Revenue (undefined) Forecast, by Application 2020 & 2033
- Table 26: Brazil Water Resistant Work Shoes Volume (K) Forecast, by Application 2020 & 2033
- Table 27: Argentina Water Resistant Work Shoes Revenue (undefined) Forecast, by Application 2020 & 2033
- Table 28: Argentina Water Resistant Work Shoes Volume (K) Forecast, by Application 2020 & 2033
- Table 29: Rest of South America Water Resistant Work Shoes Revenue (undefined) Forecast, by Application 2020 & 2033
- Table 30: Rest of South America Water Resistant Work Shoes Volume (K) Forecast, by Application 2020 & 2033
- Table 31: Global Water Resistant Work Shoes Revenue undefined Forecast, by Application 2020 & 2033
- Table 32: Global Water Resistant Work Shoes Volume K Forecast, by Application 2020 & 2033
- Table 33: Global Water Resistant Work Shoes Revenue undefined Forecast, by Types 2020 & 2033
- Table 34: Global Water Resistant Work Shoes Volume K Forecast, by Types 2020 & 2033
- Table 35: Global Water Resistant Work Shoes Revenue undefined Forecast, by Country 2020 & 2033
- Table 36: Global Water Resistant Work Shoes Volume K Forecast, by Country 2020 & 2033
- Table 37: United Kingdom Water Resistant Work Shoes Revenue (undefined) Forecast, by Application 2020 & 2033
- Table 38: United Kingdom Water Resistant Work Shoes Volume (K) Forecast, by Application 2020 & 2033
- Table 39: Germany Water Resistant Work Shoes Revenue (undefined) Forecast, by Application 2020 & 2033
- Table 40: Germany Water Resistant Work Shoes Volume (K) Forecast, by Application 2020 & 2033
- Table 41: France Water Resistant Work Shoes Revenue (undefined) Forecast, by Application 2020 & 2033
- Table 42: France Water Resistant Work Shoes Volume (K) Forecast, by Application 2020 & 2033
- Table 43: Italy Water Resistant Work Shoes Revenue (undefined) Forecast, by Application 2020 & 2033
- Table 44: Italy Water Resistant Work Shoes Volume (K) Forecast, by Application 2020 & 2033
- Table 45: Spain Water Resistant Work Shoes Revenue (undefined) Forecast, by Application 2020 & 2033
- Table 46: Spain Water Resistant Work Shoes Volume (K) Forecast, by Application 2020 & 2033
- Table 47: Russia Water Resistant Work Shoes Revenue (undefined) Forecast, by Application 2020 & 2033
- Table 48: Russia Water Resistant Work Shoes Volume (K) Forecast, by Application 2020 & 2033
- Table 49: Benelux Water Resistant Work Shoes Revenue (undefined) Forecast, by Application 2020 & 2033
- Table 50: Benelux Water Resistant Work Shoes Volume (K) Forecast, by Application 2020 & 2033
- Table 51: Nordics Water Resistant Work Shoes Revenue (undefined) Forecast, by Application 2020 & 2033
- Table 52: Nordics Water Resistant Work Shoes Volume (K) Forecast, by Application 2020 & 2033
- Table 53: Rest of Europe Water Resistant Work Shoes Revenue (undefined) Forecast, by Application 2020 & 2033
- Table 54: Rest of Europe Water Resistant Work Shoes Volume (K) Forecast, by Application 2020 & 2033
- Table 55: Global Water Resistant Work Shoes Revenue undefined Forecast, by Application 2020 & 2033
- Table 56: Global Water Resistant Work Shoes Volume K Forecast, by Application 2020 & 2033
- Table 57: Global Water Resistant Work Shoes Revenue undefined Forecast, by Types 2020 & 2033
- Table 58: Global Water Resistant Work Shoes Volume K Forecast, by Types 2020 & 2033
- Table 59: Global Water Resistant Work Shoes Revenue undefined Forecast, by Country 2020 & 2033
- Table 60: Global Water Resistant Work Shoes Volume K Forecast, by Country 2020 & 2033
- Table 61: Turkey Water Resistant Work Shoes Revenue (undefined) Forecast, by Application 2020 & 2033
- Table 62: Turkey Water Resistant Work Shoes Volume (K) Forecast, by Application 2020 & 2033
- Table 63: Israel Water Resistant Work Shoes Revenue (undefined) Forecast, by Application 2020 & 2033
- Table 64: Israel Water Resistant Work Shoes Volume (K) Forecast, by Application 2020 & 2033
- Table 65: GCC Water Resistant Work Shoes Revenue (undefined) Forecast, by Application 2020 & 2033
- Table 66: GCC Water Resistant Work Shoes Volume (K) Forecast, by Application 2020 & 2033
- Table 67: North Africa Water Resistant Work Shoes Revenue (undefined) Forecast, by Application 2020 & 2033
- Table 68: North Africa Water Resistant Work Shoes Volume (K) Forecast, by Application 2020 & 2033
- Table 69: South Africa Water Resistant Work Shoes Revenue (undefined) Forecast, by Application 2020 & 2033
- Table 70: South Africa Water Resistant Work Shoes Volume (K) Forecast, by Application 2020 & 2033
- Table 71: Rest of Middle East & Africa Water Resistant Work Shoes Revenue (undefined) Forecast, by Application 2020 & 2033
- Table 72: Rest of Middle East & Africa Water Resistant Work Shoes Volume (K) Forecast, by Application 2020 & 2033
- Table 73: Global Water Resistant Work Shoes Revenue undefined Forecast, by Application 2020 & 2033
- Table 74: Global Water Resistant Work Shoes Volume K Forecast, by Application 2020 & 2033
- Table 75: Global Water Resistant Work Shoes Revenue undefined Forecast, by Types 2020 & 2033
- Table 76: Global Water Resistant Work Shoes Volume K Forecast, by Types 2020 & 2033
- Table 77: Global Water Resistant Work Shoes Revenue undefined Forecast, by Country 2020 & 2033
- Table 78: Global Water Resistant Work Shoes Volume K Forecast, by Country 2020 & 2033
- Table 79: China Water Resistant Work Shoes Revenue (undefined) Forecast, by Application 2020 & 2033
- Table 80: China Water Resistant Work Shoes Volume (K) Forecast, by Application 2020 & 2033
- Table 81: India Water Resistant Work Shoes Revenue (undefined) Forecast, by Application 2020 & 2033
- Table 82: India Water Resistant Work Shoes Volume (K) Forecast, by Application 2020 & 2033
- Table 83: Japan Water Resistant Work Shoes Revenue (undefined) Forecast, by Application 2020 & 2033
- Table 84: Japan Water Resistant Work Shoes Volume (K) Forecast, by Application 2020 & 2033
- Table 85: South Korea Water Resistant Work Shoes Revenue (undefined) Forecast, by Application 2020 & 2033
- Table 86: South Korea Water Resistant Work Shoes Volume (K) Forecast, by Application 2020 & 2033
- Table 87: ASEAN Water Resistant Work Shoes Revenue (undefined) Forecast, by Application 2020 & 2033
- Table 88: ASEAN Water Resistant Work Shoes Volume (K) Forecast, by Application 2020 & 2033
- Table 89: Oceania Water Resistant Work Shoes Revenue (undefined) Forecast, by Application 2020 & 2033
- Table 90: Oceania Water Resistant Work Shoes Volume (K) Forecast, by Application 2020 & 2033
- Table 91: Rest of Asia Pacific Water Resistant Work Shoes Revenue (undefined) Forecast, by Application 2020 & 2033
- Table 92: Rest of Asia Pacific Water Resistant Work Shoes Volume (K) Forecast, by Application 2020 & 2033
Frequently Asked Questions
1. What is the projected Compound Annual Growth Rate (CAGR) of the Water Resistant Work Shoes?
The projected CAGR is approximately 4.3%.
2. Which companies are prominent players in the Water Resistant Work Shoes?
Key companies in the market include Jallatte S.A.S, Dunlop Boots, COFRA, WÜRTH MODYF, KEEN Footwear, Rahman Group, Rock Fall, CLUTE S.A, V.F., Gearcor, Bova Safety Footwear, Gabri Safety Shoes, Simon, Anbu Safety Industrial, CANIS SAFETY, Walker Footwear Industries, Bata Industrials.
3. What are the main segments of the Water Resistant Work Shoes?
The market segments include Application, Types.
4. Can you provide details about the market size?
The market size is estimated to be USD XXX N/A as of 2022.
5. What are some drivers contributing to market growth?
N/A
6. What are the notable trends driving market growth?
N/A
7. Are there any restraints impacting market growth?
N/A
8. Can you provide examples of recent developments in the market?
N/A
9. What pricing options are available for accessing the report?
Pricing options include single-user, multi-user, and enterprise licenses priced at USD 3350.00, USD 5025.00, and USD 6700.00 respectively.
10. Is the market size provided in terms of value or volume?
The market size is provided in terms of value, measured in N/A and volume, measured in K.
11. Are there any specific market keywords associated with the report?
Yes, the market keyword associated with the report is "Water Resistant Work Shoes," which aids in identifying and referencing the specific market segment covered.
12. How do I determine which pricing option suits my needs best?
The pricing options vary based on user requirements and access needs. Individual users may opt for single-user licenses, while businesses requiring broader access may choose multi-user or enterprise licenses for cost-effective access to the report.
13. Are there any additional resources or data provided in the Water Resistant Work Shoes report?
While the report offers comprehensive insights, it's advisable to review the specific contents or supplementary materials provided to ascertain if additional resources or data are available.
14. How can I stay updated on further developments or reports in the Water Resistant Work Shoes?
To stay informed about further developments, trends, and reports in the Water Resistant Work Shoes, consider subscribing to industry newsletters, following relevant companies and organizations, or regularly checking reputable industry news sources and publications.
Methodology
Step 1 - Identification of Relevant Samples Size from Population Database


Step 2 - Approaches for Defining Global Market Size (Value, Volume* & Price*)

Note*: In applicable scenarios
Step 3 - Data Sources
Primary Research
- Web Analytics
- Survey Reports
- Research Institute
- Latest Research Reports
- Opinion Leaders
Secondary Research
- Annual Reports
- White Paper
- Latest Press Release
- Industry Association
- Paid Database
- Investor Presentations

Step 4 - Data Triangulation
Involves using different sources of information in order to increase the validity of a study
These sources are likely to be stakeholders in a program - participants, other researchers, program staff, other community members, and so on.
Then we put all data in single framework & apply various statistical tools to find out the dynamic on the market.
During the analysis stage, feedback from the stakeholder groups would be compared to determine areas of agreement as well as areas of divergence