Key Insights
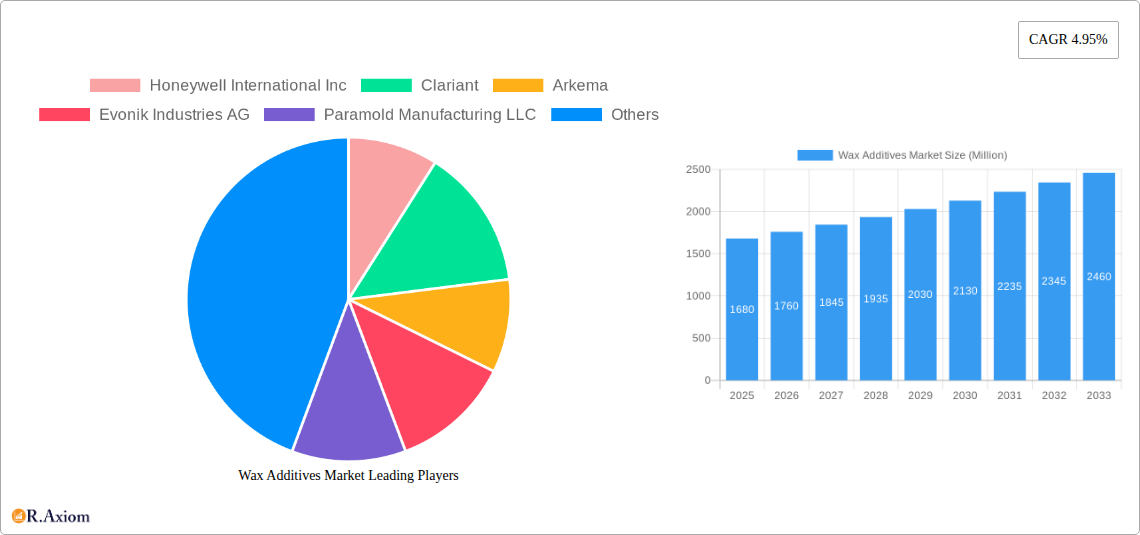
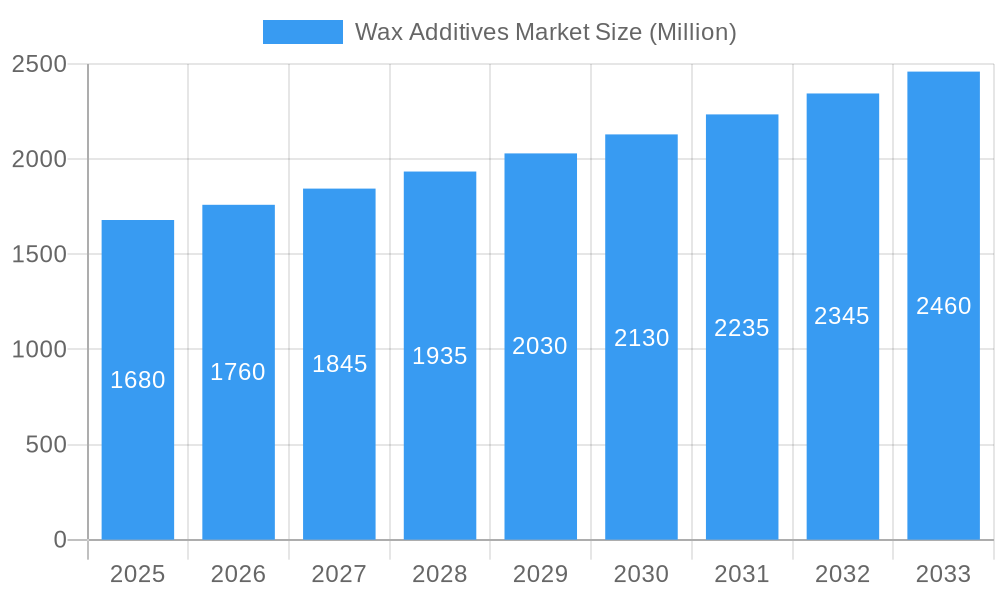
The global wax additives market, valued at $1.68 billion in 2025, is projected to experience robust growth, driven by increasing demand across diverse sectors. A compound annual growth rate (CAGR) of 4.95% from 2025 to 2033 indicates a substantial market expansion, reaching an estimated value exceeding $2.5 billion by 2033. Key drivers include the burgeoning coatings industry, particularly in automotive and construction, necessitating high-performance wax additives for enhanced durability and aesthetics. The growing popularity of eco-friendly, natural wax additives is also fueling market growth, as consumers and businesses increasingly prioritize sustainability. Furthermore, advancements in wax additive technology, leading to improved dispersibility, enhanced functionality, and cost-effectiveness, are contributing to market expansion. Segment-wise, the coatings application segment holds a significant share, followed by leather finishing and printing inks. Synthetic wax additives are gaining traction due to their superior performance characteristics compared to natural and semi-synthetic alternatives, although the demand for natural waxes continues to grow steadily due to their environmental benefits. Geographic analysis indicates strong growth in Asia-Pacific, driven by rapid industrialization and increasing construction activities in countries like China and India. North America and Europe also remain significant markets due to established industries and high consumption levels. However, price fluctuations in raw materials and stringent environmental regulations pose challenges to market growth.
Wax Additives Market Market Size (In Billion)
Competitive dynamics are intense, with major players like Honeywell, Clariant, Arkema, and BASF dominating the market. These established companies are focused on innovation, strategic partnerships, and geographic expansion to maintain their market share. The presence of several smaller, specialized players indicates significant opportunities for niche products and regional expansions. Future growth will be influenced by technological advancements, regulatory landscape changes, and evolving consumer preferences towards sustainable and high-performance products. The market is expected to witness increased mergers and acquisitions as companies seek to expand their product portfolios and gain a competitive edge. Furthermore, the growing emphasis on digitalization across value chains offers opportunities for enhanced efficiency and supply chain management.
Wax Additives Market Company Market Share
Wax Additives Market: A Comprehensive Report (2019-2033)
This in-depth report provides a comprehensive analysis of the global Wax Additives Market, offering valuable insights for industry stakeholders, investors, and businesses seeking to understand this dynamic sector. Covering the period 2019-2033, with a focus on 2025, this report meticulously examines market trends, competitive dynamics, and future growth potential. The study period spans from 2019 to 2033, with 2025 serving as the base and estimated year, and the forecast period extending from 2025 to 2033. The historical period covered is 2019-2024.
Wax Additives Market Concentration & Innovation
This section analyzes the level of market concentration within the Wax Additives industry, identifying key players and their respective market shares. We delve into the innovative drivers shaping the market, including technological advancements, R&D efforts, and the introduction of novel wax additives with enhanced functionalities. The report also explores the regulatory landscape, examining relevant policies and standards impacting product development and market access. Furthermore, we investigate the presence of substitute products and their potential impact on market dynamics. End-user trends are scrutinized, analyzing shifts in demand patterns across different applications. Finally, the report examines M&A activities within the industry, analyzing deal values and their implications for market consolidation and competitiveness. Key metrics such as market share percentages for leading companies and M&A deal values (in Millions) will be presented. For example, the report will detail the market share of companies like Honeywell International Inc, Clariant, and Arkema, and analyze the impact of recent acquisitions on market structure. The report will also analyze innovation, such as advancements in micronized wax technologies and water-based emulsion formulations.
Wax Additives Market Industry Trends & Insights
This section delves into the key trends shaping the Wax Additives Market. We examine market growth drivers, including increasing demand from key applications like coatings, leather finishing, and printing inks. The report will analyze the impact of technological disruptions, such as the introduction of sustainable and bio-based wax additives, on market dynamics. We will also consider evolving consumer preferences, focusing on the growing demand for high-performance, eco-friendly products. The competitive dynamics are explored, including pricing strategies, product differentiation, and market positioning of leading players. Specific metrics, including the Compound Annual Growth Rate (CAGR) and market penetration rates for different segments, will be provided. We will also explore the impact of factors such as economic growth, fluctuating raw material prices, and geopolitical events on the market's trajectory. The analysis covers various aspects of the market, focusing on trends for the various types of wax additives and their applications.
Dominant Markets & Segments in Wax Additives Market
This section identifies the dominant regions, countries, and segments within the Wax Additives Market. We analyze leading applications like coatings, leather finishing, and printing inks, examining their respective market sizes and growth projections. We will also analyze the dominance of material types (Natural, Semi-synthetic, Synthetic) and additive types (Dispersion, Emulsion, Micronized). The analysis will be supported by:
Key Drivers for Dominant Segments: Economic policies supporting specific industries (e.g., government incentives for sustainable manufacturing in coatings), infrastructure development driving demand in construction-related applications, and technological advancements enabling enhanced product performance.
Dominance Analysis: Paragraphs will detail the reasons for the dominance of specific regions, countries, or segments, considering factors such as established manufacturing bases, consumer preferences, and regulatory environments. For example, the report will analyze why a specific region might be leading in the adoption of synthetic wax additives for coatings applications.
Wax Additives Market Product Developments
This section summarizes recent product innovations in the Wax Additives market, highlighting their applications and competitive advantages. We will showcase the latest technological trends, focusing on the development of high-performance, sustainable, and cost-effective wax additives. The analysis will focus on how these innovations address specific market needs and enhance product differentiation for manufacturers. The market fit of new products will be assessed in relation to current demand and emerging trends.
Report Scope & Segmentation Analysis
This report comprehensively segments the Wax Additives Market based on Material (Natural, Semi-synthetic, Synthetic), Type (Dispersion, Emulsion, Micronized), and Application (Coatings, Leather Finishing, Printing Ink, Candles, Other Applications (Plastic Processing, Adhesives, and Rubber Additive)). Each segment's growth projections, market sizes (in Millions), and competitive dynamics will be analyzed. For instance, the "Coatings" application segment will be analyzed, detailing its size, growth rate, and the key players competing within it. The same detailed analysis will be applied to all other segments listed.
Key Drivers of Wax Additives Market Growth
The growth of the Wax Additives Market is propelled by several key factors. Technological advancements, leading to improved performance characteristics and new functionalities in wax additives, are a major driver. Furthermore, economic growth in key end-use industries, such as construction and automotive, stimulates demand. Favorable regulatory policies promoting the use of sustainable and environmentally friendly materials also contribute to market expansion. For example, increased demand from the expanding automotive industry, coupled with stricter environmental regulations favoring bio-based wax additives, contributes significantly to market growth.
Challenges in the Wax Additives Market Sector
The Wax Additives Market faces certain challenges. Stringent regulatory requirements regarding the use of certain chemicals can hinder product development and market access. Supply chain disruptions and fluctuations in raw material prices pose significant risks to profitability. Intense competition from established players and new entrants creates pricing pressure and necessitates continuous innovation. For example, the impact of fluctuations in the price of petroleum-based raw materials on the cost of synthetic wax additives is quantified and analyzed.
Emerging Opportunities in Wax Additives Market
Several emerging opportunities exist for growth within the Wax Additives Market. The rising demand for sustainable and bio-based wax additives presents a significant opportunity for manufacturers. New applications, such as in advanced materials and 3D printing, are emerging. Changing consumer preferences towards high-performance and eco-friendly products create further growth potential. The report will explore specific examples of these opportunities, including the increasing use of bio-based waxes in cosmetics and personal care products.
Leading Players in the Wax Additives Market Market
- Honeywell International Inc. (Honeywell International Inc.)
- Clariant (Clariant)
- Arkema (Arkema)
- Evonik Industries AG (Evonik Industries AG)
- Paramold Manufacturing LLC
- BASF SE (BASF SE)
- Shamrock Technologies Inc.
- The Lubrizol Corporation (The Lubrizol Corporation)
- Tianshi Wax
- BYK-CHEMIE GmbH (BYK-CHEMIE GmbH)
- Münzing Corporation (Münzing Corporation)
- Innospec (Innospec)
- Concentrol
Key Developments in Wax Additives Market Industry
July 2022: Münzing Corporation announced the start-up of its new plant in Zeitz Chemical and Industrial Park, producing water-based wax emulsions and other specialty additives. The EUR 50 million (USD 5.19 Million) investment signifies a significant expansion in production capacity and commitment to sustainable wax additive solutions.
January 2022: Shamrock Technologies, Inc. announced a USD 19.4 million investment to establish operations in Laurens County, South Carolina, focusing on the production of micronized wax, dispersions, and emulsions. This expansion highlights the growing demand for these specific types of wax additives.
Strategic Outlook for Wax Additives Market Market
The Wax Additives Market is poised for continued growth driven by technological innovations, increasing demand from key applications, and a growing emphasis on sustainability. Future opportunities lie in developing advanced wax additives with enhanced performance characteristics and eco-friendly attributes. Expanding into new markets and applications, such as those requiring high-performance, specialized wax additives, will be crucial for sustained growth. The market is expected to witness further consolidation through mergers and acquisitions, leading to a more concentrated yet innovative landscape.
Wax Additives Market Segmentation
-
1. Material
- 1.1. Natural
- 1.2. Semi-synthetic
- 1.3. Synthetic
-
2. Type
- 2.1. Dispersion
- 2.2. Emulsion
- 2.3. Micronized
-
3. Application
- 3.1. Coatings
- 3.2. Leather Finishing
- 3.3. Printing Ink
- 3.4. Candles
- 3.5. Other Ap
Wax Additives Market Segmentation By Geography
-
1. Asia Pacific
- 1.1. China
- 1.2. India
- 1.3. Japan
- 1.4. South Korea
- 1.5. Rest of Asia Pacific
-
2. North America
- 2.1. United States
- 2.2. Canada
- 2.3. Mexico
-
3. Europe
- 3.1. Germany
- 3.2. United Kingdom
- 3.3. Italy
- 3.4. France
- 3.5. Rest of Europe
-
4. South America
- 4.1. Brazil
- 4.2. Argentina
- 4.3. Rest of South America
-
5. Middle East and Africa
- 5.1. Saudi Arabia
- 5.2. South Africa
- 5.3. Rest of Middle East and Africa
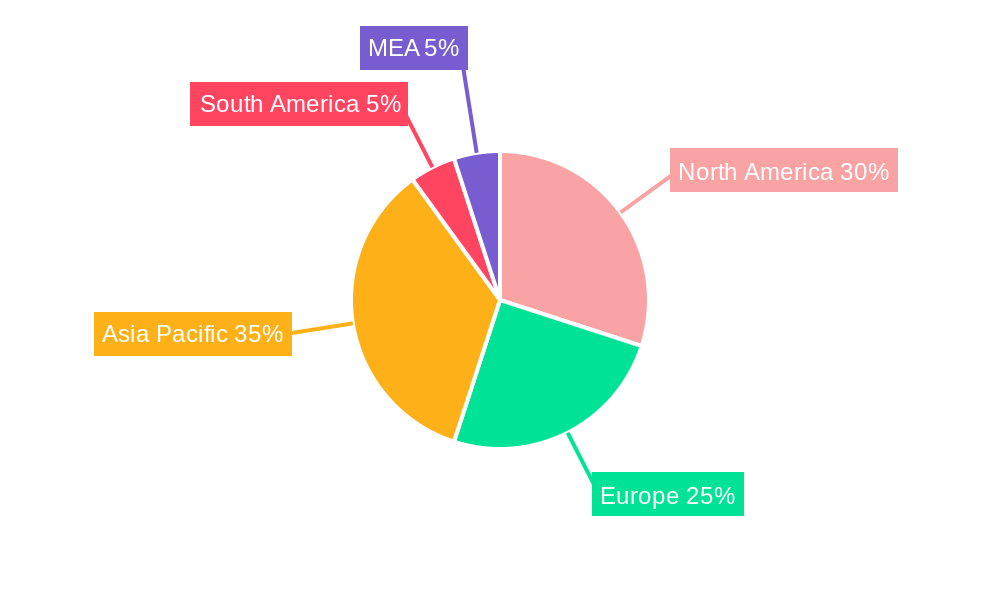
Wax Additives Market Regional Market Share
Geographic Coverage of Wax Additives Market
Wax Additives Market REPORT HIGHLIGHTS
| Aspects | Details |
|---|---|
| Study Period | 2020-2034 |
| Base Year | 2025 |
| Estimated Year | 2026 |
| Forecast Period | 2026-2034 |
| Historical Period | 2020-2025 |
| Growth Rate | CAGR of 4.95% from 2020-2034 |
| Segmentation |
|
Table of Contents
- 1. Introduction
- 1.1. Research Scope
- 1.2. Market Segmentation
- 1.3. Research Objective
- 1.4. Definitions and Assumptions
- 2. Executive Summary
- 2.1. Market Snapshot
- 3. Market Dynamics
- 3.1. Market Drivers
- 3.2. Market Restrains
- 3.3. Market Trends
- 3.4. Market Opportunities
- 4. Market Factor Analysis
- 4.1. Porters Five Forces
- 4.1.1. Bargaining Power of Suppliers
- 4.1.2. Bargaining Power of Buyers
- 4.1.3. Threat of New Entrants
- 4.1.4. Threat of Substitutes
- 4.1.5. Competitive Rivalry
- 4.2. PESTEL analysis
- 4.3. BCG Analysis
- 4.3.1. Stars (High Growth, High Market Share)
- 4.3.2. Cash Cows (Low Growth, High Market Share)
- 4.3.3. Question Mark (High Growth, Low Market Share)
- 4.3.4. Dogs (Low Growth, Low Market Share)
- 4.4. Ansoff Matrix Analysis
- 4.5. Supply Chain Analysis
- 4.6. Regulatory Landscape
- 4.7. Current Market Potential and Opportunity Assessment (TAM–SAM–SOM Framework)
- 4.8. RAX Analyst Note
- 4.1. Porters Five Forces
- 5. Market Analysis, Insights and Forecast 2021-2033
- 5.1. Market Analysis, Insights and Forecast - by Material
- 5.1.1. Natural
- 5.1.2. Semi-synthetic
- 5.1.3. Synthetic
- 5.2. Market Analysis, Insights and Forecast - by Type
- 5.2.1. Dispersion
- 5.2.2. Emulsion
- 5.2.3. Micronized
- 5.3. Market Analysis, Insights and Forecast - by Application
- 5.3.1. Coatings
- 5.3.2. Leather Finishing
- 5.3.3. Printing Ink
- 5.3.4. Candles
- 5.3.5. Other Ap
- 5.4. Market Analysis, Insights and Forecast - by Region
- 5.4.1. Asia Pacific
- 5.4.2. North America
- 5.4.3. Europe
- 5.4.4. South America
- 5.4.5. Middle East and Africa
- 5.1. Market Analysis, Insights and Forecast - by Material
- 6. Global Wax Additives Market Analysis, Insights and Forecast, 2021-2033
- 6.1. Market Analysis, Insights and Forecast - by Material
- 6.1.1. Natural
- 6.1.2. Semi-synthetic
- 6.1.3. Synthetic
- 6.2. Market Analysis, Insights and Forecast - by Type
- 6.2.1. Dispersion
- 6.2.2. Emulsion
- 6.2.3. Micronized
- 6.3. Market Analysis, Insights and Forecast - by Application
- 6.3.1. Coatings
- 6.3.2. Leather Finishing
- 6.3.3. Printing Ink
- 6.3.4. Candles
- 6.3.5. Other Ap
- 6.1. Market Analysis, Insights and Forecast - by Material
- 7. Asia Pacific Wax Additives Market Analysis, Insights and Forecast, 2020-2032
- 7.1. Market Analysis, Insights and Forecast - by Material
- 7.1.1. Natural
- 7.1.2. Semi-synthetic
- 7.1.3. Synthetic
- 7.2. Market Analysis, Insights and Forecast - by Type
- 7.2.1. Dispersion
- 7.2.2. Emulsion
- 7.2.3. Micronized
- 7.3. Market Analysis, Insights and Forecast - by Application
- 7.3.1. Coatings
- 7.3.2. Leather Finishing
- 7.3.3. Printing Ink
- 7.3.4. Candles
- 7.3.5. Other Ap
- 7.1. Market Analysis, Insights and Forecast - by Material
- 8. North America Wax Additives Market Analysis, Insights and Forecast, 2020-2032
- 8.1. Market Analysis, Insights and Forecast - by Material
- 8.1.1. Natural
- 8.1.2. Semi-synthetic
- 8.1.3. Synthetic
- 8.2. Market Analysis, Insights and Forecast - by Type
- 8.2.1. Dispersion
- 8.2.2. Emulsion
- 8.2.3. Micronized
- 8.3. Market Analysis, Insights and Forecast - by Application
- 8.3.1. Coatings
- 8.3.2. Leather Finishing
- 8.3.3. Printing Ink
- 8.3.4. Candles
- 8.3.5. Other Ap
- 8.1. Market Analysis, Insights and Forecast - by Material
- 9. Europe Wax Additives Market Analysis, Insights and Forecast, 2020-2032
- 9.1. Market Analysis, Insights and Forecast - by Material
- 9.1.1. Natural
- 9.1.2. Semi-synthetic
- 9.1.3. Synthetic
- 9.2. Market Analysis, Insights and Forecast - by Type
- 9.2.1. Dispersion
- 9.2.2. Emulsion
- 9.2.3. Micronized
- 9.3. Market Analysis, Insights and Forecast - by Application
- 9.3.1. Coatings
- 9.3.2. Leather Finishing
- 9.3.3. Printing Ink
- 9.3.4. Candles
- 9.3.5. Other Ap
- 9.1. Market Analysis, Insights and Forecast - by Material
- 10. South America Wax Additives Market Analysis, Insights and Forecast, 2020-2032
- 10.1. Market Analysis, Insights and Forecast - by Material
- 10.1.1. Natural
- 10.1.2. Semi-synthetic
- 10.1.3. Synthetic
- 10.2. Market Analysis, Insights and Forecast - by Type
- 10.2.1. Dispersion
- 10.2.2. Emulsion
- 10.2.3. Micronized
- 10.3. Market Analysis, Insights and Forecast - by Application
- 10.3.1. Coatings
- 10.3.2. Leather Finishing
- 10.3.3. Printing Ink
- 10.3.4. Candles
- 10.3.5. Other Ap
- 10.1. Market Analysis, Insights and Forecast - by Material
- 11. Middle East and Africa Wax Additives Market Analysis, Insights and Forecast, 2020-2032
- 11.1. Market Analysis, Insights and Forecast - by Material
- 11.1.1. Natural
- 11.1.2. Semi-synthetic
- 11.1.3. Synthetic
- 11.2. Market Analysis, Insights and Forecast - by Type
- 11.2.1. Dispersion
- 11.2.2. Emulsion
- 11.2.3. Micronized
- 11.3. Market Analysis, Insights and Forecast - by Application
- 11.3.1. Coatings
- 11.3.2. Leather Finishing
- 11.3.3. Printing Ink
- 11.3.4. Candles
- 11.3.5. Other Ap
- 11.1. Market Analysis, Insights and Forecast - by Material
- 12. Competitive Analysis
- 12.1. Company Profiles
- 12.1.1 Honeywell International Inc
- 12.1.1.1. Company Overview
- 12.1.1.2. Products
- 12.1.1.3. Company Financials
- 12.1.1.4. SWOT Analysis
- 12.1.2 Clariant
- 12.1.2.1. Company Overview
- 12.1.2.2. Products
- 12.1.2.3. Company Financials
- 12.1.2.4. SWOT Analysis
- 12.1.3 Arkema
- 12.1.3.1. Company Overview
- 12.1.3.2. Products
- 12.1.3.3. Company Financials
- 12.1.3.4. SWOT Analysis
- 12.1.4 Evonik Industries AG
- 12.1.4.1. Company Overview
- 12.1.4.2. Products
- 12.1.4.3. Company Financials
- 12.1.4.4. SWOT Analysis
- 12.1.5 Paramold Manufacturing LLC
- 12.1.5.1. Company Overview
- 12.1.5.2. Products
- 12.1.5.3. Company Financials
- 12.1.5.4. SWOT Analysis
- 12.1.6 BASF SE
- 12.1.6.1. Company Overview
- 12.1.6.2. Products
- 12.1.6.3. Company Financials
- 12.1.6.4. SWOT Analysis
- 12.1.7 Shamrock Technologies Inc
- 12.1.7.1. Company Overview
- 12.1.7.2. Products
- 12.1.7.3. Company Financials
- 12.1.7.4. SWOT Analysis
- 12.1.8 The Lubrizol Corporation
- 12.1.8.1. Company Overview
- 12.1.8.2. Products
- 12.1.8.3. Company Financials
- 12.1.8.4. SWOT Analysis
- 12.1.9 Tianshi Wax
- 12.1.9.1. Company Overview
- 12.1.9.2. Products
- 12.1.9.3. Company Financials
- 12.1.9.4. SWOT Analysis
- 12.1.10 BYK-CHEMIE GmbH
- 12.1.10.1. Company Overview
- 12.1.10.2. Products
- 12.1.10.3. Company Financials
- 12.1.10.4. SWOT Analysis
- 12.1.11 Münzing Corporation
- 12.1.11.1. Company Overview
- 12.1.11.2. Products
- 12.1.11.3. Company Financials
- 12.1.11.4. SWOT Analysis
- 12.1.12 Innospec
- 12.1.12.1. Company Overview
- 12.1.12.2. Products
- 12.1.12.3. Company Financials
- 12.1.12.4. SWOT Analysis
- 12.1.13 Concentrol
- 12.1.13.1. Company Overview
- 12.1.13.2. Products
- 12.1.13.3. Company Financials
- 12.1.13.4. SWOT Analysis
- 12.1.1 Honeywell International Inc
- 12.2. Market Entropy
- 12.2.1 Company's Key Areas Served
- 12.2.2 Recent Developments
- 12.3. Company Market Share Analysis 2025
- 12.3.1 Top 5 Companies Market Share Analysis
- 12.3.2 Top 3 Companies Market Share Analysis
- 12.4. List of Potential Customers
- 13. Research Methodology
List of Figures
- Figure 1: Global Wax Additives Market Revenue Breakdown (Million, %) by Region 2025 & 2033
- Figure 2: Global Wax Additives Market Volume Breakdown (K Tons, %) by Region 2025 & 2033
- Figure 3: Asia Pacific Wax Additives Market Revenue (Million), by Material 2025 & 2033
- Figure 4: Asia Pacific Wax Additives Market Volume (K Tons), by Material 2025 & 2033
- Figure 5: Asia Pacific Wax Additives Market Revenue Share (%), by Material 2025 & 2033
- Figure 6: Asia Pacific Wax Additives Market Volume Share (%), by Material 2025 & 2033
- Figure 7: Asia Pacific Wax Additives Market Revenue (Million), by Type 2025 & 2033
- Figure 8: Asia Pacific Wax Additives Market Volume (K Tons), by Type 2025 & 2033
- Figure 9: Asia Pacific Wax Additives Market Revenue Share (%), by Type 2025 & 2033
- Figure 10: Asia Pacific Wax Additives Market Volume Share (%), by Type 2025 & 2033
- Figure 11: Asia Pacific Wax Additives Market Revenue (Million), by Application 2025 & 2033
- Figure 12: Asia Pacific Wax Additives Market Volume (K Tons), by Application 2025 & 2033
- Figure 13: Asia Pacific Wax Additives Market Revenue Share (%), by Application 2025 & 2033
- Figure 14: Asia Pacific Wax Additives Market Volume Share (%), by Application 2025 & 2033
- Figure 15: Asia Pacific Wax Additives Market Revenue (Million), by Country 2025 & 2033
- Figure 16: Asia Pacific Wax Additives Market Volume (K Tons), by Country 2025 & 2033
- Figure 17: Asia Pacific Wax Additives Market Revenue Share (%), by Country 2025 & 2033
- Figure 18: Asia Pacific Wax Additives Market Volume Share (%), by Country 2025 & 2033
- Figure 19: North America Wax Additives Market Revenue (Million), by Material 2025 & 2033
- Figure 20: North America Wax Additives Market Volume (K Tons), by Material 2025 & 2033
- Figure 21: North America Wax Additives Market Revenue Share (%), by Material 2025 & 2033
- Figure 22: North America Wax Additives Market Volume Share (%), by Material 2025 & 2033
- Figure 23: North America Wax Additives Market Revenue (Million), by Type 2025 & 2033
- Figure 24: North America Wax Additives Market Volume (K Tons), by Type 2025 & 2033
- Figure 25: North America Wax Additives Market Revenue Share (%), by Type 2025 & 2033
- Figure 26: North America Wax Additives Market Volume Share (%), by Type 2025 & 2033
- Figure 27: North America Wax Additives Market Revenue (Million), by Application 2025 & 2033
- Figure 28: North America Wax Additives Market Volume (K Tons), by Application 2025 & 2033
- Figure 29: North America Wax Additives Market Revenue Share (%), by Application 2025 & 2033
- Figure 30: North America Wax Additives Market Volume Share (%), by Application 2025 & 2033
- Figure 31: North America Wax Additives Market Revenue (Million), by Country 2025 & 2033
- Figure 32: North America Wax Additives Market Volume (K Tons), by Country 2025 & 2033
- Figure 33: North America Wax Additives Market Revenue Share (%), by Country 2025 & 2033
- Figure 34: North America Wax Additives Market Volume Share (%), by Country 2025 & 2033
- Figure 35: Europe Wax Additives Market Revenue (Million), by Material 2025 & 2033
- Figure 36: Europe Wax Additives Market Volume (K Tons), by Material 2025 & 2033
- Figure 37: Europe Wax Additives Market Revenue Share (%), by Material 2025 & 2033
- Figure 38: Europe Wax Additives Market Volume Share (%), by Material 2025 & 2033
- Figure 39: Europe Wax Additives Market Revenue (Million), by Type 2025 & 2033
- Figure 40: Europe Wax Additives Market Volume (K Tons), by Type 2025 & 2033
- Figure 41: Europe Wax Additives Market Revenue Share (%), by Type 2025 & 2033
- Figure 42: Europe Wax Additives Market Volume Share (%), by Type 2025 & 2033
- Figure 43: Europe Wax Additives Market Revenue (Million), by Application 2025 & 2033
- Figure 44: Europe Wax Additives Market Volume (K Tons), by Application 2025 & 2033
- Figure 45: Europe Wax Additives Market Revenue Share (%), by Application 2025 & 2033
- Figure 46: Europe Wax Additives Market Volume Share (%), by Application 2025 & 2033
- Figure 47: Europe Wax Additives Market Revenue (Million), by Country 2025 & 2033
- Figure 48: Europe Wax Additives Market Volume (K Tons), by Country 2025 & 2033
- Figure 49: Europe Wax Additives Market Revenue Share (%), by Country 2025 & 2033
- Figure 50: Europe Wax Additives Market Volume Share (%), by Country 2025 & 2033
- Figure 51: South America Wax Additives Market Revenue (Million), by Material 2025 & 2033
- Figure 52: South America Wax Additives Market Volume (K Tons), by Material 2025 & 2033
- Figure 53: South America Wax Additives Market Revenue Share (%), by Material 2025 & 2033
- Figure 54: South America Wax Additives Market Volume Share (%), by Material 2025 & 2033
- Figure 55: South America Wax Additives Market Revenue (Million), by Type 2025 & 2033
- Figure 56: South America Wax Additives Market Volume (K Tons), by Type 2025 & 2033
- Figure 57: South America Wax Additives Market Revenue Share (%), by Type 2025 & 2033
- Figure 58: South America Wax Additives Market Volume Share (%), by Type 2025 & 2033
- Figure 59: South America Wax Additives Market Revenue (Million), by Application 2025 & 2033
- Figure 60: South America Wax Additives Market Volume (K Tons), by Application 2025 & 2033
- Figure 61: South America Wax Additives Market Revenue Share (%), by Application 2025 & 2033
- Figure 62: South America Wax Additives Market Volume Share (%), by Application 2025 & 2033
- Figure 63: South America Wax Additives Market Revenue (Million), by Country 2025 & 2033
- Figure 64: South America Wax Additives Market Volume (K Tons), by Country 2025 & 2033
- Figure 65: South America Wax Additives Market Revenue Share (%), by Country 2025 & 2033
- Figure 66: South America Wax Additives Market Volume Share (%), by Country 2025 & 2033
- Figure 67: Middle East and Africa Wax Additives Market Revenue (Million), by Material 2025 & 2033
- Figure 68: Middle East and Africa Wax Additives Market Volume (K Tons), by Material 2025 & 2033
- Figure 69: Middle East and Africa Wax Additives Market Revenue Share (%), by Material 2025 & 2033
- Figure 70: Middle East and Africa Wax Additives Market Volume Share (%), by Material 2025 & 2033
- Figure 71: Middle East and Africa Wax Additives Market Revenue (Million), by Type 2025 & 2033
- Figure 72: Middle East and Africa Wax Additives Market Volume (K Tons), by Type 2025 & 2033
- Figure 73: Middle East and Africa Wax Additives Market Revenue Share (%), by Type 2025 & 2033
- Figure 74: Middle East and Africa Wax Additives Market Volume Share (%), by Type 2025 & 2033
- Figure 75: Middle East and Africa Wax Additives Market Revenue (Million), by Application 2025 & 2033
- Figure 76: Middle East and Africa Wax Additives Market Volume (K Tons), by Application 2025 & 2033
- Figure 77: Middle East and Africa Wax Additives Market Revenue Share (%), by Application 2025 & 2033
- Figure 78: Middle East and Africa Wax Additives Market Volume Share (%), by Application 2025 & 2033
- Figure 79: Middle East and Africa Wax Additives Market Revenue (Million), by Country 2025 & 2033
- Figure 80: Middle East and Africa Wax Additives Market Volume (K Tons), by Country 2025 & 2033
- Figure 81: Middle East and Africa Wax Additives Market Revenue Share (%), by Country 2025 & 2033
- Figure 82: Middle East and Africa Wax Additives Market Volume Share (%), by Country 2025 & 2033
List of Tables
- Table 1: Global Wax Additives Market Revenue Million Forecast, by Material 2020 & 2033
- Table 2: Global Wax Additives Market Volume K Tons Forecast, by Material 2020 & 2033
- Table 3: Global Wax Additives Market Revenue Million Forecast, by Type 2020 & 2033
- Table 4: Global Wax Additives Market Volume K Tons Forecast, by Type 2020 & 2033
- Table 5: Global Wax Additives Market Revenue Million Forecast, by Application 2020 & 2033
- Table 6: Global Wax Additives Market Volume K Tons Forecast, by Application 2020 & 2033
- Table 7: Global Wax Additives Market Revenue Million Forecast, by Region 2020 & 2033
- Table 8: Global Wax Additives Market Volume K Tons Forecast, by Region 2020 & 2033
- Table 9: Global Wax Additives Market Revenue Million Forecast, by Material 2020 & 2033
- Table 10: Global Wax Additives Market Volume K Tons Forecast, by Material 2020 & 2033
- Table 11: Global Wax Additives Market Revenue Million Forecast, by Type 2020 & 2033
- Table 12: Global Wax Additives Market Volume K Tons Forecast, by Type 2020 & 2033
- Table 13: Global Wax Additives Market Revenue Million Forecast, by Application 2020 & 2033
- Table 14: Global Wax Additives Market Volume K Tons Forecast, by Application 2020 & 2033
- Table 15: Global Wax Additives Market Revenue Million Forecast, by Country 2020 & 2033
- Table 16: Global Wax Additives Market Volume K Tons Forecast, by Country 2020 & 2033
- Table 17: China Wax Additives Market Revenue (Million) Forecast, by Application 2020 & 2033
- Table 18: China Wax Additives Market Volume (K Tons) Forecast, by Application 2020 & 2033
- Table 19: India Wax Additives Market Revenue (Million) Forecast, by Application 2020 & 2033
- Table 20: India Wax Additives Market Volume (K Tons) Forecast, by Application 2020 & 2033
- Table 21: Japan Wax Additives Market Revenue (Million) Forecast, by Application 2020 & 2033
- Table 22: Japan Wax Additives Market Volume (K Tons) Forecast, by Application 2020 & 2033
- Table 23: South Korea Wax Additives Market Revenue (Million) Forecast, by Application 2020 & 2033
- Table 24: South Korea Wax Additives Market Volume (K Tons) Forecast, by Application 2020 & 2033
- Table 25: Rest of Asia Pacific Wax Additives Market Revenue (Million) Forecast, by Application 2020 & 2033
- Table 26: Rest of Asia Pacific Wax Additives Market Volume (K Tons) Forecast, by Application 2020 & 2033
- Table 27: Global Wax Additives Market Revenue Million Forecast, by Material 2020 & 2033
- Table 28: Global Wax Additives Market Volume K Tons Forecast, by Material 2020 & 2033
- Table 29: Global Wax Additives Market Revenue Million Forecast, by Type 2020 & 2033
- Table 30: Global Wax Additives Market Volume K Tons Forecast, by Type 2020 & 2033
- Table 31: Global Wax Additives Market Revenue Million Forecast, by Application 2020 & 2033
- Table 32: Global Wax Additives Market Volume K Tons Forecast, by Application 2020 & 2033
- Table 33: Global Wax Additives Market Revenue Million Forecast, by Country 2020 & 2033
- Table 34: Global Wax Additives Market Volume K Tons Forecast, by Country 2020 & 2033
- Table 35: United States Wax Additives Market Revenue (Million) Forecast, by Application 2020 & 2033
- Table 36: United States Wax Additives Market Volume (K Tons) Forecast, by Application 2020 & 2033
- Table 37: Canada Wax Additives Market Revenue (Million) Forecast, by Application 2020 & 2033
- Table 38: Canada Wax Additives Market Volume (K Tons) Forecast, by Application 2020 & 2033
- Table 39: Mexico Wax Additives Market Revenue (Million) Forecast, by Application 2020 & 2033
- Table 40: Mexico Wax Additives Market Volume (K Tons) Forecast, by Application 2020 & 2033
- Table 41: Global Wax Additives Market Revenue Million Forecast, by Material 2020 & 2033
- Table 42: Global Wax Additives Market Volume K Tons Forecast, by Material 2020 & 2033
- Table 43: Global Wax Additives Market Revenue Million Forecast, by Type 2020 & 2033
- Table 44: Global Wax Additives Market Volume K Tons Forecast, by Type 2020 & 2033
- Table 45: Global Wax Additives Market Revenue Million Forecast, by Application 2020 & 2033
- Table 46: Global Wax Additives Market Volume K Tons Forecast, by Application 2020 & 2033
- Table 47: Global Wax Additives Market Revenue Million Forecast, by Country 2020 & 2033
- Table 48: Global Wax Additives Market Volume K Tons Forecast, by Country 2020 & 2033
- Table 49: Germany Wax Additives Market Revenue (Million) Forecast, by Application 2020 & 2033
- Table 50: Germany Wax Additives Market Volume (K Tons) Forecast, by Application 2020 & 2033
- Table 51: United Kingdom Wax Additives Market Revenue (Million) Forecast, by Application 2020 & 2033
- Table 52: United Kingdom Wax Additives Market Volume (K Tons) Forecast, by Application 2020 & 2033
- Table 53: Italy Wax Additives Market Revenue (Million) Forecast, by Application 2020 & 2033
- Table 54: Italy Wax Additives Market Volume (K Tons) Forecast, by Application 2020 & 2033
- Table 55: France Wax Additives Market Revenue (Million) Forecast, by Application 2020 & 2033
- Table 56: France Wax Additives Market Volume (K Tons) Forecast, by Application 2020 & 2033
- Table 57: Rest of Europe Wax Additives Market Revenue (Million) Forecast, by Application 2020 & 2033
- Table 58: Rest of Europe Wax Additives Market Volume (K Tons) Forecast, by Application 2020 & 2033
- Table 59: Global Wax Additives Market Revenue Million Forecast, by Material 2020 & 2033
- Table 60: Global Wax Additives Market Volume K Tons Forecast, by Material 2020 & 2033
- Table 61: Global Wax Additives Market Revenue Million Forecast, by Type 2020 & 2033
- Table 62: Global Wax Additives Market Volume K Tons Forecast, by Type 2020 & 2033
- Table 63: Global Wax Additives Market Revenue Million Forecast, by Application 2020 & 2033
- Table 64: Global Wax Additives Market Volume K Tons Forecast, by Application 2020 & 2033
- Table 65: Global Wax Additives Market Revenue Million Forecast, by Country 2020 & 2033
- Table 66: Global Wax Additives Market Volume K Tons Forecast, by Country 2020 & 2033
- Table 67: Brazil Wax Additives Market Revenue (Million) Forecast, by Application 2020 & 2033
- Table 68: Brazil Wax Additives Market Volume (K Tons) Forecast, by Application 2020 & 2033
- Table 69: Argentina Wax Additives Market Revenue (Million) Forecast, by Application 2020 & 2033
- Table 70: Argentina Wax Additives Market Volume (K Tons) Forecast, by Application 2020 & 2033
- Table 71: Rest of South America Wax Additives Market Revenue (Million) Forecast, by Application 2020 & 2033
- Table 72: Rest of South America Wax Additives Market Volume (K Tons) Forecast, by Application 2020 & 2033
- Table 73: Global Wax Additives Market Revenue Million Forecast, by Material 2020 & 2033
- Table 74: Global Wax Additives Market Volume K Tons Forecast, by Material 2020 & 2033
- Table 75: Global Wax Additives Market Revenue Million Forecast, by Type 2020 & 2033
- Table 76: Global Wax Additives Market Volume K Tons Forecast, by Type 2020 & 2033
- Table 77: Global Wax Additives Market Revenue Million Forecast, by Application 2020 & 2033
- Table 78: Global Wax Additives Market Volume K Tons Forecast, by Application 2020 & 2033
- Table 79: Global Wax Additives Market Revenue Million Forecast, by Country 2020 & 2033
- Table 80: Global Wax Additives Market Volume K Tons Forecast, by Country 2020 & 2033
- Table 81: Saudi Arabia Wax Additives Market Revenue (Million) Forecast, by Application 2020 & 2033
- Table 82: Saudi Arabia Wax Additives Market Volume (K Tons) Forecast, by Application 2020 & 2033
- Table 83: South Africa Wax Additives Market Revenue (Million) Forecast, by Application 2020 & 2033
- Table 84: South Africa Wax Additives Market Volume (K Tons) Forecast, by Application 2020 & 2033
- Table 85: Rest of Middle East and Africa Wax Additives Market Revenue (Million) Forecast, by Application 2020 & 2033
- Table 86: Rest of Middle East and Africa Wax Additives Market Volume (K Tons) Forecast, by Application 2020 & 2033
Frequently Asked Questions
1. What is the projected Compound Annual Growth Rate (CAGR) of the Wax Additives Market?
The projected CAGR is approximately 4.95%.
2. Which companies are prominent players in the Wax Additives Market?
Key companies in the market include Honeywell International Inc, Clariant, Arkema, Evonik Industries AG, Paramold Manufacturing LLC, BASF SE, Shamrock Technologies Inc, The Lubrizol Corporation, Tianshi Wax , BYK-CHEMIE GmbH, Münzing Corporation, Innospec, Concentrol.
3. What are the main segments of the Wax Additives Market?
The market segments include Material, Type, Application.
4. Can you provide details about the market size?
The market size is estimated to be USD 1.68 Million as of 2022.
5. What are some drivers contributing to market growth?
Growing Consumption of Candles in Home Decor and Health Centers; Wax Additives Benefits in Coatings and Inks.
6. What are the notable trends driving market growth?
Wax Additives Expected to find High Demand in Coatings Segment.
7. Are there any restraints impacting market growth?
Volatility in Crude Oil Price.
8. Can you provide examples of recent developments in the market?
July 2022: Munzing announced the start-up of water-based wax emulsions and other specialty additives at their new plant in Zeitz Chemical and Industrial Park. The plant, built over 20,000 sq m with an investment of more than EUR 50 million (USD 5.19 million), includes the possibility of further expansion on land that is still undeveloped.
9. What pricing options are available for accessing the report?
Pricing options include single-user, multi-user, and enterprise licenses priced at USD 4750, USD 5250, and USD 8750 respectively.
10. Is the market size provided in terms of value or volume?
The market size is provided in terms of value, measured in Million and volume, measured in K Tons.
11. Are there any specific market keywords associated with the report?
Yes, the market keyword associated with the report is "Wax Additives Market," which aids in identifying and referencing the specific market segment covered.
12. How do I determine which pricing option suits my needs best?
The pricing options vary based on user requirements and access needs. Individual users may opt for single-user licenses, while businesses requiring broader access may choose multi-user or enterprise licenses for cost-effective access to the report.
13. Are there any additional resources or data provided in the Wax Additives Market report?
While the report offers comprehensive insights, it's advisable to review the specific contents or supplementary materials provided to ascertain if additional resources or data are available.
14. How can I stay updated on further developments or reports in the Wax Additives Market?
To stay informed about further developments, trends, and reports in the Wax Additives Market, consider subscribing to industry newsletters, following relevant companies and organizations, or regularly checking reputable industry news sources and publications.
Methodology
Step 1 - Identification of Relevant Samples Size from Population Database


Step 2 - Approaches for Defining Global Market Size (Value, Volume* & Price*)

Note*: In applicable scenarios
Step 3 - Data Sources
Primary Research
- Web Analytics
- Survey Reports
- Research Institute
- Latest Research Reports
- Opinion Leaders
Secondary Research
- Annual Reports
- White Paper
- Latest Press Release
- Industry Association
- Paid Database
- Investor Presentations

Step 4 - Data Triangulation
Involves using different sources of information in order to increase the validity of a study
These sources are likely to be stakeholders in a program - participants, other researchers, program staff, other community members, and so on.
Then we put all data in single framework & apply various statistical tools to find out the dynamic on the market.
During the analysis stage, feedback from the stakeholder groups would be compared to determine areas of agreement as well as areas of divergence

