

Key Insights
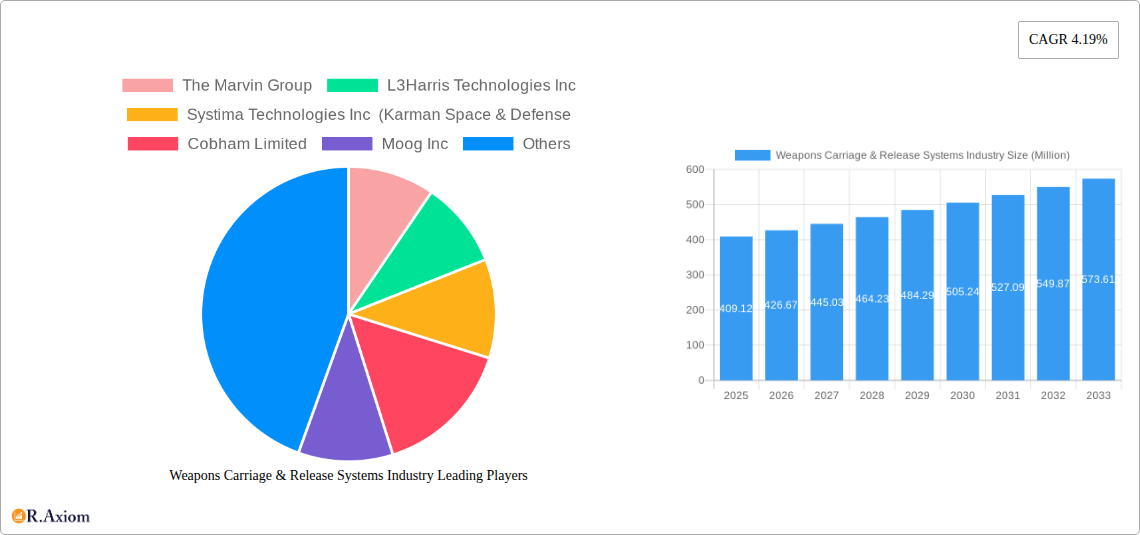
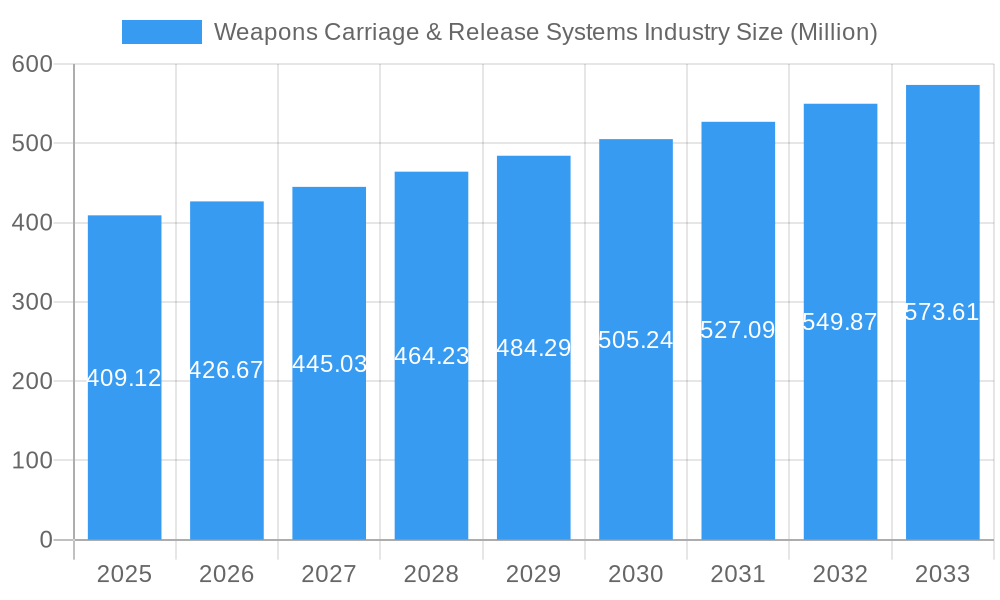
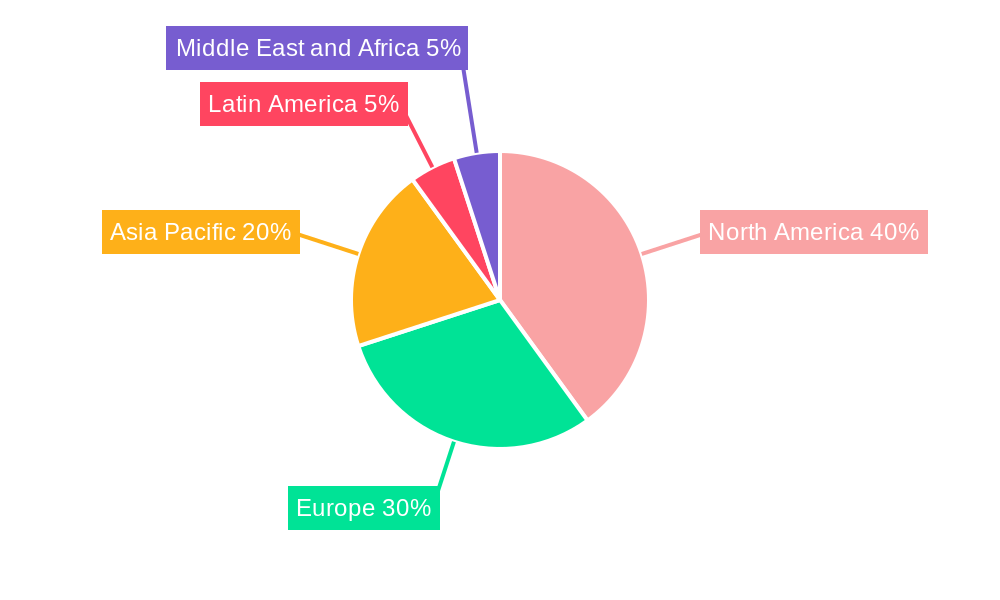
The global Weapons Carriage & Release Systems market, valued at $409.12 million in 2025, is projected to experience robust growth, driven by increasing defense budgets worldwide and the modernization of existing military aircraft fleets. The market's Compound Annual Growth Rate (CAGR) of 4.19% from 2025 to 2033 indicates a steady expansion, fueled by technological advancements in precision-guided munitions and the growing demand for improved weapon integration capabilities. Key drivers include the ongoing development of next-generation fighter jets and unmanned aerial vehicles (UAVs), necessitating sophisticated and reliable weapon carriage and release systems. The integration of advanced technologies like improved targeting systems, data links, and autonomous release mechanisms further enhances the market's growth trajectory. Market segmentation reveals a significant share held by aircraft platforms, followed by helicopters and UAVs. Missiles constitute the largest segment within weapon types, owing to their strategic importance and increasing use in modern warfare. Competition is intense among major players like The Marvin Group, L3Harris Technologies Inc, Systima Technologies Inc, Cobham Limited, Moog Inc, RTX Corporation, Alkan, and Marotta Controls Inc., each vying for market dominance through technological innovation and strategic partnerships. Geographic analysis reveals North America and Europe as leading markets, driven by robust defense spending and technological advancements. The Asia-Pacific region is expected to witness significant growth in the coming years, propelled by increasing military modernization efforts in countries like India and China.
Weapons Carriage & Release Systems Industry Market Size (In Million)
Growth is expected to be steady, influenced by global geopolitical instability and the continuous demand for enhanced weapon system integration. While the market faces constraints such as high initial investment costs and stringent regulatory approvals for new technologies, the long-term outlook remains positive due to the inherent need for secure and reliable weapon deployment across various platforms. Technological advancements and the rising demand for precision-guided munitions will continue to shape market trends, emphasizing the development of lighter, more versatile, and intelligent carriage and release systems that are compatible with a wider range of weapon types. Furthermore, the integration of advanced sensors and communication systems will allow for enhanced situational awareness and improved weapon accuracy, further stimulating market growth. The competitive landscape is characterized by a mix of established players and emerging technology providers, leading to continuous innovation and product diversification within the market.
Weapons Carriage & Release Systems Industry Company Market Share
Weapons Carriage & Release Systems Industry: A Comprehensive Market Report (2019-2033)
This in-depth report provides a comprehensive analysis of the Weapons Carriage & Release Systems industry, offering invaluable insights for stakeholders, investors, and industry professionals. Covering the period from 2019 to 2033, with a base year of 2025 and a forecast period of 2025-2033, this report meticulously examines market trends, key players, technological advancements, and future growth prospects. The report segments the market by platform (Aircraft, Helicopters, Unmanned Aerial Vehicles) and weapon type (Missiles, Bombs).
Weapons Carriage & Release Systems Industry Market Concentration & Innovation
The Weapons Carriage & Release Systems industry exhibits a moderately concentrated market structure, with a few major players holding significant market share. The Marvin Group, L3Harris Technologies Inc, and RTX Corporation are among the leading companies, collectively commanding an estimated xx% market share in 2025. Innovation is a key driver, fueled by advancements in precision guidance, autonomous systems, and increased payload capacity. Stringent regulatory frameworks, particularly concerning safety and export controls, significantly influence market dynamics. The industry witnesses considerable M&A activity, with deal values totaling an estimated $xx Million in the period 2019-2024. Substitute technologies, such as advanced propulsion systems, pose a potential challenge, while evolving end-user demands, especially for increased adaptability and network integration, shape product development.
- Market Concentration: Top 3 players hold xx% market share (2025 est.)
- M&A Activity (2019-2024): Total deal value estimated at $xx Million
- Key Innovation Drivers: Precision guidance, autonomous systems, increased payload capacity.
- Regulatory Landscape: Stringent safety and export regulations.
Weapons Carriage & Release Systems Industry Industry Trends & Insights
The Weapons Carriage & Release Systems market is projected to experience robust growth, with a Compound Annual Growth Rate (CAGR) of xx% during the forecast period (2025-2033). This growth is primarily driven by increasing defense budgets globally, the rising demand for advanced weaponry, and the expansion of UAV deployments. Technological disruptions, such as the integration of AI and machine learning in guidance systems, are reshaping the competitive landscape. Consumer preferences are shifting towards systems offering enhanced reliability, reduced maintenance costs, and improved operational efficiency. The competitive dynamics are marked by intense rivalry amongst established players and the emergence of innovative startups focusing on niche technologies. Market penetration of advanced systems is gradually increasing, with an estimated xx% market share for AI-integrated systems by 2033.
Dominant Markets & Segments in Weapons Carriage & Release Systems Industry
The North American region currently dominates the Weapons Carriage & Release Systems market, driven by strong defense spending and technological advancements. Within this region, the United States holds the largest market share due to its significant military investments and a robust domestic manufacturing base. The Aircraft segment constitutes the largest market share among platforms, accounting for an estimated xx% in 2025, followed by Helicopters and UAVs. Among weapon types, Missiles command a larger market share compared to Bombs, reflecting the increasing preference for long-range precision strike capabilities.
- Key Drivers in North America:
- High defense spending
- Robust domestic manufacturing base
- Technological leadership
- Aircraft Segment Dominance: xx% market share in 2025 (estimated), driven by high demand for advanced fighter jets and bombers.
- Missiles Segment Dominance: Larger market share than bombs due to demand for precision long-range capabilities.
Weapons Carriage & Release Systems Industry Product Developments
Recent product innovations focus on lighter weight materials, enhanced durability, improved integration with aircraft systems, and advanced targeting capabilities. These advancements aim to improve weapon delivery accuracy, reduce system weight, and enhance overall operational efficiency. Integration of AI and machine learning is improving targeting and autonomous operation. New designs prioritize modularity and adaptability, enhancing their fit with diverse aircraft platforms and mission requirements.
Report Scope & Segmentation Analysis
This report comprehensively segments the Weapons Carriage & Release Systems market by platform (Aircraft, Helicopters, Unmanned Aerial Vehicles) and weapon type (Missiles, Bombs). Each segment provides detailed analysis of market size, growth projections, and competitive dynamics. The Aircraft segment is expected to witness significant growth due to ongoing modernization programs and the development of next-generation fighter jets. The Helicopter segment will see steady growth driven by special operations and military transport needs. The UAV segment is experiencing rapid growth due to increasing adoption of drone technology. The Missiles segment is projected to grow faster than the Bombs segment due to rising demand for precision-guided munitions.
Key Drivers of Weapons Carriage & Release Systems Industry Growth
The industry's growth is propelled by several key factors: escalating defense budgets globally, the increasing demand for advanced weaponry with precision strike capabilities, technological advancements in guidance systems and autonomous operation, and the growing adoption of UAVs for military applications. Furthermore, strategic partnerships and collaborations between defense contractors and research institutions further accelerate innovation and market expansion.
Challenges in the Weapons Carriage & Release Systems Industry Sector
The industry faces challenges like stringent regulatory compliance, complex supply chains vulnerable to disruptions, intense competition from both established players and new entrants, and the high cost of research and development for advanced technologies. These challenges, if not addressed effectively, can hinder the growth trajectory of this sector. Supply chain disruptions alone were estimated to cost the industry $xx Million in 2024.
Emerging Opportunities in Weapons Carriage & Release Systems Industry
Emerging opportunities lie in the development of hypersonic weapons, the integration of AI and machine learning for enhanced targeting and autonomous operation, and the expansion into new markets, including the growing UAV sector. The development of more sustainable and environmentally friendly technologies also presents a significant opportunity for market expansion and differentiation.
Leading Players in the Weapons Carriage & Release Systems Industry Market
- The Marvin Group
- L3Harris Technologies Inc
- Systima Technologies Inc
- Karman Space & Defense
- Cobham Limited
- Moog Inc
- RTX Corporation
- Alkan
- Marotta Controls Inc
Key Developments in Weapons Carriage & Release Systems Industry Industry
- January 2023: L3Harris Technologies announced a new contract for the development of advanced targeting systems.
- April 2022: RTX Corporation unveiled a new generation of lightweight weapon release mechanisms.
- October 2021: The Marvin Group acquired a smaller competitor, expanding its market share. (Further specific examples would need to be added based on actual industry news).
Strategic Outlook for Weapons Carriage & Release Systems Industry Market
The Weapons Carriage & Release Systems market is poised for sustained growth driven by continuous technological advancements, increasing global defense spending, and the expanding adoption of UAVs. Opportunities exist in developing next-generation systems that integrate AI, enhance precision, reduce weight, and improve adaptability. Focusing on collaborative partnerships and strategic investments in research and development will be critical to capitalizing on the market’s future potential.
Weapons Carriage & Release Systems Industry Segmentation
-
1. Platform
- 1.1. Aircraft
- 1.2. Helicopters
- 1.3. Unmanned Aerial Vehicles
-
2. Weapon Type
- 2.1. Missiles
- 2.2. Bombs
- 3. Geography
-
4. North America
- 4.1. United States
- 4.2. Canada
-
5. Europe
- 5.1. United Kingdom
- 5.2. France
- 5.3. Germany
- 5.4. Russia
- 5.5. Rest of Europe
-
6. Asia-Pacific
- 6.1. China
- 6.2. India
- 6.3. Japan
- 6.4. South Korea
- 6.5. Rest of Asia-Pacific
-
7. Latin America
- 7.1. Brazil
- 7.2. Mexico
- 7.3. Rest of Latin America
-
8. Middle East and Africa
- 8.1. United Arab Emirates
- 8.2. Saudi Arabia
- 8.3. Turkey
- 8.4. South Africa
- 8.5. Rest of Middle East and Africa
Weapons Carriage & Release Systems Industry Segmentation By Geography
-
1. North America
- 1.1. United States
- 1.2. Canada
- 1.3. Mexico
-
2. South America
- 2.1. Brazil
- 2.2. Argentina
- 2.3. Rest of South America
-
3. Europe
- 3.1. United Kingdom
- 3.2. Germany
- 3.3. France
- 3.4. Italy
- 3.5. Spain
- 3.6. Russia
- 3.7. Benelux
- 3.8. Nordics
- 3.9. Rest of Europe
-
4. Middle East & Africa
- 4.1. Turkey
- 4.2. Israel
- 4.3. GCC
- 4.4. North Africa
- 4.5. South Africa
- 4.6. Rest of Middle East & Africa
-
5. Asia Pacific
- 5.1. China
- 5.2. India
- 5.3. Japan
- 5.4. South Korea
- 5.5. ASEAN
- 5.6. Oceania
- 5.7. Rest of Asia Pacific
Weapons Carriage & Release Systems Industry Regional Market Share
Geographic Coverage of Weapons Carriage & Release Systems Industry
Weapons Carriage & Release Systems Industry REPORT HIGHLIGHTS
| Aspects | Details |
|---|---|
| Study Period | 2020-2034 |
| Base Year | 2025 |
| Estimated Year | 2026 |
| Forecast Period | 2026-2034 |
| Historical Period | 2020-2025 |
| Growth Rate | CAGR of 4.19% from 2020-2034 |
| Segmentation |
|
Table of Contents
- 1. Introduction
- 1.1. Research Scope
- 1.2. Market Segmentation
- 1.3. Research Objective
- 1.4. Definitions and Assumptions
- 2. Executive Summary
- 2.1. Market Snapshot
- 3. Market Dynamics
- 3.1. Market Drivers
- 3.2. Market Restrains
- 3.3. Market Trends
- 3.4. Market Opportunities
- 4. Market Factor Analysis
- 4.1. Porters Five Forces
- 4.1.1. Bargaining Power of Suppliers
- 4.1.2. Bargaining Power of Buyers
- 4.1.3. Threat of New Entrants
- 4.1.4. Threat of Substitutes
- 4.1.5. Competitive Rivalry
- 4.2. PESTEL analysis
- 4.3. BCG Analysis
- 4.3.1. Stars (High Growth, High Market Share)
- 4.3.2. Cash Cows (Low Growth, High Market Share)
- 4.3.3. Question Mark (High Growth, Low Market Share)
- 4.3.4. Dogs (Low Growth, Low Market Share)
- 4.4. Ansoff Matrix Analysis
- 4.5. Supply Chain Analysis
- 4.6. Regulatory Landscape
- 4.7. Current Market Potential and Opportunity Assessment (TAM–SAM–SOM Framework)
- 4.8. RAX Analyst Note
- 4.1. Porters Five Forces
- 5. Market Analysis, Insights and Forecast 2021-2033
- 5.1. Market Analysis, Insights and Forecast - by Platform
- 5.1.1. Aircraft
- 5.1.2. Helicopters
- 5.1.3. Unmanned Aerial Vehicles
- 5.2. Market Analysis, Insights and Forecast - by Weapon Type
- 5.2.1. Missiles
- 5.2.2. Bombs
- 5.3. Market Analysis, Insights and Forecast - by Geography
- 5.4. Market Analysis, Insights and Forecast - by North America
- 5.4.1. United States
- 5.4.2. Canada
- 5.5. Market Analysis, Insights and Forecast - by Europe
- 5.5.1. United Kingdom
- 5.5.2. France
- 5.5.3. Germany
- 5.5.4. Russia
- 5.5.5. Rest of Europe
- 5.6. Market Analysis, Insights and Forecast - by Asia-Pacific
- 5.6.1. China
- 5.6.2. India
- 5.6.3. Japan
- 5.6.4. South Korea
- 5.6.5. Rest of Asia-Pacific
- 5.7. Market Analysis, Insights and Forecast - by Latin America
- 5.7.1. Brazil
- 5.7.2. Mexico
- 5.7.3. Rest of Latin America
- 5.8. Market Analysis, Insights and Forecast - by Middle East and Africa
- 5.8.1. United Arab Emirates
- 5.8.2. Saudi Arabia
- 5.8.3. Turkey
- 5.8.4. South Africa
- 5.8.5. Rest of Middle East and Africa
- 5.9. Market Analysis, Insights and Forecast - by Region
- 5.9.1. North America
- 5.9.2. South America
- 5.9.3. Europe
- 5.9.4. Middle East & Africa
- 5.9.5. Asia Pacific
- 5.1. Market Analysis, Insights and Forecast - by Platform
- 6. Global Weapons Carriage & Release Systems Industry Analysis, Insights and Forecast, 2021-2033
- 6.1. Market Analysis, Insights and Forecast - by Platform
- 6.1.1. Aircraft
- 6.1.2. Helicopters
- 6.1.3. Unmanned Aerial Vehicles
- 6.2. Market Analysis, Insights and Forecast - by Weapon Type
- 6.2.1. Missiles
- 6.2.2. Bombs
- 6.3. Market Analysis, Insights and Forecast - by Geography
- 6.4. Market Analysis, Insights and Forecast - by North America
- 6.4.1. United States
- 6.4.2. Canada
- 6.5. Market Analysis, Insights and Forecast - by Europe
- 6.5.1. United Kingdom
- 6.5.2. France
- 6.5.3. Germany
- 6.5.4. Russia
- 6.5.5. Rest of Europe
- 6.6. Market Analysis, Insights and Forecast - by Asia-Pacific
- 6.6.1. China
- 6.6.2. India
- 6.6.3. Japan
- 6.6.4. South Korea
- 6.6.5. Rest of Asia-Pacific
- 6.7. Market Analysis, Insights and Forecast - by Latin America
- 6.7.1. Brazil
- 6.7.2. Mexico
- 6.7.3. Rest of Latin America
- 6.8. Market Analysis, Insights and Forecast - by Middle East and Africa
- 6.8.1. United Arab Emirates
- 6.8.2. Saudi Arabia
- 6.8.3. Turkey
- 6.8.4. South Africa
- 6.8.5. Rest of Middle East and Africa
- 6.1. Market Analysis, Insights and Forecast - by Platform
- 7. North America Weapons Carriage & Release Systems Industry Analysis, Insights and Forecast, 2020-2032
- 7.1. Market Analysis, Insights and Forecast - by Platform
- 7.1.1. Aircraft
- 7.1.2. Helicopters
- 7.1.3. Unmanned Aerial Vehicles
- 7.2. Market Analysis, Insights and Forecast - by Weapon Type
- 7.2.1. Missiles
- 7.2.2. Bombs
- 7.3. Market Analysis, Insights and Forecast - by Geography
- 7.4. Market Analysis, Insights and Forecast - by North America
- 7.4.1. United States
- 7.4.2. Canada
- 7.5. Market Analysis, Insights and Forecast - by Europe
- 7.5.1. United Kingdom
- 7.5.2. France
- 7.5.3. Germany
- 7.5.4. Russia
- 7.5.5. Rest of Europe
- 7.6. Market Analysis, Insights and Forecast - by Asia-Pacific
- 7.6.1. China
- 7.6.2. India
- 7.6.3. Japan
- 7.6.4. South Korea
- 7.6.5. Rest of Asia-Pacific
- 7.7. Market Analysis, Insights and Forecast - by Latin America
- 7.7.1. Brazil
- 7.7.2. Mexico
- 7.7.3. Rest of Latin America
- 7.8. Market Analysis, Insights and Forecast - by Middle East and Africa
- 7.8.1. United Arab Emirates
- 7.8.2. Saudi Arabia
- 7.8.3. Turkey
- 7.8.4. South Africa
- 7.8.5. Rest of Middle East and Africa
- 7.1. Market Analysis, Insights and Forecast - by Platform
- 8. South America Weapons Carriage & Release Systems Industry Analysis, Insights and Forecast, 2020-2032
- 8.1. Market Analysis, Insights and Forecast - by Platform
- 8.1.1. Aircraft
- 8.1.2. Helicopters
- 8.1.3. Unmanned Aerial Vehicles
- 8.2. Market Analysis, Insights and Forecast - by Weapon Type
- 8.2.1. Missiles
- 8.2.2. Bombs
- 8.3. Market Analysis, Insights and Forecast - by Geography
- 8.4. Market Analysis, Insights and Forecast - by North America
- 8.4.1. United States
- 8.4.2. Canada
- 8.5. Market Analysis, Insights and Forecast - by Europe
- 8.5.1. United Kingdom
- 8.5.2. France
- 8.5.3. Germany
- 8.5.4. Russia
- 8.5.5. Rest of Europe
- 8.6. Market Analysis, Insights and Forecast - by Asia-Pacific
- 8.6.1. China
- 8.6.2. India
- 8.6.3. Japan
- 8.6.4. South Korea
- 8.6.5. Rest of Asia-Pacific
- 8.7. Market Analysis, Insights and Forecast - by Latin America
- 8.7.1. Brazil
- 8.7.2. Mexico
- 8.7.3. Rest of Latin America
- 8.8. Market Analysis, Insights and Forecast - by Middle East and Africa
- 8.8.1. United Arab Emirates
- 8.8.2. Saudi Arabia
- 8.8.3. Turkey
- 8.8.4. South Africa
- 8.8.5. Rest of Middle East and Africa
- 8.1. Market Analysis, Insights and Forecast - by Platform
- 9. Europe Weapons Carriage & Release Systems Industry Analysis, Insights and Forecast, 2020-2032
- 9.1. Market Analysis, Insights and Forecast - by Platform
- 9.1.1. Aircraft
- 9.1.2. Helicopters
- 9.1.3. Unmanned Aerial Vehicles
- 9.2. Market Analysis, Insights and Forecast - by Weapon Type
- 9.2.1. Missiles
- 9.2.2. Bombs
- 9.3. Market Analysis, Insights and Forecast - by Geography
- 9.4. Market Analysis, Insights and Forecast - by North America
- 9.4.1. United States
- 9.4.2. Canada
- 9.5. Market Analysis, Insights and Forecast - by Europe
- 9.5.1. United Kingdom
- 9.5.2. France
- 9.5.3. Germany
- 9.5.4. Russia
- 9.5.5. Rest of Europe
- 9.6. Market Analysis, Insights and Forecast - by Asia-Pacific
- 9.6.1. China
- 9.6.2. India
- 9.6.3. Japan
- 9.6.4. South Korea
- 9.6.5. Rest of Asia-Pacific
- 9.7. Market Analysis, Insights and Forecast - by Latin America
- 9.7.1. Brazil
- 9.7.2. Mexico
- 9.7.3. Rest of Latin America
- 9.8. Market Analysis, Insights and Forecast - by Middle East and Africa
- 9.8.1. United Arab Emirates
- 9.8.2. Saudi Arabia
- 9.8.3. Turkey
- 9.8.4. South Africa
- 9.8.5. Rest of Middle East and Africa
- 9.1. Market Analysis, Insights and Forecast - by Platform
- 10. Middle East & Africa Weapons Carriage & Release Systems Industry Analysis, Insights and Forecast, 2020-2032
- 10.1. Market Analysis, Insights and Forecast - by Platform
- 10.1.1. Aircraft
- 10.1.2. Helicopters
- 10.1.3. Unmanned Aerial Vehicles
- 10.2. Market Analysis, Insights and Forecast - by Weapon Type
- 10.2.1. Missiles
- 10.2.2. Bombs
- 10.3. Market Analysis, Insights and Forecast - by Geography
- 10.4. Market Analysis, Insights and Forecast - by North America
- 10.4.1. United States
- 10.4.2. Canada
- 10.5. Market Analysis, Insights and Forecast - by Europe
- 10.5.1. United Kingdom
- 10.5.2. France
- 10.5.3. Germany
- 10.5.4. Russia
- 10.5.5. Rest of Europe
- 10.6. Market Analysis, Insights and Forecast - by Asia-Pacific
- 10.6.1. China
- 10.6.2. India
- 10.6.3. Japan
- 10.6.4. South Korea
- 10.6.5. Rest of Asia-Pacific
- 10.7. Market Analysis, Insights and Forecast - by Latin America
- 10.7.1. Brazil
- 10.7.2. Mexico
- 10.7.3. Rest of Latin America
- 10.8. Market Analysis, Insights and Forecast - by Middle East and Africa
- 10.8.1. United Arab Emirates
- 10.8.2. Saudi Arabia
- 10.8.3. Turkey
- 10.8.4. South Africa
- 10.8.5. Rest of Middle East and Africa
- 10.1. Market Analysis, Insights and Forecast - by Platform
- 11. Asia Pacific Weapons Carriage & Release Systems Industry Analysis, Insights and Forecast, 2020-2032
- 11.1. Market Analysis, Insights and Forecast - by Platform
- 11.1.1. Aircraft
- 11.1.2. Helicopters
- 11.1.3. Unmanned Aerial Vehicles
- 11.2. Market Analysis, Insights and Forecast - by Weapon Type
- 11.2.1. Missiles
- 11.2.2. Bombs
- 11.3. Market Analysis, Insights and Forecast - by Geography
- 11.4. Market Analysis, Insights and Forecast - by North America
- 11.4.1. United States
- 11.4.2. Canada
- 11.5. Market Analysis, Insights and Forecast - by Europe
- 11.5.1. United Kingdom
- 11.5.2. France
- 11.5.3. Germany
- 11.5.4. Russia
- 11.5.5. Rest of Europe
- 11.6. Market Analysis, Insights and Forecast - by Asia-Pacific
- 11.6.1. China
- 11.6.2. India
- 11.6.3. Japan
- 11.6.4. South Korea
- 11.6.5. Rest of Asia-Pacific
- 11.7. Market Analysis, Insights and Forecast - by Latin America
- 11.7.1. Brazil
- 11.7.2. Mexico
- 11.7.3. Rest of Latin America
- 11.8. Market Analysis, Insights and Forecast - by Middle East and Africa
- 11.8.1. United Arab Emirates
- 11.8.2. Saudi Arabia
- 11.8.3. Turkey
- 11.8.4. South Africa
- 11.8.5. Rest of Middle East and Africa
- 11.1. Market Analysis, Insights and Forecast - by Platform
- 12. Competitive Analysis
- 12.1. Company Profiles
- 12.1.1 The Marvin Group
- 12.1.1.1. Company Overview
- 12.1.1.2. Products
- 12.1.1.3. Company Financials
- 12.1.1.4. SWOT Analysis
- 12.1.2 L3Harris Technologies Inc
- 12.1.2.1. Company Overview
- 12.1.2.2. Products
- 12.1.2.3. Company Financials
- 12.1.2.4. SWOT Analysis
- 12.1.3 Systima Technologies Inc (Karman Space & Defense
- 12.1.3.1. Company Overview
- 12.1.3.2. Products
- 12.1.3.3. Company Financials
- 12.1.3.4. SWOT Analysis
- 12.1.4 Cobham Limited
- 12.1.4.1. Company Overview
- 12.1.4.2. Products
- 12.1.4.3. Company Financials
- 12.1.4.4. SWOT Analysis
- 12.1.5 Moog Inc
- 12.1.5.1. Company Overview
- 12.1.5.2. Products
- 12.1.5.3. Company Financials
- 12.1.5.4. SWOT Analysis
- 12.1.6 RTX Corporation
- 12.1.6.1. Company Overview
- 12.1.6.2. Products
- 12.1.6.3. Company Financials
- 12.1.6.4. SWOT Analysis
- 12.1.7 Alkan
- 12.1.7.1. Company Overview
- 12.1.7.2. Products
- 12.1.7.3. Company Financials
- 12.1.7.4. SWOT Analysis
- 12.1.8 Marotta Controls Inc
- 12.1.8.1. Company Overview
- 12.1.8.2. Products
- 12.1.8.3. Company Financials
- 12.1.8.4. SWOT Analysis
- 12.1.1 The Marvin Group
- 12.2. Market Entropy
- 12.2.1 Company's Key Areas Served
- 12.2.2 Recent Developments
- 12.3. Company Market Share Analysis 2025
- 12.3.1 Top 5 Companies Market Share Analysis
- 12.3.2 Top 3 Companies Market Share Analysis
- 12.4. List of Potential Customers
- 13. Research Methodology
List of Figures
- Figure 1: Global Weapons Carriage & Release Systems Industry Revenue Breakdown (Million, %) by Region 2025 & 2033
- Figure 2: North America Weapons Carriage & Release Systems Industry Revenue (Million), by Platform 2025 & 2033
- Figure 3: North America Weapons Carriage & Release Systems Industry Revenue Share (%), by Platform 2025 & 2033
- Figure 4: North America Weapons Carriage & Release Systems Industry Revenue (Million), by Weapon Type 2025 & 2033
- Figure 5: North America Weapons Carriage & Release Systems Industry Revenue Share (%), by Weapon Type 2025 & 2033
- Figure 6: North America Weapons Carriage & Release Systems Industry Revenue (Million), by Geography 2025 & 2033
- Figure 7: North America Weapons Carriage & Release Systems Industry Revenue Share (%), by Geography 2025 & 2033
- Figure 8: North America Weapons Carriage & Release Systems Industry Revenue (Million), by North America 2025 & 2033
- Figure 9: North America Weapons Carriage & Release Systems Industry Revenue Share (%), by North America 2025 & 2033
- Figure 10: North America Weapons Carriage & Release Systems Industry Revenue (Million), by Europe 2025 & 2033
- Figure 11: North America Weapons Carriage & Release Systems Industry Revenue Share (%), by Europe 2025 & 2033
- Figure 12: North America Weapons Carriage & Release Systems Industry Revenue (Million), by Asia-Pacific 2025 & 2033
- Figure 13: North America Weapons Carriage & Release Systems Industry Revenue Share (%), by Asia-Pacific 2025 & 2033
- Figure 14: North America Weapons Carriage & Release Systems Industry Revenue (Million), by Latin America 2025 & 2033
- Figure 15: North America Weapons Carriage & Release Systems Industry Revenue Share (%), by Latin America 2025 & 2033
- Figure 16: North America Weapons Carriage & Release Systems Industry Revenue (Million), by Middle East and Africa 2025 & 2033
- Figure 17: North America Weapons Carriage & Release Systems Industry Revenue Share (%), by Middle East and Africa 2025 & 2033
- Figure 18: North America Weapons Carriage & Release Systems Industry Revenue (Million), by Country 2025 & 2033
- Figure 19: North America Weapons Carriage & Release Systems Industry Revenue Share (%), by Country 2025 & 2033
- Figure 20: South America Weapons Carriage & Release Systems Industry Revenue (Million), by Platform 2025 & 2033
- Figure 21: South America Weapons Carriage & Release Systems Industry Revenue Share (%), by Platform 2025 & 2033
- Figure 22: South America Weapons Carriage & Release Systems Industry Revenue (Million), by Weapon Type 2025 & 2033
- Figure 23: South America Weapons Carriage & Release Systems Industry Revenue Share (%), by Weapon Type 2025 & 2033
- Figure 24: South America Weapons Carriage & Release Systems Industry Revenue (Million), by Geography 2025 & 2033
- Figure 25: South America Weapons Carriage & Release Systems Industry Revenue Share (%), by Geography 2025 & 2033
- Figure 26: South America Weapons Carriage & Release Systems Industry Revenue (Million), by North America 2025 & 2033
- Figure 27: South America Weapons Carriage & Release Systems Industry Revenue Share (%), by North America 2025 & 2033
- Figure 28: South America Weapons Carriage & Release Systems Industry Revenue (Million), by Europe 2025 & 2033
- Figure 29: South America Weapons Carriage & Release Systems Industry Revenue Share (%), by Europe 2025 & 2033
- Figure 30: South America Weapons Carriage & Release Systems Industry Revenue (Million), by Asia-Pacific 2025 & 2033
- Figure 31: South America Weapons Carriage & Release Systems Industry Revenue Share (%), by Asia-Pacific 2025 & 2033
- Figure 32: South America Weapons Carriage & Release Systems Industry Revenue (Million), by Latin America 2025 & 2033
- Figure 33: South America Weapons Carriage & Release Systems Industry Revenue Share (%), by Latin America 2025 & 2033
- Figure 34: South America Weapons Carriage & Release Systems Industry Revenue (Million), by Middle East and Africa 2025 & 2033
- Figure 35: South America Weapons Carriage & Release Systems Industry Revenue Share (%), by Middle East and Africa 2025 & 2033
- Figure 36: South America Weapons Carriage & Release Systems Industry Revenue (Million), by Country 2025 & 2033
- Figure 37: South America Weapons Carriage & Release Systems Industry Revenue Share (%), by Country 2025 & 2033
- Figure 38: Europe Weapons Carriage & Release Systems Industry Revenue (Million), by Platform 2025 & 2033
- Figure 39: Europe Weapons Carriage & Release Systems Industry Revenue Share (%), by Platform 2025 & 2033
- Figure 40: Europe Weapons Carriage & Release Systems Industry Revenue (Million), by Weapon Type 2025 & 2033
- Figure 41: Europe Weapons Carriage & Release Systems Industry Revenue Share (%), by Weapon Type 2025 & 2033
- Figure 42: Europe Weapons Carriage & Release Systems Industry Revenue (Million), by Geography 2025 & 2033
- Figure 43: Europe Weapons Carriage & Release Systems Industry Revenue Share (%), by Geography 2025 & 2033
- Figure 44: Europe Weapons Carriage & Release Systems Industry Revenue (Million), by North America 2025 & 2033
- Figure 45: Europe Weapons Carriage & Release Systems Industry Revenue Share (%), by North America 2025 & 2033
- Figure 46: Europe Weapons Carriage & Release Systems Industry Revenue (Million), by Europe 2025 & 2033
- Figure 47: Europe Weapons Carriage & Release Systems Industry Revenue Share (%), by Europe 2025 & 2033
- Figure 48: Europe Weapons Carriage & Release Systems Industry Revenue (Million), by Asia-Pacific 2025 & 2033
- Figure 49: Europe Weapons Carriage & Release Systems Industry Revenue Share (%), by Asia-Pacific 2025 & 2033
- Figure 50: Europe Weapons Carriage & Release Systems Industry Revenue (Million), by Latin America 2025 & 2033
- Figure 51: Europe Weapons Carriage & Release Systems Industry Revenue Share (%), by Latin America 2025 & 2033
- Figure 52: Europe Weapons Carriage & Release Systems Industry Revenue (Million), by Middle East and Africa 2025 & 2033
- Figure 53: Europe Weapons Carriage & Release Systems Industry Revenue Share (%), by Middle East and Africa 2025 & 2033
- Figure 54: Europe Weapons Carriage & Release Systems Industry Revenue (Million), by Country 2025 & 2033
- Figure 55: Europe Weapons Carriage & Release Systems Industry Revenue Share (%), by Country 2025 & 2033
- Figure 56: Middle East & Africa Weapons Carriage & Release Systems Industry Revenue (Million), by Platform 2025 & 2033
- Figure 57: Middle East & Africa Weapons Carriage & Release Systems Industry Revenue Share (%), by Platform 2025 & 2033
- Figure 58: Middle East & Africa Weapons Carriage & Release Systems Industry Revenue (Million), by Weapon Type 2025 & 2033
- Figure 59: Middle East & Africa Weapons Carriage & Release Systems Industry Revenue Share (%), by Weapon Type 2025 & 2033
- Figure 60: Middle East & Africa Weapons Carriage & Release Systems Industry Revenue (Million), by Geography 2025 & 2033
- Figure 61: Middle East & Africa Weapons Carriage & Release Systems Industry Revenue Share (%), by Geography 2025 & 2033
- Figure 62: Middle East & Africa Weapons Carriage & Release Systems Industry Revenue (Million), by North America 2025 & 2033
- Figure 63: Middle East & Africa Weapons Carriage & Release Systems Industry Revenue Share (%), by North America 2025 & 2033
- Figure 64: Middle East & Africa Weapons Carriage & Release Systems Industry Revenue (Million), by Europe 2025 & 2033
- Figure 65: Middle East & Africa Weapons Carriage & Release Systems Industry Revenue Share (%), by Europe 2025 & 2033
- Figure 66: Middle East & Africa Weapons Carriage & Release Systems Industry Revenue (Million), by Asia-Pacific 2025 & 2033
- Figure 67: Middle East & Africa Weapons Carriage & Release Systems Industry Revenue Share (%), by Asia-Pacific 2025 & 2033
- Figure 68: Middle East & Africa Weapons Carriage & Release Systems Industry Revenue (Million), by Latin America 2025 & 2033
- Figure 69: Middle East & Africa Weapons Carriage & Release Systems Industry Revenue Share (%), by Latin America 2025 & 2033
- Figure 70: Middle East & Africa Weapons Carriage & Release Systems Industry Revenue (Million), by Middle East and Africa 2025 & 2033
- Figure 71: Middle East & Africa Weapons Carriage & Release Systems Industry Revenue Share (%), by Middle East and Africa 2025 & 2033
- Figure 72: Middle East & Africa Weapons Carriage & Release Systems Industry Revenue (Million), by Country 2025 & 2033
- Figure 73: Middle East & Africa Weapons Carriage & Release Systems Industry Revenue Share (%), by Country 2025 & 2033
- Figure 74: Asia Pacific Weapons Carriage & Release Systems Industry Revenue (Million), by Platform 2025 & 2033
- Figure 75: Asia Pacific Weapons Carriage & Release Systems Industry Revenue Share (%), by Platform 2025 & 2033
- Figure 76: Asia Pacific Weapons Carriage & Release Systems Industry Revenue (Million), by Weapon Type 2025 & 2033
- Figure 77: Asia Pacific Weapons Carriage & Release Systems Industry Revenue Share (%), by Weapon Type 2025 & 2033
- Figure 78: Asia Pacific Weapons Carriage & Release Systems Industry Revenue (Million), by Geography 2025 & 2033
- Figure 79: Asia Pacific Weapons Carriage & Release Systems Industry Revenue Share (%), by Geography 2025 & 2033
- Figure 80: Asia Pacific Weapons Carriage & Release Systems Industry Revenue (Million), by North America 2025 & 2033
- Figure 81: Asia Pacific Weapons Carriage & Release Systems Industry Revenue Share (%), by North America 2025 & 2033
- Figure 82: Asia Pacific Weapons Carriage & Release Systems Industry Revenue (Million), by Europe 2025 & 2033
- Figure 83: Asia Pacific Weapons Carriage & Release Systems Industry Revenue Share (%), by Europe 2025 & 2033
- Figure 84: Asia Pacific Weapons Carriage & Release Systems Industry Revenue (Million), by Asia-Pacific 2025 & 2033
- Figure 85: Asia Pacific Weapons Carriage & Release Systems Industry Revenue Share (%), by Asia-Pacific 2025 & 2033
- Figure 86: Asia Pacific Weapons Carriage & Release Systems Industry Revenue (Million), by Latin America 2025 & 2033
- Figure 87: Asia Pacific Weapons Carriage & Release Systems Industry Revenue Share (%), by Latin America 2025 & 2033
- Figure 88: Asia Pacific Weapons Carriage & Release Systems Industry Revenue (Million), by Middle East and Africa 2025 & 2033
- Figure 89: Asia Pacific Weapons Carriage & Release Systems Industry Revenue Share (%), by Middle East and Africa 2025 & 2033
- Figure 90: Asia Pacific Weapons Carriage & Release Systems Industry Revenue (Million), by Country 2025 & 2033
- Figure 91: Asia Pacific Weapons Carriage & Release Systems Industry Revenue Share (%), by Country 2025 & 2033
List of Tables
- Table 1: Global Weapons Carriage & Release Systems Industry Revenue Million Forecast, by Platform 2020 & 2033
- Table 2: Global Weapons Carriage & Release Systems Industry Revenue Million Forecast, by Weapon Type 2020 & 2033
- Table 3: Global Weapons Carriage & Release Systems Industry Revenue Million Forecast, by Geography 2020 & 2033
- Table 4: Global Weapons Carriage & Release Systems Industry Revenue Million Forecast, by North America 2020 & 2033
- Table 5: Global Weapons Carriage & Release Systems Industry Revenue Million Forecast, by Europe 2020 & 2033
- Table 6: Global Weapons Carriage & Release Systems Industry Revenue Million Forecast, by Asia-Pacific 2020 & 2033
- Table 7: Global Weapons Carriage & Release Systems Industry Revenue Million Forecast, by Latin America 2020 & 2033
- Table 8: Global Weapons Carriage & Release Systems Industry Revenue Million Forecast, by Middle East and Africa 2020 & 2033
- Table 9: Global Weapons Carriage & Release Systems Industry Revenue Million Forecast, by Region 2020 & 2033
- Table 10: Global Weapons Carriage & Release Systems Industry Revenue Million Forecast, by Platform 2020 & 2033
- Table 11: Global Weapons Carriage & Release Systems Industry Revenue Million Forecast, by Weapon Type 2020 & 2033
- Table 12: Global Weapons Carriage & Release Systems Industry Revenue Million Forecast, by Geography 2020 & 2033
- Table 13: Global Weapons Carriage & Release Systems Industry Revenue Million Forecast, by North America 2020 & 2033
- Table 14: Global Weapons Carriage & Release Systems Industry Revenue Million Forecast, by Europe 2020 & 2033
- Table 15: Global Weapons Carriage & Release Systems Industry Revenue Million Forecast, by Asia-Pacific 2020 & 2033
- Table 16: Global Weapons Carriage & Release Systems Industry Revenue Million Forecast, by Latin America 2020 & 2033
- Table 17: Global Weapons Carriage & Release Systems Industry Revenue Million Forecast, by Middle East and Africa 2020 & 2033
- Table 18: Global Weapons Carriage & Release Systems Industry Revenue Million Forecast, by Country 2020 & 2033
- Table 19: United States Weapons Carriage & Release Systems Industry Revenue (Million) Forecast, by Application 2020 & 2033
- Table 20: Canada Weapons Carriage & Release Systems Industry Revenue (Million) Forecast, by Application 2020 & 2033
- Table 21: Mexico Weapons Carriage & Release Systems Industry Revenue (Million) Forecast, by Application 2020 & 2033
- Table 22: Global Weapons Carriage & Release Systems Industry Revenue Million Forecast, by Platform 2020 & 2033
- Table 23: Global Weapons Carriage & Release Systems Industry Revenue Million Forecast, by Weapon Type 2020 & 2033
- Table 24: Global Weapons Carriage & Release Systems Industry Revenue Million Forecast, by Geography 2020 & 2033
- Table 25: Global Weapons Carriage & Release Systems Industry Revenue Million Forecast, by North America 2020 & 2033
- Table 26: Global Weapons Carriage & Release Systems Industry Revenue Million Forecast, by Europe 2020 & 2033
- Table 27: Global Weapons Carriage & Release Systems Industry Revenue Million Forecast, by Asia-Pacific 2020 & 2033
- Table 28: Global Weapons Carriage & Release Systems Industry Revenue Million Forecast, by Latin America 2020 & 2033
- Table 29: Global Weapons Carriage & Release Systems Industry Revenue Million Forecast, by Middle East and Africa 2020 & 2033
- Table 30: Global Weapons Carriage & Release Systems Industry Revenue Million Forecast, by Country 2020 & 2033
- Table 31: Brazil Weapons Carriage & Release Systems Industry Revenue (Million) Forecast, by Application 2020 & 2033
- Table 32: Argentina Weapons Carriage & Release Systems Industry Revenue (Million) Forecast, by Application 2020 & 2033
- Table 33: Rest of South America Weapons Carriage & Release Systems Industry Revenue (Million) Forecast, by Application 2020 & 2033
- Table 34: Global Weapons Carriage & Release Systems Industry Revenue Million Forecast, by Platform 2020 & 2033
- Table 35: Global Weapons Carriage & Release Systems Industry Revenue Million Forecast, by Weapon Type 2020 & 2033
- Table 36: Global Weapons Carriage & Release Systems Industry Revenue Million Forecast, by Geography 2020 & 2033
- Table 37: Global Weapons Carriage & Release Systems Industry Revenue Million Forecast, by North America 2020 & 2033
- Table 38: Global Weapons Carriage & Release Systems Industry Revenue Million Forecast, by Europe 2020 & 2033
- Table 39: Global Weapons Carriage & Release Systems Industry Revenue Million Forecast, by Asia-Pacific 2020 & 2033
- Table 40: Global Weapons Carriage & Release Systems Industry Revenue Million Forecast, by Latin America 2020 & 2033
- Table 41: Global Weapons Carriage & Release Systems Industry Revenue Million Forecast, by Middle East and Africa 2020 & 2033
- Table 42: Global Weapons Carriage & Release Systems Industry Revenue Million Forecast, by Country 2020 & 2033
- Table 43: United Kingdom Weapons Carriage & Release Systems Industry Revenue (Million) Forecast, by Application 2020 & 2033
- Table 44: Germany Weapons Carriage & Release Systems Industry Revenue (Million) Forecast, by Application 2020 & 2033
- Table 45: France Weapons Carriage & Release Systems Industry Revenue (Million) Forecast, by Application 2020 & 2033
- Table 46: Italy Weapons Carriage & Release Systems Industry Revenue (Million) Forecast, by Application 2020 & 2033
- Table 47: Spain Weapons Carriage & Release Systems Industry Revenue (Million) Forecast, by Application 2020 & 2033
- Table 48: Russia Weapons Carriage & Release Systems Industry Revenue (Million) Forecast, by Application 2020 & 2033
- Table 49: Benelux Weapons Carriage & Release Systems Industry Revenue (Million) Forecast, by Application 2020 & 2033
- Table 50: Nordics Weapons Carriage & Release Systems Industry Revenue (Million) Forecast, by Application 2020 & 2033
- Table 51: Rest of Europe Weapons Carriage & Release Systems Industry Revenue (Million) Forecast, by Application 2020 & 2033
- Table 52: Global Weapons Carriage & Release Systems Industry Revenue Million Forecast, by Platform 2020 & 2033
- Table 53: Global Weapons Carriage & Release Systems Industry Revenue Million Forecast, by Weapon Type 2020 & 2033
- Table 54: Global Weapons Carriage & Release Systems Industry Revenue Million Forecast, by Geography 2020 & 2033
- Table 55: Global Weapons Carriage & Release Systems Industry Revenue Million Forecast, by North America 2020 & 2033
- Table 56: Global Weapons Carriage & Release Systems Industry Revenue Million Forecast, by Europe 2020 & 2033
- Table 57: Global Weapons Carriage & Release Systems Industry Revenue Million Forecast, by Asia-Pacific 2020 & 2033
- Table 58: Global Weapons Carriage & Release Systems Industry Revenue Million Forecast, by Latin America 2020 & 2033
- Table 59: Global Weapons Carriage & Release Systems Industry Revenue Million Forecast, by Middle East and Africa 2020 & 2033
- Table 60: Global Weapons Carriage & Release Systems Industry Revenue Million Forecast, by Country 2020 & 2033
- Table 61: Turkey Weapons Carriage & Release Systems Industry Revenue (Million) Forecast, by Application 2020 & 2033
- Table 62: Israel Weapons Carriage & Release Systems Industry Revenue (Million) Forecast, by Application 2020 & 2033
- Table 63: GCC Weapons Carriage & Release Systems Industry Revenue (Million) Forecast, by Application 2020 & 2033
- Table 64: North Africa Weapons Carriage & Release Systems Industry Revenue (Million) Forecast, by Application 2020 & 2033
- Table 65: South Africa Weapons Carriage & Release Systems Industry Revenue (Million) Forecast, by Application 2020 & 2033
- Table 66: Rest of Middle East & Africa Weapons Carriage & Release Systems Industry Revenue (Million) Forecast, by Application 2020 & 2033
- Table 67: Global Weapons Carriage & Release Systems Industry Revenue Million Forecast, by Platform 2020 & 2033
- Table 68: Global Weapons Carriage & Release Systems Industry Revenue Million Forecast, by Weapon Type 2020 & 2033
- Table 69: Global Weapons Carriage & Release Systems Industry Revenue Million Forecast, by Geography 2020 & 2033
- Table 70: Global Weapons Carriage & Release Systems Industry Revenue Million Forecast, by North America 2020 & 2033
- Table 71: Global Weapons Carriage & Release Systems Industry Revenue Million Forecast, by Europe 2020 & 2033
- Table 72: Global Weapons Carriage & Release Systems Industry Revenue Million Forecast, by Asia-Pacific 2020 & 2033
- Table 73: Global Weapons Carriage & Release Systems Industry Revenue Million Forecast, by Latin America 2020 & 2033
- Table 74: Global Weapons Carriage & Release Systems Industry Revenue Million Forecast, by Middle East and Africa 2020 & 2033
- Table 75: Global Weapons Carriage & Release Systems Industry Revenue Million Forecast, by Country 2020 & 2033
- Table 76: China Weapons Carriage & Release Systems Industry Revenue (Million) Forecast, by Application 2020 & 2033
- Table 77: India Weapons Carriage & Release Systems Industry Revenue (Million) Forecast, by Application 2020 & 2033
- Table 78: Japan Weapons Carriage & Release Systems Industry Revenue (Million) Forecast, by Application 2020 & 2033
- Table 79: South Korea Weapons Carriage & Release Systems Industry Revenue (Million) Forecast, by Application 2020 & 2033
- Table 80: ASEAN Weapons Carriage & Release Systems Industry Revenue (Million) Forecast, by Application 2020 & 2033
- Table 81: Oceania Weapons Carriage & Release Systems Industry Revenue (Million) Forecast, by Application 2020 & 2033
- Table 82: Rest of Asia Pacific Weapons Carriage & Release Systems Industry Revenue (Million) Forecast, by Application 2020 & 2033
Frequently Asked Questions
1. What is the projected Compound Annual Growth Rate (CAGR) of the Weapons Carriage & Release Systems Industry?
The projected CAGR is approximately 4.19%.
2. Which companies are prominent players in the Weapons Carriage & Release Systems Industry?
Key companies in the market include The Marvin Group, L3Harris Technologies Inc, Systima Technologies Inc (Karman Space & Defense, Cobham Limited, Moog Inc, RTX Corporation, Alkan, Marotta Controls Inc.
3. What are the main segments of the Weapons Carriage & Release Systems Industry?
The market segments include Platform, Weapon Type, Geography, North America, Europe, Asia-Pacific, Latin America, Middle East and Africa.
4. Can you provide details about the market size?
The market size is estimated to be USD 409.12 Million as of 2022.
5. What are some drivers contributing to market growth?
N/A
6. What are the notable trends driving market growth?
Aircraft Platform to Dominate the Market.
7. Are there any restraints impacting market growth?
N/A
8. Can you provide examples of recent developments in the market?
N/A
9. What pricing options are available for accessing the report?
Pricing options include single-user, multi-user, and enterprise licenses priced at USD 4750, USD 5250, and USD 8750 respectively.
10. Is the market size provided in terms of value or volume?
The market size is provided in terms of value, measured in Million.
11. Are there any specific market keywords associated with the report?
Yes, the market keyword associated with the report is "Weapons Carriage & Release Systems Industry," which aids in identifying and referencing the specific market segment covered.
12. How do I determine which pricing option suits my needs best?
The pricing options vary based on user requirements and access needs. Individual users may opt for single-user licenses, while businesses requiring broader access may choose multi-user or enterprise licenses for cost-effective access to the report.
13. Are there any additional resources or data provided in the Weapons Carriage & Release Systems Industry report?
While the report offers comprehensive insights, it's advisable to review the specific contents or supplementary materials provided to ascertain if additional resources or data are available.
14. How can I stay updated on further developments or reports in the Weapons Carriage & Release Systems Industry?
To stay informed about further developments, trends, and reports in the Weapons Carriage & Release Systems Industry, consider subscribing to industry newsletters, following relevant companies and organizations, or regularly checking reputable industry news sources and publications.
Methodology
Step 1 - Identification of Relevant Samples Size from Population Database


Step 2 - Approaches for Defining Global Market Size (Value, Volume* & Price*)

Note*: In applicable scenarios
Step 3 - Data Sources
Primary Research
- Web Analytics
- Survey Reports
- Research Institute
- Latest Research Reports
- Opinion Leaders
Secondary Research
- Annual Reports
- White Paper
- Latest Press Release
- Industry Association
- Paid Database
- Investor Presentations

Step 4 - Data Triangulation
Involves using different sources of information in order to increase the validity of a study
These sources are likely to be stakeholders in a program - participants, other researchers, program staff, other community members, and so on.
Then we put all data in single framework & apply various statistical tools to find out the dynamic on the market.
During the analysis stage, feedback from the stakeholder groups would be compared to determine areas of agreement as well as areas of divergence