


Key Insights into Wetland Management Solutions Market
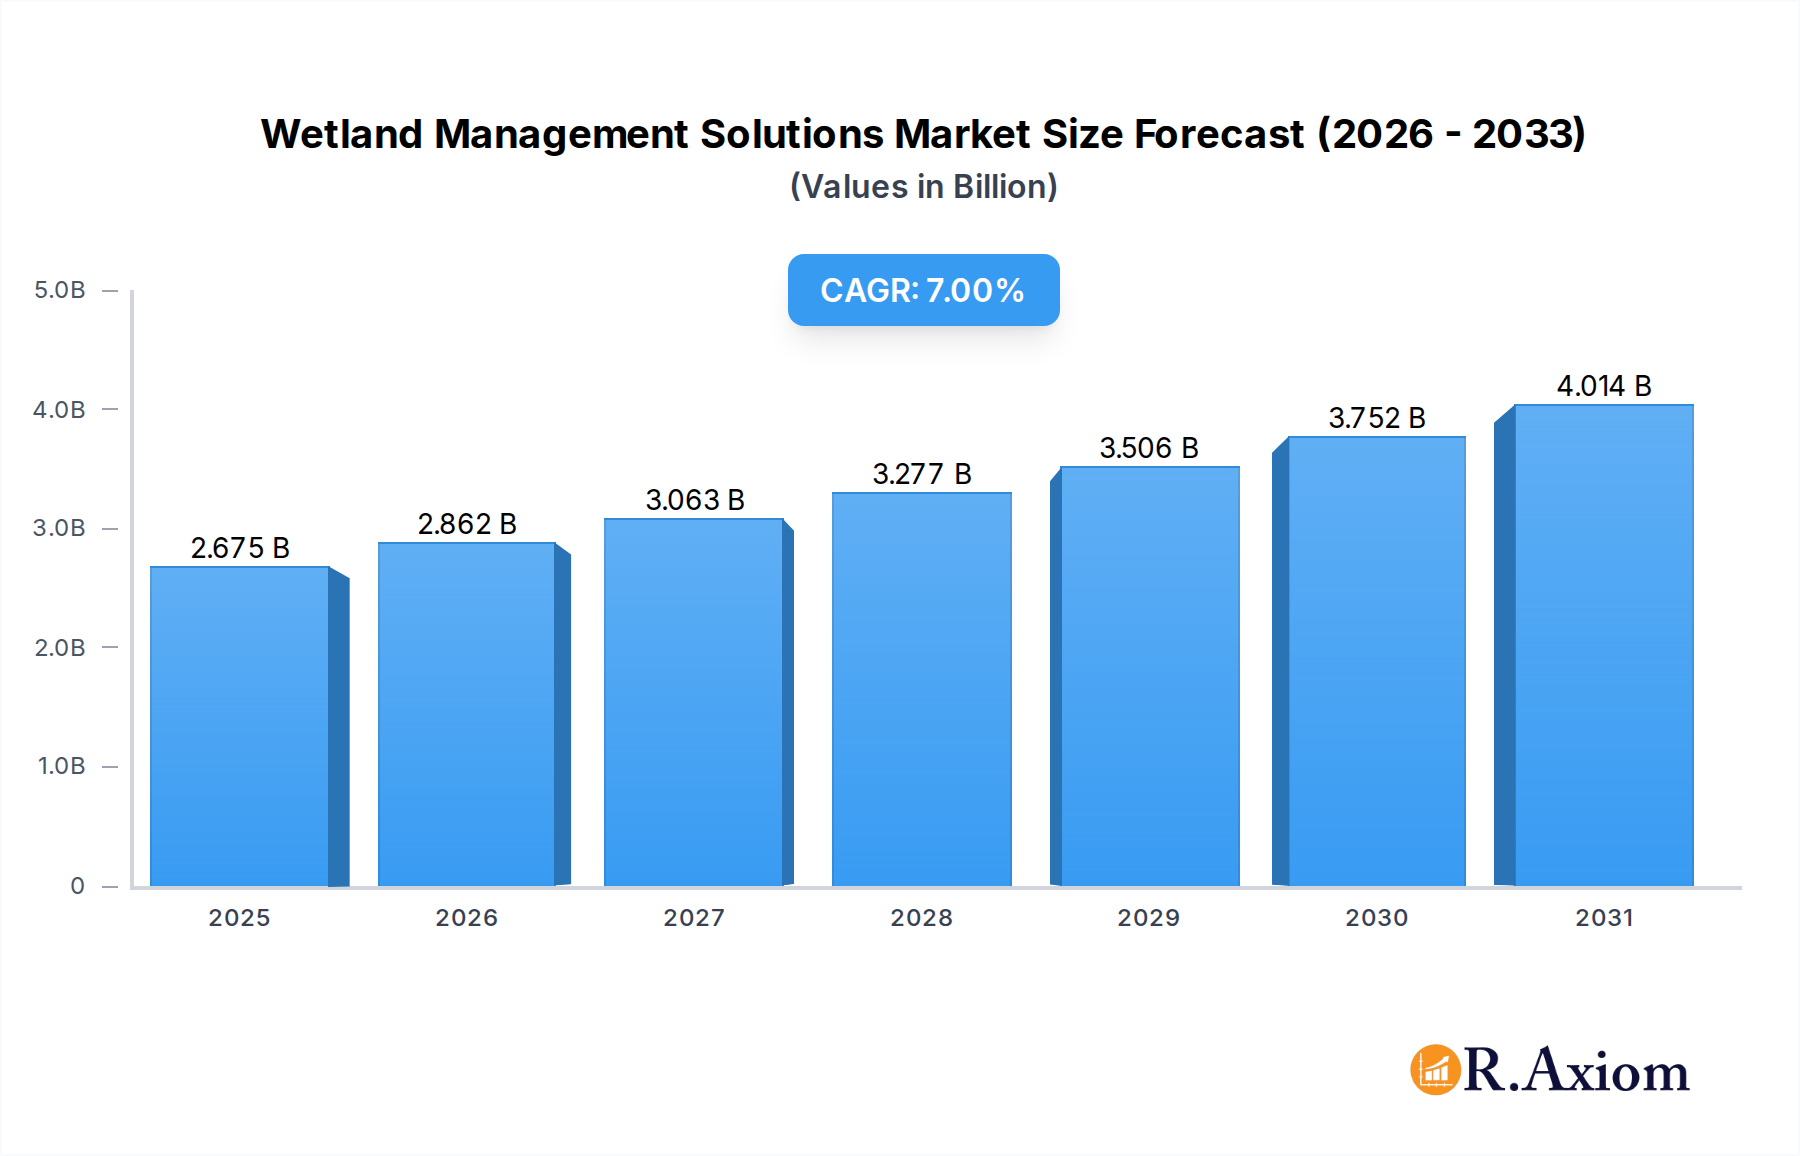
The global Wetland Management Solutions Market is poised for substantial expansion, with an estimated valuation of $2.5 billion in 2025. Projections indicate a robust Compound Annual Growth Rate (CAGR) of 7% from 2025 to 2034, culminating in a market size approaching $4.6 billion by the end of the forecast period. This growth trajectory is underpinned by a convergence of environmental imperatives, stringent regulatory frameworks, and increasing recognition of wetlands' critical ecosystem services. Key demand drivers include escalating global awareness of climate change impacts, the critical need for flood attenuation and water purification, and biodiversity conservation efforts. Furthermore, compensatory mitigation requirements stemming from infrastructure development and land-use change significantly bolster demand for specialized wetland management services. The market's foundational strength lies in its diverse service offerings, encompassing restoration, conservation, assessment, and consulting, catering to a wide array of end-users from government agencies to private corporations. As technological advancements in areas like remote sensing and data analytics mature, they are increasingly integrated into management protocols, enhancing efficiency and effectiveness. The Water Management Market is intrinsically linked, as wetland health directly impacts water quality and availability for human and ecological consumption. The long-term outlook for the Wetland Management Solutions Market remains highly positive, driven by persistent environmental challenges and evolving policy landscapes that prioritize sustainable ecological practices. Investment in the Ecological Restoration Market is a significant factor, as many wetland projects fall under this broader category, benefiting from dedicated funding and policy support aimed at reversing environmental degradation. Governments and private entities are increasingly recognizing the economic and social benefits of healthy wetlands, leading to sustained demand for comprehensive management strategies. This sustained interest is not only a response to regulatory pressures but also a proactive move towards resilience and sustainability, particularly as the frequency and intensity of extreme weather events increase globally.
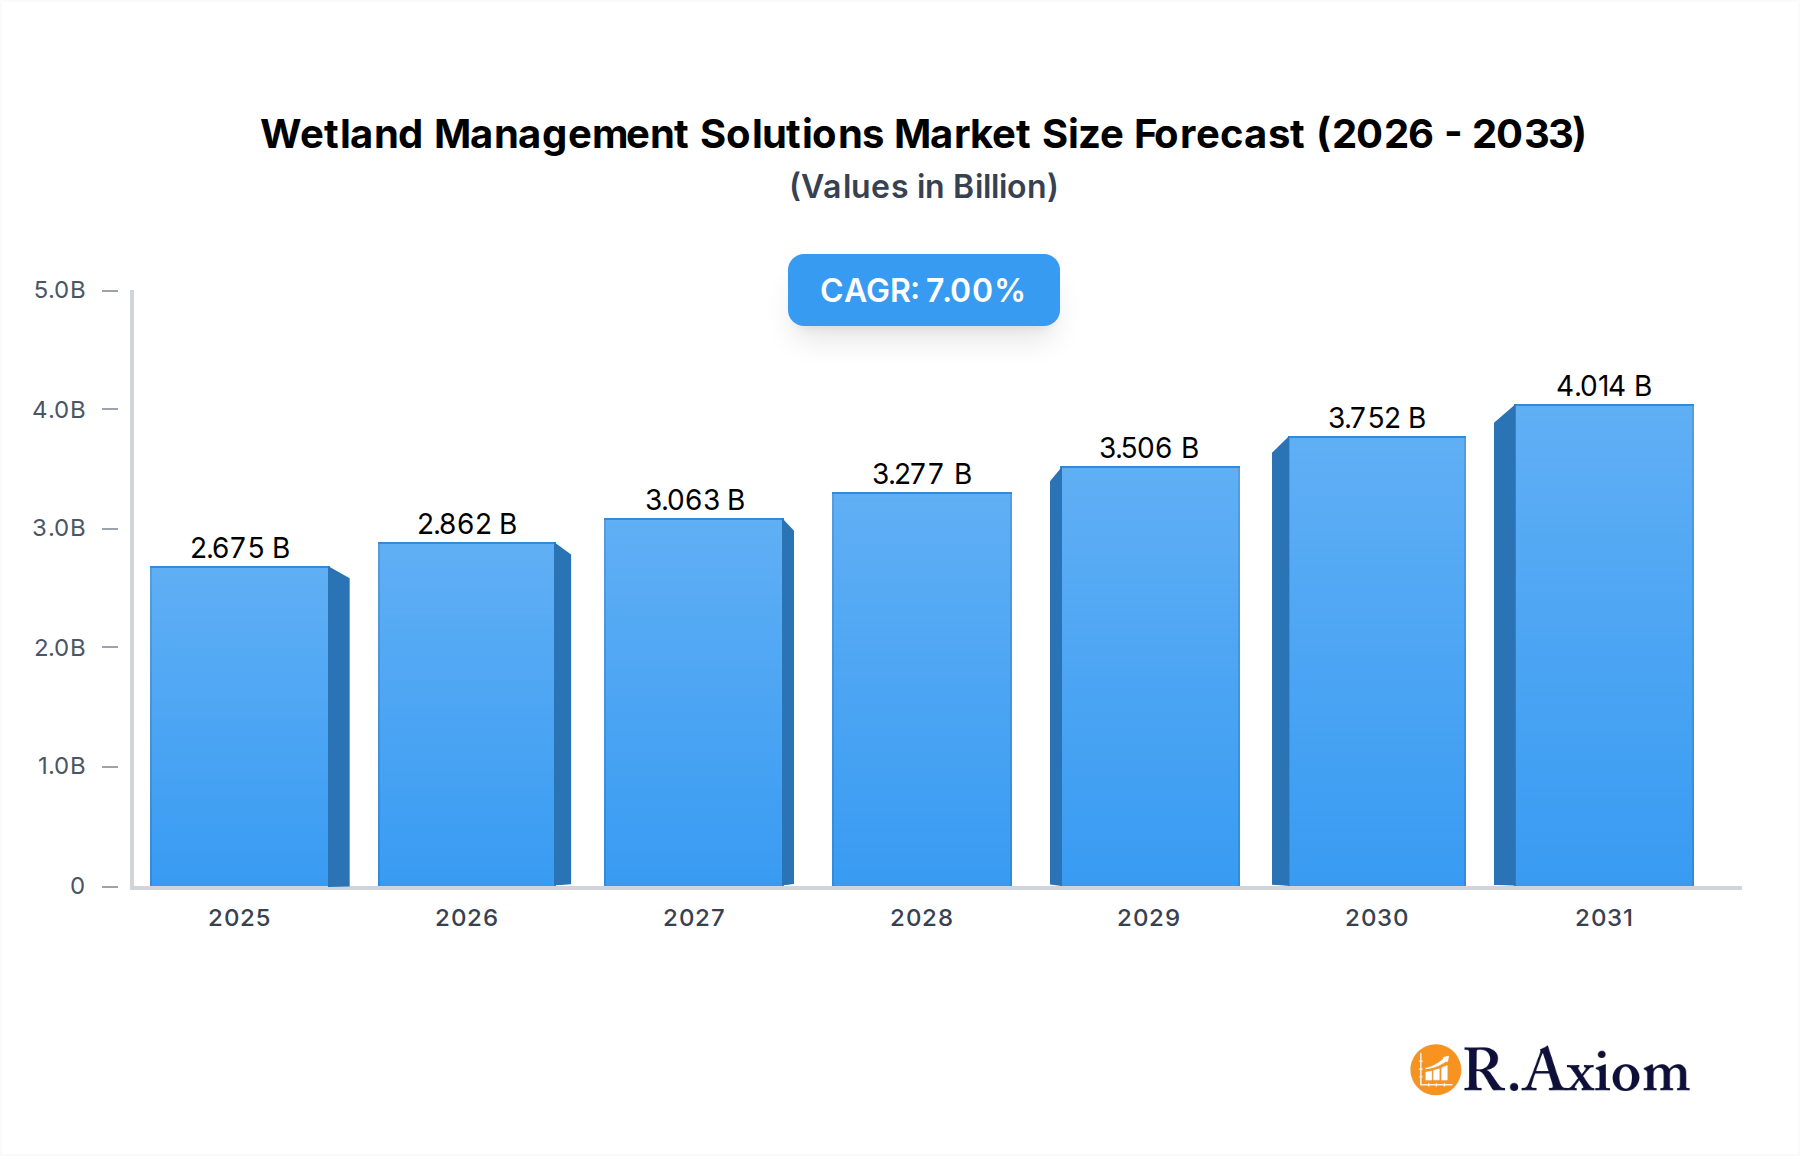
Wetland Management Solutions Market Size (In Billion)

Restoration & Rehabilitation Services Segment in Wetland Management Solutions
The Restoration & Rehabilitation services segment currently holds a dominant position within the global Wetland Management Solutions Market, representing the largest revenue share. This dominance is primarily attributable to the extensive degradation of natural wetlands globally, necessitating significant intervention to restore their ecological functions and biodiversity. Activities within this segment include hydrological restoration, soil amendment, native vegetation planting, invasive species control, and the creation of new wetland habitats. The imperative for these services often arises from regulatory mandates, such as compensatory mitigation requirements where developers are required to offset wetland impacts from their projects. This contractual demand provides a stable and substantial revenue stream for firms operating in the Restoration Services Market. Furthermore, the increasing global recognition of wetlands as critical infrastructure for climate resilience – acting as natural flood buffers, carbon sinks, and water filters – fuels public and private investment into large-scale restoration initiatives. The complexity and multidisciplinary nature of restoration projects, requiring expertise in hydrology, ecology, soil science, and engineering, command premium service fees. Key players in this segment are often large environmental consulting firms and specialized ecological restoration companies that can manage intricate, long-term projects. As technological advancements in geospatial mapping and data analytics continue to evolve, the precision and effectiveness of restoration efforts are improving, further solidifying the segment's value proposition. The demand for these services is anticipated to remain strong, driven by ongoing environmental degradation and a concerted global push towards achieving biodiversity targets and mitigating climate change impacts. The intertwining with the broader Biodiversity Conservation Market ensures sustained funding and policy support for these essential services. The Environmental Monitoring Market plays a crucial supporting role, providing the data necessary to plan, implement, and verify the success of restoration and rehabilitation projects, thus indirectly influencing the scale and scope of activities within this dominant segment. This symbiotic relationship ensures that interventions are data-driven and outcomes-focused, reinforcing the value of specialized restoration expertise.
Wetland Management Solutions Company Market Share
Key Market Drivers for Wetland Management Solutions Growth
The expansion of the Wetland Management Solutions Market is primarily propelled by several critical factors, each exerting quantifiable influence. First, increasingly stringent environmental regulations and policy frameworks across major economies mandate the protection, restoration, and creation of wetlands. For instance, the enforcement of compensatory mitigation policies for infrastructure development—where wetland impacts must be offset—drives significant project volumes. Data from national environmental agencies consistently show a rise in permit applications requiring wetland assessments and mitigation plans, directly stimulating the market. Second, the escalating impacts of climate change, including more frequent and intense flooding events, droughts, and sea-level rise, highlight wetlands' crucial role in climate adaptation and mitigation. Funding allocations for nature-based solutions, which often include wetland restoration for carbon sequestration and flood protection, have seen a year-over-year increase, reflecting a growing governmental and societal commitment. The Wastewater Treatment Market also serves as a driver, as constructed wetlands are increasingly utilized as cost-effective, natural wastewater treatment systems, particularly in rural or developing regions. Third, growing public and scientific awareness of biodiversity loss and the ecological services provided by wetlands (e.g., water purification, habitat provision) translates into increased investment from NGOs, trusts, and corporate social responsibility initiatives. Studies continuously report alarming rates of wetland loss globally, which in turn catalyzes more aggressive conservation and restoration efforts. Furthermore, the relentless pace of urbanization and industrial development necessitates sophisticated Drainage Systems Market solutions adjacent to wetlands and robust environmental impact assessments, often leading to mandates for wetland management or creation to offset habitat loss. This demand is particularly pronounced in rapidly developing regions like Asia Pacific, where economic expansion often encroaches upon natural ecosystems. The synergy of these drivers creates a resilient and expanding demand landscape for comprehensive wetland management solutions, from initial assessment and planning to long-term maintenance and monitoring. The integration of advanced Geospatial Technology Market offerings for precise mapping and analysis further enhances the efficiency and effectiveness of these efforts, making wetland projects more viable and impactful. Each of these drivers presents tangible opportunities for market participants.
Pricing Dynamics & Margin Pressure in Wetland Management Solutions
Pricing dynamics within the Wetland Management Solutions Market are complex, influenced by project scope, regulatory demands, specialized expertise, and regional market competitiveness. Average selling prices (ASPs) for comprehensive wetland restoration projects can vary significantly, ranging from tens of thousands for smaller mitigation banks to several millions for large-scale hydrological and ecological re-engineering efforts. Consulting and assessment services are typically priced on a time-and-materials basis or fixed-fee per project, while long-term conservation and monitoring contracts may involve recurring annual fees. Margin structures across the value chain reflect the intensity of capital investment, labor specialization, and technological integration. Design and engineering firms, leveraging advanced Geospatial Technology Market for precise mapping and hydrological modeling, often command higher margins due to their intellectual property and specialized expertise. Conversely, the implementation phase, which involves significant earthmoving, planting, and material procurement, can be more susceptible to margin pressure from commodity cycles (e.g., fuel for heavy machinery, prices for native plant stock) and competitive bidding. Key cost levers include labor (highly skilled ecologists, hydrologists, engineers), specialized equipment, permits, and, increasingly, advanced data analytics and remote sensing technologies. Competitive intensity is a significant factor; in mature markets like North America and Europe, an established base of providers can lead to tighter bidding and reduced pricing power for less differentiated services. However, niche providers offering proprietary restoration techniques or advanced monitoring solutions can maintain stronger margins. Regulatory changes, such as stricter permitting requirements or new mitigation banking rules, can also influence pricing by increasing project complexity and associated costs, which are often passed on to clients. Furthermore, the long-term nature of many wetland projects introduces risks related to unforeseen site conditions or changes in environmental standards, necessitating contingency planning and potentially affecting overall profitability. The interplay between regulatory drivers and technological innovation means that firms capable of delivering cost-effective, scientifically robust, and compliant solutions are best positioned to navigate these pricing pressures and secure sustainable margins in the Wetland Management Solutions Market.
Supply Chain & Raw Material Dynamics for Wetland Management Solutions
The supply chain for the Wetland Management Solutions Market is characterized by a blend of specialized components, services, and raw materials, posing unique challenges and opportunities. Upstream dependencies are significant, relying heavily on nurseries for native plant species, specialized equipment manufacturers (e.g., for hydrological modification, sediment removal), and providers of advanced Environmental Monitoring Market technologies. Sourcing risks are notable, particularly for genetically appropriate native plant stock, which often requires lead times for propagation and can be susceptible to regional climatic variations or disease. Price volatility for key inputs, such as diesel fuel for heavy machinery, various soil amendments (e.g., compost, biochar), and specific geosynthetics used for erosion control or habitat creation, can directly impact project costs and contractor margins. For instance, global commodity fluctuations in petroleum can drive up transportation and operational costs for machinery, while demand spikes for specific native species can elevate their prices. Supply chain disruptions, historically observed during global events like pandemics or regional climate disasters, have highlighted vulnerabilities, leading to delays in project timelines and cost overruns. For example, disruptions in the Drainage Systems Market or difficulties in procuring specialized pumps and pipes can stall hydrological restoration components. The market also depends on the availability of highly skilled labor, including certified wetland scientists, hydrologists, and ecological engineers, whose scarcity in certain regions can act as a bottleneck. Data and technology inputs are increasingly critical; access to reliable Geospatial Technology Market platforms and remote sensing data is essential for accurate assessment, planning, and post-restoration monitoring. The supply of these high-tech services is generally less volatile but requires significant investment in R&D. Furthermore, the procurement of specific raw materials for constructed wetlands, such as gravel, sand, and clay liners, is subject to local availability and transportation costs. Firms are increasingly focused on developing resilient supply chains, often involving regional sourcing strategies and partnerships with local nurseries or material suppliers to mitigate risks and ensure timely project completion in the Wetland Management Solutions Market. This focus on localized and diversified sourcing helps to stabilize input costs and improve project predictability.
Competitive Ecosystem of Wetland Management Solutions
The competitive landscape of the Wetland Management Solutions Market is diverse, featuring a mix of specialized ecological firms, large environmental consultancies, and construction companies with dedicated environmental divisions. The market is fragmented, with regional players often holding strong positions due to localized expertise and established client relationships. No single entity dominates entirely, reflecting the varied nature and geographic specificity of wetland projects. Key companies include:
- SOLitude Lake Management: A leading provider of lake, pond, and wetland management services, offering comprehensive solutions for aquatic vegetation control, aeration, and restoration to a broad client base across North America.
- All Habitat Services: Specializes in ecological restoration, providing services like native plant installation, invasive species removal, and land management solutions tailored for diverse habitats, including wetlands.
- ILM Environments: Offers integrated land management and environmental services, focusing on ecological restoration, invasive species management, and habitat enhancement for governmental and private clients.
- WWT Consulting: A specialist consultancy arm of the Wildfowl & Wetlands Trust, providing expert advice on wetland design, creation, and management, with a strong emphasis on biodiversity and water quality.
- Clear Environmental: Delivers environmental consulting and construction services, including wetland assessments, mitigation planning, and ecological restoration, supporting clients in various sectors like energy and infrastructure.
- Rimmer Environmental Consulting: Provides environmental consulting services with expertise in wetland delineation, permitting, and mitigation design, assisting clients through complex regulatory processes.
- Allstate Resource Management: Focuses on ecological restoration, invasive plant management, and sustainable land stewardship, offering tailored solutions for wetland ecosystems.
- Dragonfly Pond Works: Specializes in pond and lake management, extending services to include wetland planting, erosion control, and overall aquatic ecosystem health.
- Applied Aquatic Management: Offers comprehensive aquatic management services, including wetland and shoreline restoration, vegetation control, and water quality improvement programs for commercial and municipal clients.
- Clear Lakes and Wetland Services: Provides expertise in maintaining and restoring aquatic environments, focusing on sustainable practices for ponds, lakes, and wetlands.
- AMW: An environmental engineering and consulting firm, often involved in water resource management, stormwater solutions, and wetland engineering for urban and industrial developments.
- Civil & Environmental Consultants: A national engineering and environmental consulting firm offering a wide range of services, including wetland permitting, mitigation, and ecological restoration.
This ecosystem is characterized by firms that combine scientific expertise with practical implementation capabilities, critical for successful outcomes in the Wetland Management Solutions Market.
Recent Developments & Milestones in Wetland Management Solutions
The Wetland Management Solutions Market is continuously evolving with new scientific understanding, technological advancements, and policy shifts. While specific company-level developments from the provided data are not available, general market milestones reflect broader trends:
- May 2024: Growing integration of Artificial Intelligence (AI) and machine learning algorithms for predictive modeling in wetland hydrology and ecological forecasting, enhancing the efficiency of Environmental Monitoring Market systems. This allows for more proactive management and early detection of environmental stressors.
- February 2024: Increased adoption of drone technology and satellite imagery for large-scale wetland mapping and health assessment. This advancement in Geospatial Technology Market applications offers cost-effective and highly accurate data collection, streamlining baseline assessments and post-restoration monitoring efforts.
- November 2023: Emerging partnerships between public agencies and private sector companies to leverage private investment for large-scale wetland mitigation banking projects, accelerating the pace of Restoration Services Market growth.
- September 2023: New regulatory guidelines proposed in several regions emphasize nature-based solutions for stormwater management and flood control, directly promoting the creation and restoration of wetlands as critical green infrastructure components.
- July 2023: Breakthroughs in phytoremediation techniques utilizing specific wetland plant species for enhanced contaminant removal, expanding the role of wetlands in Wastewater Treatment Market applications.
- April 2023: Significant research funding allocated towards understanding the carbon sequestration potential of various wetland types, paving the way for wetlands to play a more prominent role in global climate change mitigation strategies.
- January 2023: Launch of new industry standards for native plant propagation and ecological planting techniques, aiming to improve the success rates and ecological integrity of Ecological Restoration Market projects in wetland environments.
These developments collectively underscore the market's dynamic nature and its increasing reliance on innovation to address pressing environmental challenges within the Wetland Management Solutions Market.
Regional Market Breakdown for Wetland Management Solutions
The global Wetland Management Solutions Market exhibits distinct regional dynamics, influenced by varying regulatory landscapes, economic development, and environmental pressures. North America currently commands a significant revenue share, primarily driven by established environmental protection agencies (like the EPA in the U.S.) and mature regulatory frameworks such as the Clean Water Act, which mandate wetland protection and compensatory mitigation. The region's market is characterized by a robust private sector actively involved in mitigation banking and restoration projects, demonstrating a moderate CAGR of approximately 6.5%. This maturity is evident in the prevalence of advanced Environmental Monitoring Market and Geospatial Technology Market adoption for precise management.
Europe also holds a substantial market share, propelled by directives like the EU Water Framework Directive and the Habitats Directive, which prioritize wetland conservation and water quality improvement. European nations show a strong emphasis on Biodiversity Conservation Market initiatives, integrating wetland management into broader ecological networks. The region experiences a steady CAGR of around 6%, reflecting consistent governmental and NGO investment in ecological restoration and sustainable land use.
Asia Pacific is identified as the fastest-growing region, projected to achieve a CAGR of approximately 9%. This rapid expansion is fueled by accelerated industrialization, urbanization, and agricultural expansion, which have historically led to extensive wetland degradation. However, increasing environmental awareness, coupled with the introduction of new or strengthened environmental regulations in countries like China and India, is driving a surge in demand for restoration, assessment, and management services. The nascent but rapidly expanding Water Management Market in the region necessitates significant wetland solutions for both water quality and flood control.
Middle East & Africa, while representing a smaller current market share, is experiencing a moderate-to-high growth rate of around 7.5%. This growth is primarily driven by the impacts of rapid resource extraction (e.g., oil and gas, mining) and large-scale infrastructure projects, which necessitate environmental impact assessments and compensatory wetland mitigation. Emerging regulatory frameworks and increasing recognition of water scarcity issues are also contributing to the demand for sustainable Water Management Market solutions, including wetland creation and restoration, across the region for Wetland Management Solutions.
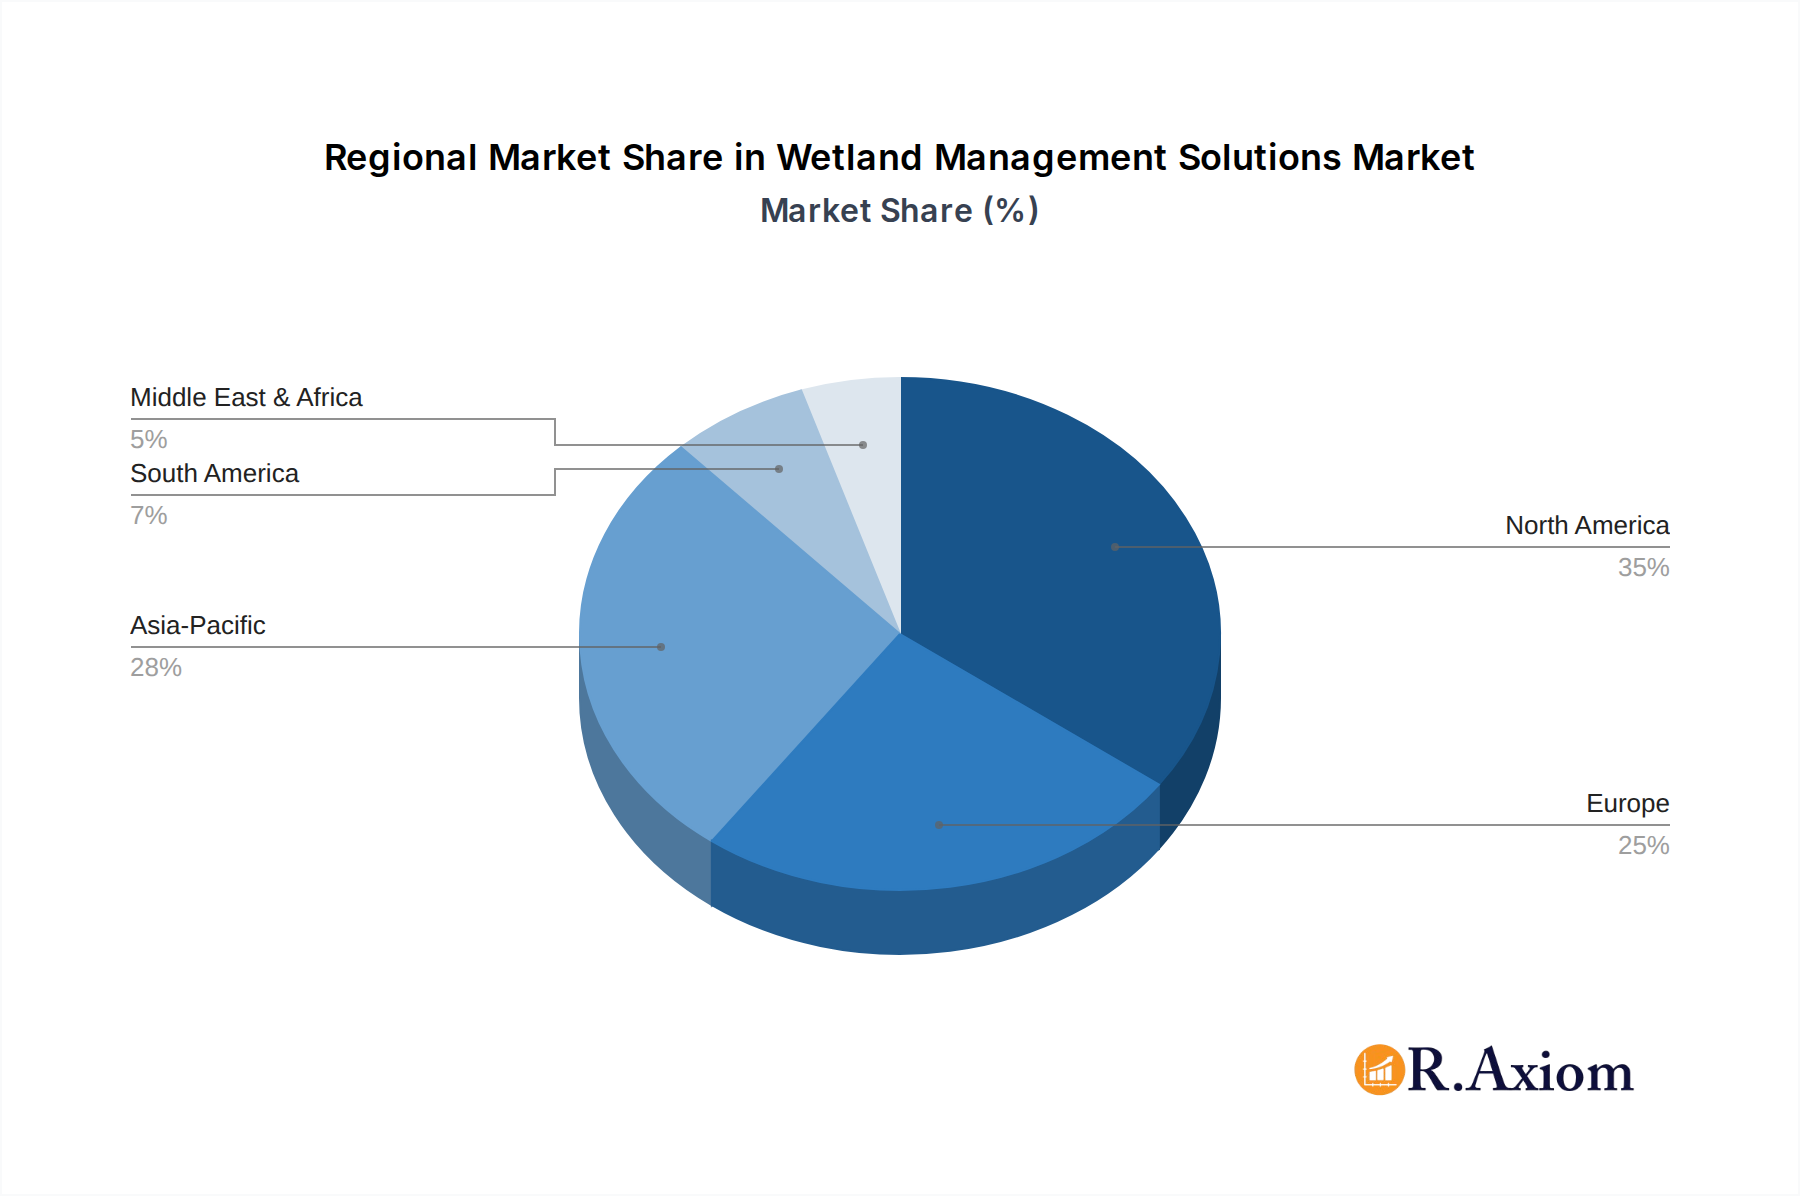
Wetland Management Solutions Regional Market Share
Wetland Management Solutions Segmentation
-
1. Service Type
- 1.1. Restoration & Rehabilitation
- 1.2. Conservation
- 1.3. Assessment, Mapping, & Monitoring
- 1.4. Consulting and Planning
- 1.5. Others
-
2. Wetland Type
- 2.1. Natural Wetlands
- 2.2. Constructed/Artificial Wetlands
-
3. Application
- 3.1. Commercial
- 3.2. Municipal
-
4. End User
- 4.1. Government & Public Agencies
- 4.2. Mining, Energy, & Infrastructure
- 4.3. Agriculture & Forestry
- 4.4. Water & Wastewater Treatment Utilities
- 4.5. NGOs & Trusts
- 4.6. Others
Wetland Management Solutions Segmentation By Geography
-
1. North America
- 1.1. United States
- 1.2. Canada
- 1.3. Mexico
-
2. South America
- 2.1. Brazil
- 2.2. Argentina
- 2.3. Rest of South America
-
3. Europe
- 3.1. United Kingdom
- 3.2. Germany
- 3.3. France
- 3.4. Italy
- 3.5. Spain
- 3.6. Russia
- 3.7. Benelux
- 3.8. Nordics
- 3.9. Rest of Europe
-
4. Middle East & Africa
- 4.1. Turkey
- 4.2. Israel
- 4.3. GCC
- 4.4. North Africa
- 4.5. South Africa
- 4.6. Rest of Middle East & Africa
-
5. Asia Pacific
- 5.1. China
- 5.2. India
- 5.3. Japan
- 5.4. South Korea
- 5.5. ASEAN
- 5.6. Oceania
- 5.7. Rest of Asia Pacific
Wetland Management Solutions Regional Market Share
Geographic Coverage of Wetland Management Solutions
Wetland Management Solutions REPORT HIGHLIGHTS
| Aspects | Details |
|---|---|
| Study Period | 2020-2034 |
| Base Year | 2025 |
| Estimated Year | 2026 |
| Forecast Period | 2026-2034 |
| Historical Period | 2020-2025 |
| Growth Rate | CAGR of 7% from 2020-2034 |
| Segmentation |
|
Table of Contents
- 1. Introduction
- 1.1. Research Scope
- 1.2. Market Segmentation
- 1.3. Research Objective
- 1.4. Definitions and Assumptions
- 2. Executive Summary
- 2.1. Market Snapshot
- 3. Market Dynamics
- 3.1. Market Drivers
- 3.2. Market Restrains
- 3.3. Market Trends
- 3.4. Market Opportunities
- 4. Market Factor Analysis
- 4.1. Porters Five Forces
- 4.1.1. Bargaining Power of Suppliers
- 4.1.2. Bargaining Power of Buyers
- 4.1.3. Threat of New Entrants
- 4.1.4. Threat of Substitutes
- 4.1.5. Competitive Rivalry
- 4.2. PESTEL analysis
- 4.3. BCG Analysis
- 4.3.1. Stars (High Growth, High Market Share)
- 4.3.2. Cash Cows (Low Growth, High Market Share)
- 4.3.3. Question Mark (High Growth, Low Market Share)
- 4.3.4. Dogs (Low Growth, Low Market Share)
- 4.4. Ansoff Matrix Analysis
- 4.5. Supply Chain Analysis
- 4.6. Regulatory Landscape
- 4.7. Current Market Potential and Opportunity Assessment (TAM–SAM–SOM Framework)
- 4.8. RAX Analyst Note
- 4.1. Porters Five Forces
- 5. Market Analysis, Insights and Forecast 2021-2033
- 5.1. Market Analysis, Insights and Forecast - by Service Type
- 5.1.1. Restoration & Rehabilitation
- 5.1.2. Conservation
- 5.1.3. Assessment, Mapping, & Monitoring
- 5.1.4. Consulting and Planning
- 5.1.5. Others
- 5.2. Market Analysis, Insights and Forecast - by Wetland Type
- 5.2.1. Natural Wetlands
- 5.2.2. Constructed/Artificial Wetlands
- 5.3. Market Analysis, Insights and Forecast - by Application
- 5.3.1. Commercial
- 5.3.2. Municipal
- 5.4. Market Analysis, Insights and Forecast - by End User
- 5.4.1. Government & Public Agencies
- 5.4.2. Mining, Energy, & Infrastructure
- 5.4.3. Agriculture & Forestry
- 5.4.4. Water & Wastewater Treatment Utilities
- 5.4.5. NGOs & Trusts
- 5.4.6. Others
- 5.5. Market Analysis, Insights and Forecast - by Region
- 5.5.1. North America
- 5.5.2. South America
- 5.5.3. Europe
- 5.5.4. Middle East & Africa
- 5.5.5. Asia Pacific
- 5.1. Market Analysis, Insights and Forecast - by Service Type
- 6. Global Wetland Management Solutions Analysis, Insights and Forecast, 2021-2033
- 6.1. Market Analysis, Insights and Forecast - by Service Type
- 6.1.1. Restoration & Rehabilitation
- 6.1.2. Conservation
- 6.1.3. Assessment, Mapping, & Monitoring
- 6.1.4. Consulting and Planning
- 6.1.5. Others
- 6.2. Market Analysis, Insights and Forecast - by Wetland Type
- 6.2.1. Natural Wetlands
- 6.2.2. Constructed/Artificial Wetlands
- 6.3. Market Analysis, Insights and Forecast - by Application
- 6.3.1. Commercial
- 6.3.2. Municipal
- 6.4. Market Analysis, Insights and Forecast - by End User
- 6.4.1. Government & Public Agencies
- 6.4.2. Mining, Energy, & Infrastructure
- 6.4.3. Agriculture & Forestry
- 6.4.4. Water & Wastewater Treatment Utilities
- 6.4.5. NGOs & Trusts
- 6.4.6. Others
- 6.1. Market Analysis, Insights and Forecast - by Service Type
- 7. North America Wetland Management Solutions Analysis, Insights and Forecast, 2020-2032
- 7.1. Market Analysis, Insights and Forecast - by Service Type
- 7.1.1. Restoration & Rehabilitation
- 7.1.2. Conservation
- 7.1.3. Assessment, Mapping, & Monitoring
- 7.1.4. Consulting and Planning
- 7.1.5. Others
- 7.2. Market Analysis, Insights and Forecast - by Wetland Type
- 7.2.1. Natural Wetlands
- 7.2.2. Constructed/Artificial Wetlands
- 7.3. Market Analysis, Insights and Forecast - by Application
- 7.3.1. Commercial
- 7.3.2. Municipal
- 7.4. Market Analysis, Insights and Forecast - by End User
- 7.4.1. Government & Public Agencies
- 7.4.2. Mining, Energy, & Infrastructure
- 7.4.3. Agriculture & Forestry
- 7.4.4. Water & Wastewater Treatment Utilities
- 7.4.5. NGOs & Trusts
- 7.4.6. Others
- 7.1. Market Analysis, Insights and Forecast - by Service Type
- 8. South America Wetland Management Solutions Analysis, Insights and Forecast, 2020-2032
- 8.1. Market Analysis, Insights and Forecast - by Service Type
- 8.1.1. Restoration & Rehabilitation
- 8.1.2. Conservation
- 8.1.3. Assessment, Mapping, & Monitoring
- 8.1.4. Consulting and Planning
- 8.1.5. Others
- 8.2. Market Analysis, Insights and Forecast - by Wetland Type
- 8.2.1. Natural Wetlands
- 8.2.2. Constructed/Artificial Wetlands
- 8.3. Market Analysis, Insights and Forecast - by Application
- 8.3.1. Commercial
- 8.3.2. Municipal
- 8.4. Market Analysis, Insights and Forecast - by End User
- 8.4.1. Government & Public Agencies
- 8.4.2. Mining, Energy, & Infrastructure
- 8.4.3. Agriculture & Forestry
- 8.4.4. Water & Wastewater Treatment Utilities
- 8.4.5. NGOs & Trusts
- 8.4.6. Others
- 8.1. Market Analysis, Insights and Forecast - by Service Type
- 9. Europe Wetland Management Solutions Analysis, Insights and Forecast, 2020-2032
- 9.1. Market Analysis, Insights and Forecast - by Service Type
- 9.1.1. Restoration & Rehabilitation
- 9.1.2. Conservation
- 9.1.3. Assessment, Mapping, & Monitoring
- 9.1.4. Consulting and Planning
- 9.1.5. Others
- 9.2. Market Analysis, Insights and Forecast - by Wetland Type
- 9.2.1. Natural Wetlands
- 9.2.2. Constructed/Artificial Wetlands
- 9.3. Market Analysis, Insights and Forecast - by Application
- 9.3.1. Commercial
- 9.3.2. Municipal
- 9.4. Market Analysis, Insights and Forecast - by End User
- 9.4.1. Government & Public Agencies
- 9.4.2. Mining, Energy, & Infrastructure
- 9.4.3. Agriculture & Forestry
- 9.4.4. Water & Wastewater Treatment Utilities
- 9.4.5. NGOs & Trusts
- 9.4.6. Others
- 9.1. Market Analysis, Insights and Forecast - by Service Type
- 10. Middle East & Africa Wetland Management Solutions Analysis, Insights and Forecast, 2020-2032
- 10.1. Market Analysis, Insights and Forecast - by Service Type
- 10.1.1. Restoration & Rehabilitation
- 10.1.2. Conservation
- 10.1.3. Assessment, Mapping, & Monitoring
- 10.1.4. Consulting and Planning
- 10.1.5. Others
- 10.2. Market Analysis, Insights and Forecast - by Wetland Type
- 10.2.1. Natural Wetlands
- 10.2.2. Constructed/Artificial Wetlands
- 10.3. Market Analysis, Insights and Forecast - by Application
- 10.3.1. Commercial
- 10.3.2. Municipal
- 10.4. Market Analysis, Insights and Forecast - by End User
- 10.4.1. Government & Public Agencies
- 10.4.2. Mining, Energy, & Infrastructure
- 10.4.3. Agriculture & Forestry
- 10.4.4. Water & Wastewater Treatment Utilities
- 10.4.5. NGOs & Trusts
- 10.4.6. Others
- 10.1. Market Analysis, Insights and Forecast - by Service Type
- 11. Asia Pacific Wetland Management Solutions Analysis, Insights and Forecast, 2020-2032
- 11.1. Market Analysis, Insights and Forecast - by Service Type
- 11.1.1. Restoration & Rehabilitation
- 11.1.2. Conservation
- 11.1.3. Assessment, Mapping, & Monitoring
- 11.1.4. Consulting and Planning
- 11.1.5. Others
- 11.2. Market Analysis, Insights and Forecast - by Wetland Type
- 11.2.1. Natural Wetlands
- 11.2.2. Constructed/Artificial Wetlands
- 11.3. Market Analysis, Insights and Forecast - by Application
- 11.3.1. Commercial
- 11.3.2. Municipal
- 11.4. Market Analysis, Insights and Forecast - by End User
- 11.4.1. Government & Public Agencies
- 11.4.2. Mining, Energy, & Infrastructure
- 11.4.3. Agriculture & Forestry
- 11.4.4. Water & Wastewater Treatment Utilities
- 11.4.5. NGOs & Trusts
- 11.4.6. Others
- 11.1. Market Analysis, Insights and Forecast - by Service Type
- 12. Competitive Analysis
- 12.1. Company Profiles
- 12.1.1 SOLitude Lake Management
- 12.1.1.1. Company Overview
- 12.1.1.2. Products
- 12.1.1.3. Company Financials
- 12.1.1.4. SWOT Analysis
- 12.1.2 All Habitat Services
- 12.1.2.1. Company Overview
- 12.1.2.2. Products
- 12.1.2.3. Company Financials
- 12.1.2.4. SWOT Analysis
- 12.1.3 ILM Environments
- 12.1.3.1. Company Overview
- 12.1.3.2. Products
- 12.1.3.3. Company Financials
- 12.1.3.4. SWOT Analysis
- 12.1.4 WWT Consulting
- 12.1.4.1. Company Overview
- 12.1.4.2. Products
- 12.1.4.3. Company Financials
- 12.1.4.4. SWOT Analysis
- 12.1.5 Clear Environmental
- 12.1.5.1. Company Overview
- 12.1.5.2. Products
- 12.1.5.3. Company Financials
- 12.1.5.4. SWOT Analysis
- 12.1.6 Rimmer Environmental Consulting
- 12.1.6.1. Company Overview
- 12.1.6.2. Products
- 12.1.6.3. Company Financials
- 12.1.6.4. SWOT Analysis
- 12.1.7 Allstate Resource Management
- 12.1.7.1. Company Overview
- 12.1.7.2. Products
- 12.1.7.3. Company Financials
- 12.1.7.4. SWOT Analysis
- 12.1.8 Dragonfly Pond Works
- 12.1.8.1. Company Overview
- 12.1.8.2. Products
- 12.1.8.3. Company Financials
- 12.1.8.4. SWOT Analysis
- 12.1.9 Applied Aquatic Management
- 12.1.9.1. Company Overview
- 12.1.9.2. Products
- 12.1.9.3. Company Financials
- 12.1.9.4. SWOT Analysis
- 12.1.10 Clear Lakes and Wetland Services
- 12.1.10.1. Company Overview
- 12.1.10.2. Products
- 12.1.10.3. Company Financials
- 12.1.10.4. SWOT Analysis
- 12.1.11 AMW
- 12.1.11.1. Company Overview
- 12.1.11.2. Products
- 12.1.11.3. Company Financials
- 12.1.11.4. SWOT Analysis
- 12.1.12 Civil & Environmental Consultants
- 12.1.12.1. Company Overview
- 12.1.12.2. Products
- 12.1.12.3. Company Financials
- 12.1.12.4. SWOT Analysis
- 12.1.1 SOLitude Lake Management
- 12.2. Market Entropy
- 12.2.1 Company's Key Areas Served
- 12.2.2 Recent Developments
- 12.3. Company Market Share Analysis 2025
- 12.3.1 Top 5 Companies Market Share Analysis
- 12.3.2 Top 3 Companies Market Share Analysis
- 12.4. List of Potential Customers
- 13. Research Methodology
List of Figures
- Figure 1: Global Wetland Management Solutions Revenue Breakdown (billion, %) by Region 2025 & 2033
- Figure 2: North America Wetland Management Solutions Revenue (billion), by Service Type 2025 & 2033
- Figure 3: North America Wetland Management Solutions Revenue Share (%), by Service Type 2025 & 2033
- Figure 4: North America Wetland Management Solutions Revenue (billion), by Wetland Type 2025 & 2033
- Figure 5: North America Wetland Management Solutions Revenue Share (%), by Wetland Type 2025 & 2033
- Figure 6: North America Wetland Management Solutions Revenue (billion), by Application 2025 & 2033
- Figure 7: North America Wetland Management Solutions Revenue Share (%), by Application 2025 & 2033
- Figure 8: North America Wetland Management Solutions Revenue (billion), by End User 2025 & 2033
- Figure 9: North America Wetland Management Solutions Revenue Share (%), by End User 2025 & 2033
- Figure 10: North America Wetland Management Solutions Revenue (billion), by Country 2025 & 2033
- Figure 11: North America Wetland Management Solutions Revenue Share (%), by Country 2025 & 2033
- Figure 12: South America Wetland Management Solutions Revenue (billion), by Service Type 2025 & 2033
- Figure 13: South America Wetland Management Solutions Revenue Share (%), by Service Type 2025 & 2033
- Figure 14: South America Wetland Management Solutions Revenue (billion), by Wetland Type 2025 & 2033
- Figure 15: South America Wetland Management Solutions Revenue Share (%), by Wetland Type 2025 & 2033
- Figure 16: South America Wetland Management Solutions Revenue (billion), by Application 2025 & 2033
- Figure 17: South America Wetland Management Solutions Revenue Share (%), by Application 2025 & 2033
- Figure 18: South America Wetland Management Solutions Revenue (billion), by End User 2025 & 2033
- Figure 19: South America Wetland Management Solutions Revenue Share (%), by End User 2025 & 2033
- Figure 20: South America Wetland Management Solutions Revenue (billion), by Country 2025 & 2033
- Figure 21: South America Wetland Management Solutions Revenue Share (%), by Country 2025 & 2033
- Figure 22: Europe Wetland Management Solutions Revenue (billion), by Service Type 2025 & 2033
- Figure 23: Europe Wetland Management Solutions Revenue Share (%), by Service Type 2025 & 2033
- Figure 24: Europe Wetland Management Solutions Revenue (billion), by Wetland Type 2025 & 2033
- Figure 25: Europe Wetland Management Solutions Revenue Share (%), by Wetland Type 2025 & 2033
- Figure 26: Europe Wetland Management Solutions Revenue (billion), by Application 2025 & 2033
- Figure 27: Europe Wetland Management Solutions Revenue Share (%), by Application 2025 & 2033
- Figure 28: Europe Wetland Management Solutions Revenue (billion), by End User 2025 & 2033
- Figure 29: Europe Wetland Management Solutions Revenue Share (%), by End User 2025 & 2033
- Figure 30: Europe Wetland Management Solutions Revenue (billion), by Country 2025 & 2033
- Figure 31: Europe Wetland Management Solutions Revenue Share (%), by Country 2025 & 2033
- Figure 32: Middle East & Africa Wetland Management Solutions Revenue (billion), by Service Type 2025 & 2033
- Figure 33: Middle East & Africa Wetland Management Solutions Revenue Share (%), by Service Type 2025 & 2033
- Figure 34: Middle East & Africa Wetland Management Solutions Revenue (billion), by Wetland Type 2025 & 2033
- Figure 35: Middle East & Africa Wetland Management Solutions Revenue Share (%), by Wetland Type 2025 & 2033
- Figure 36: Middle East & Africa Wetland Management Solutions Revenue (billion), by Application 2025 & 2033
- Figure 37: Middle East & Africa Wetland Management Solutions Revenue Share (%), by Application 2025 & 2033
- Figure 38: Middle East & Africa Wetland Management Solutions Revenue (billion), by End User 2025 & 2033
- Figure 39: Middle East & Africa Wetland Management Solutions Revenue Share (%), by End User 2025 & 2033
- Figure 40: Middle East & Africa Wetland Management Solutions Revenue (billion), by Country 2025 & 2033
- Figure 41: Middle East & Africa Wetland Management Solutions Revenue Share (%), by Country 2025 & 2033
- Figure 42: Asia Pacific Wetland Management Solutions Revenue (billion), by Service Type 2025 & 2033
- Figure 43: Asia Pacific Wetland Management Solutions Revenue Share (%), by Service Type 2025 & 2033
- Figure 44: Asia Pacific Wetland Management Solutions Revenue (billion), by Wetland Type 2025 & 2033
- Figure 45: Asia Pacific Wetland Management Solutions Revenue Share (%), by Wetland Type 2025 & 2033
- Figure 46: Asia Pacific Wetland Management Solutions Revenue (billion), by Application 2025 & 2033
- Figure 47: Asia Pacific Wetland Management Solutions Revenue Share (%), by Application 2025 & 2033
- Figure 48: Asia Pacific Wetland Management Solutions Revenue (billion), by End User 2025 & 2033
- Figure 49: Asia Pacific Wetland Management Solutions Revenue Share (%), by End User 2025 & 2033
- Figure 50: Asia Pacific Wetland Management Solutions Revenue (billion), by Country 2025 & 2033
- Figure 51: Asia Pacific Wetland Management Solutions Revenue Share (%), by Country 2025 & 2033
List of Tables
- Table 1: Global Wetland Management Solutions Revenue billion Forecast, by Service Type 2020 & 2033
- Table 2: Global Wetland Management Solutions Revenue billion Forecast, by Wetland Type 2020 & 2033
- Table 3: Global Wetland Management Solutions Revenue billion Forecast, by Application 2020 & 2033
- Table 4: Global Wetland Management Solutions Revenue billion Forecast, by End User 2020 & 2033
- Table 5: Global Wetland Management Solutions Revenue billion Forecast, by Region 2020 & 2033
- Table 6: Global Wetland Management Solutions Revenue billion Forecast, by Service Type 2020 & 2033
- Table 7: Global Wetland Management Solutions Revenue billion Forecast, by Wetland Type 2020 & 2033
- Table 8: Global Wetland Management Solutions Revenue billion Forecast, by Application 2020 & 2033
- Table 9: Global Wetland Management Solutions Revenue billion Forecast, by End User 2020 & 2033
- Table 10: Global Wetland Management Solutions Revenue billion Forecast, by Country 2020 & 2033
- Table 11: United States Wetland Management Solutions Revenue (billion) Forecast, by Application 2020 & 2033
- Table 12: Canada Wetland Management Solutions Revenue (billion) Forecast, by Application 2020 & 2033
- Table 13: Mexico Wetland Management Solutions Revenue (billion) Forecast, by Application 2020 & 2033
- Table 14: Global Wetland Management Solutions Revenue billion Forecast, by Service Type 2020 & 2033
- Table 15: Global Wetland Management Solutions Revenue billion Forecast, by Wetland Type 2020 & 2033
- Table 16: Global Wetland Management Solutions Revenue billion Forecast, by Application 2020 & 2033
- Table 17: Global Wetland Management Solutions Revenue billion Forecast, by End User 2020 & 2033
- Table 18: Global Wetland Management Solutions Revenue billion Forecast, by Country 2020 & 2033
- Table 19: Brazil Wetland Management Solutions Revenue (billion) Forecast, by Application 2020 & 2033
- Table 20: Argentina Wetland Management Solutions Revenue (billion) Forecast, by Application 2020 & 2033
- Table 21: Rest of South America Wetland Management Solutions Revenue (billion) Forecast, by Application 2020 & 2033
- Table 22: Global Wetland Management Solutions Revenue billion Forecast, by Service Type 2020 & 2033
- Table 23: Global Wetland Management Solutions Revenue billion Forecast, by Wetland Type 2020 & 2033
- Table 24: Global Wetland Management Solutions Revenue billion Forecast, by Application 2020 & 2033
- Table 25: Global Wetland Management Solutions Revenue billion Forecast, by End User 2020 & 2033
- Table 26: Global Wetland Management Solutions Revenue billion Forecast, by Country 2020 & 2033
- Table 27: United Kingdom Wetland Management Solutions Revenue (billion) Forecast, by Application 2020 & 2033
- Table 28: Germany Wetland Management Solutions Revenue (billion) Forecast, by Application 2020 & 2033
- Table 29: France Wetland Management Solutions Revenue (billion) Forecast, by Application 2020 & 2033
- Table 30: Italy Wetland Management Solutions Revenue (billion) Forecast, by Application 2020 & 2033
- Table 31: Spain Wetland Management Solutions Revenue (billion) Forecast, by Application 2020 & 2033
- Table 32: Russia Wetland Management Solutions Revenue (billion) Forecast, by Application 2020 & 2033
- Table 33: Benelux Wetland Management Solutions Revenue (billion) Forecast, by Application 2020 & 2033
- Table 34: Nordics Wetland Management Solutions Revenue (billion) Forecast, by Application 2020 & 2033
- Table 35: Rest of Europe Wetland Management Solutions Revenue (billion) Forecast, by Application 2020 & 2033
- Table 36: Global Wetland Management Solutions Revenue billion Forecast, by Service Type 2020 & 2033
- Table 37: Global Wetland Management Solutions Revenue billion Forecast, by Wetland Type 2020 & 2033
- Table 38: Global Wetland Management Solutions Revenue billion Forecast, by Application 2020 & 2033
- Table 39: Global Wetland Management Solutions Revenue billion Forecast, by End User 2020 & 2033
- Table 40: Global Wetland Management Solutions Revenue billion Forecast, by Country 2020 & 2033
- Table 41: Turkey Wetland Management Solutions Revenue (billion) Forecast, by Application 2020 & 2033
- Table 42: Israel Wetland Management Solutions Revenue (billion) Forecast, by Application 2020 & 2033
- Table 43: GCC Wetland Management Solutions Revenue (billion) Forecast, by Application 2020 & 2033
- Table 44: North Africa Wetland Management Solutions Revenue (billion) Forecast, by Application 2020 & 2033
- Table 45: South Africa Wetland Management Solutions Revenue (billion) Forecast, by Application 2020 & 2033
- Table 46: Rest of Middle East & Africa Wetland Management Solutions Revenue (billion) Forecast, by Application 2020 & 2033
- Table 47: Global Wetland Management Solutions Revenue billion Forecast, by Service Type 2020 & 2033
- Table 48: Global Wetland Management Solutions Revenue billion Forecast, by Wetland Type 2020 & 2033
- Table 49: Global Wetland Management Solutions Revenue billion Forecast, by Application 2020 & 2033
- Table 50: Global Wetland Management Solutions Revenue billion Forecast, by End User 2020 & 2033
- Table 51: Global Wetland Management Solutions Revenue billion Forecast, by Country 2020 & 2033
- Table 52: China Wetland Management Solutions Revenue (billion) Forecast, by Application 2020 & 2033
- Table 53: India Wetland Management Solutions Revenue (billion) Forecast, by Application 2020 & 2033
- Table 54: Japan Wetland Management Solutions Revenue (billion) Forecast, by Application 2020 & 2033
- Table 55: South Korea Wetland Management Solutions Revenue (billion) Forecast, by Application 2020 & 2033
- Table 56: ASEAN Wetland Management Solutions Revenue (billion) Forecast, by Application 2020 & 2033
- Table 57: Oceania Wetland Management Solutions Revenue (billion) Forecast, by Application 2020 & 2033
- Table 58: Rest of Asia Pacific Wetland Management Solutions Revenue (billion) Forecast, by Application 2020 & 2033
Frequently Asked Questions
1. What is the projected Compound Annual Growth Rate (CAGR) of the Wetland Management Solutions?
The projected CAGR is approximately 7%.
2. Which companies are prominent players in the Wetland Management Solutions?
Key companies in the market include SOLitude Lake Management, All Habitat Services, ILM Environments, WWT Consulting, Clear Environmental, Rimmer Environmental Consulting, Allstate Resource Management, Dragonfly Pond Works, Applied Aquatic Management, Clear Lakes and Wetland Services, AMW, Civil & Environmental Consultants.
3. What are the main segments of the Wetland Management Solutions?
The market segments include Service Type, Wetland Type, Application, End User.
4. Can you provide details about the market size?
The market size is estimated to be USD 2.5 billion as of 2022.
5. What are some drivers contributing to market growth?
N/A
6. What are the notable trends driving market growth?
N/A
7. Are there any restraints impacting market growth?
N/A
8. Can you provide examples of recent developments in the market?
N/A
9. What pricing options are available for accessing the report?
Pricing options include single-user, multi-user, and enterprise licenses priced at USD 2900.00, USD 4350.00, and USD 5800.00 respectively.
10. Is the market size provided in terms of value or volume?
The market size is provided in terms of value, measured in billion.
11. Are there any specific market keywords associated with the report?
Yes, the market keyword associated with the report is "Wetland Management Solutions," which aids in identifying and referencing the specific market segment covered.
12. How do I determine which pricing option suits my needs best?
The pricing options vary based on user requirements and access needs. Individual users may opt for single-user licenses, while businesses requiring broader access may choose multi-user or enterprise licenses for cost-effective access to the report.
13. Are there any additional resources or data provided in the Wetland Management Solutions report?
While the report offers comprehensive insights, it's advisable to review the specific contents or supplementary materials provided to ascertain if additional resources or data are available.
14. How can I stay updated on further developments or reports in the Wetland Management Solutions?
To stay informed about further developments, trends, and reports in the Wetland Management Solutions, consider subscribing to industry newsletters, following relevant companies and organizations, or regularly checking reputable industry news sources and publications.
Methodology
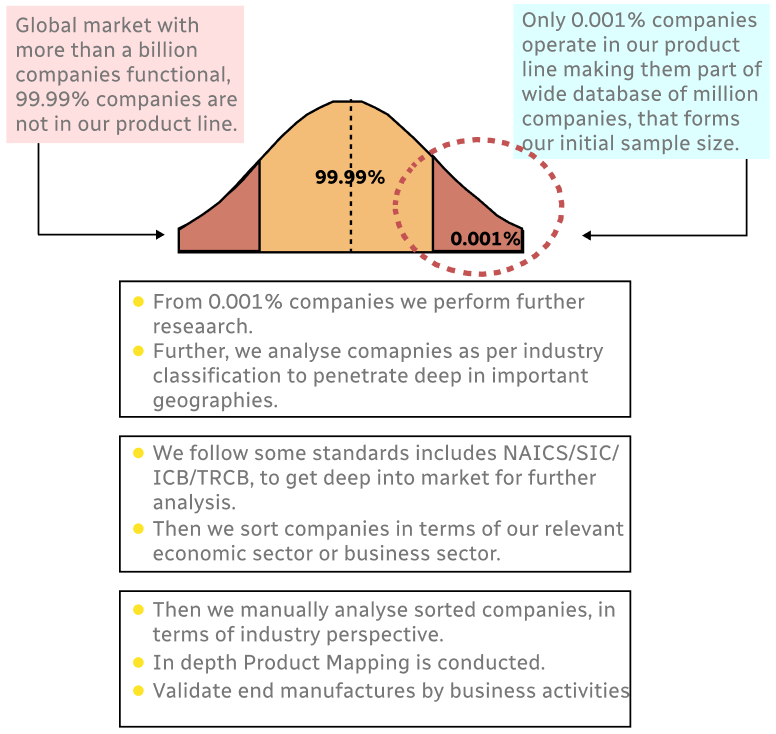
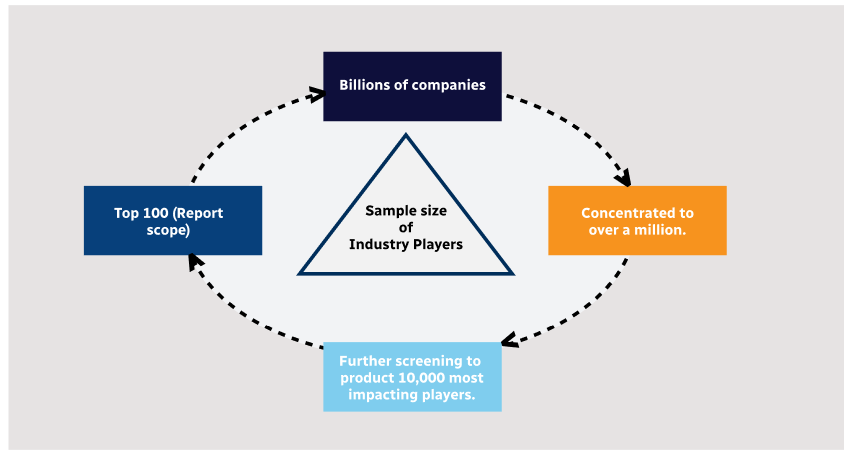
Step 1 - Identification of Relevant Samples Size from Population Database
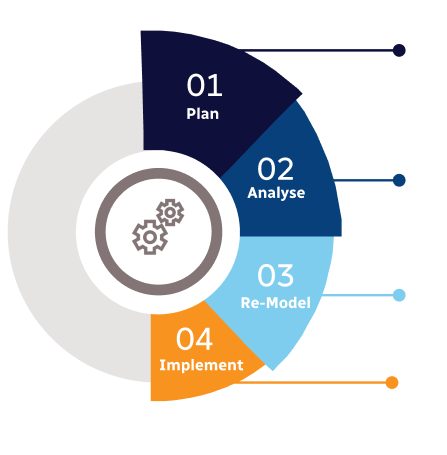
Step 2 - Approaches for Defining Global Market Size (Value, Volume* & Price*)
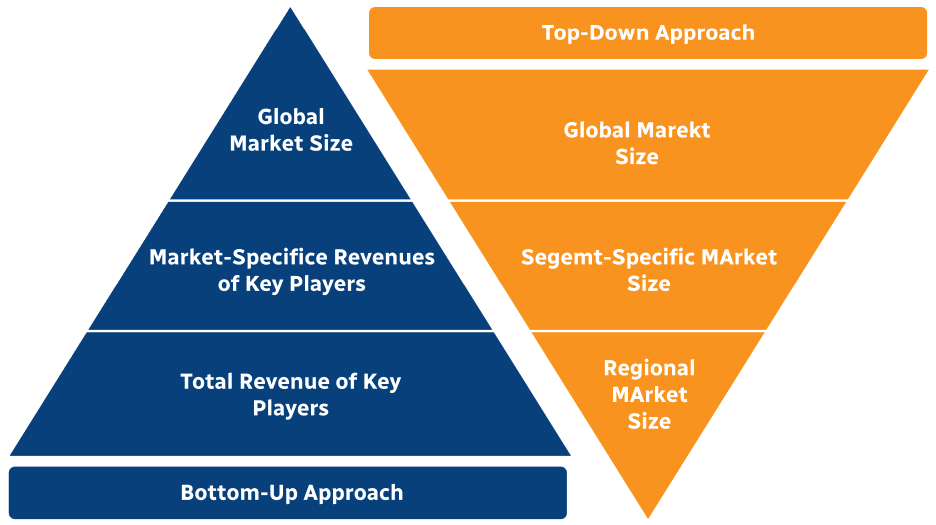
Note*: In applicable scenarios
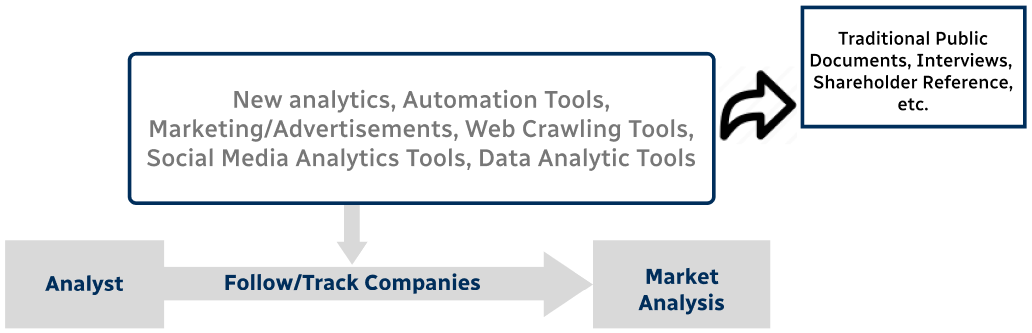
Step 3 - Data Sources
Primary Research
- Web Analytics
- Survey Reports
- Research Institute
- Latest Research Reports
- Opinion Leaders
Secondary Research
- Annual Reports
- White Paper
- Latest Press Release
- Industry Association
- Paid Database
- Investor Presentations
Step 4 - Data Triangulation
Involves using different sources of information in order to increase the validity of a study
These sources are likely to be stakeholders in a program - participants, other researchers, program staff, other community members, and so on.
Then we put all data in single framework & apply various statistical tools to find out the dynamic on the market.
During the analysis stage, feedback from the stakeholder groups would be compared to determine areas of agreement as well as areas of divergence