
Key Insights
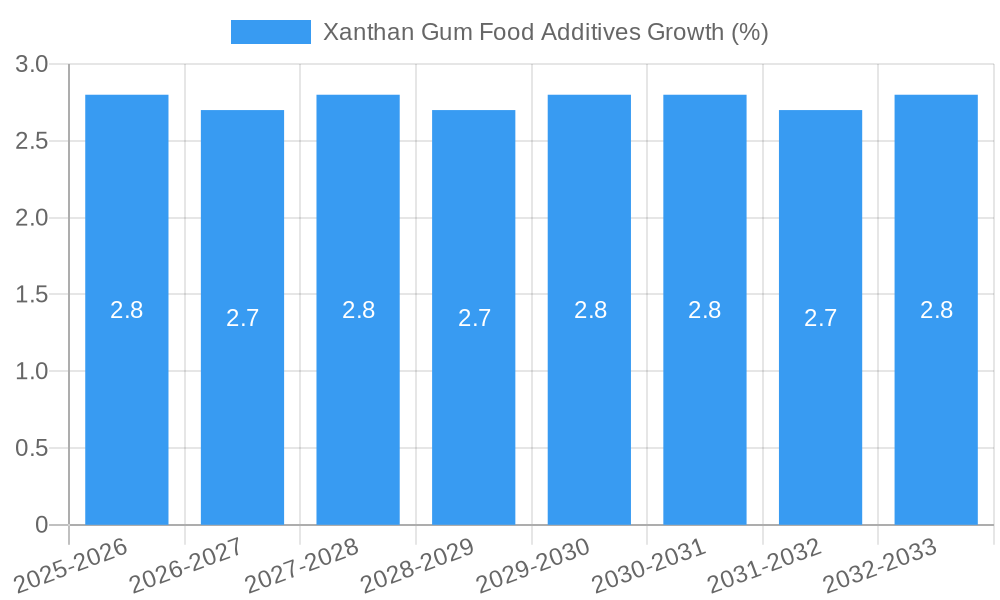
The global Xanthan Gum Food Additives market is poised for steady growth, projected to reach a substantial market size of $783 million in 2025, with a compound annual growth rate (CAGR) of 2.8% anticipated over the forecast period of 2025-2033. This robust expansion is primarily fueled by the increasing demand for food stabilizers, thickeners, and emulsifiers across a wide spectrum of food and beverage applications. The inherent versatility of xanthan gum, allowing it to enhance texture, prevent ingredient separation, and improve mouthfeel in products ranging from sauces and dressings to baked goods and dairy alternatives, underpins its consistent demand. Furthermore, growing consumer awareness regarding clean-label ingredients and the demand for gluten-free alternatives are contributing factors, as xanthan gum is a widely used ingredient in gluten-free baking. The market is segmented into key applications including the food industry and the beverages industry, with product types encompassing both powder and liquid forms, catering to diverse manufacturing needs.
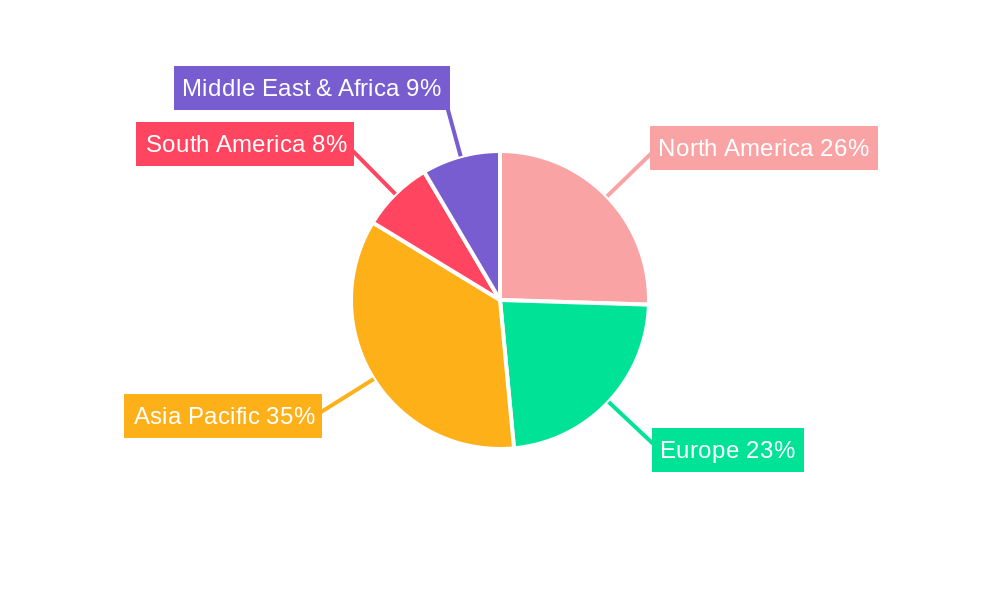
The market's trajectory is further shaped by a dynamic interplay of drivers and restraints. The escalating consumption of processed foods and the expanding global food and beverage sector are significant growth drivers. Innovations in xanthan gum production and its exploration in novel applications, such as personal care and pharmaceuticals, also present opportunities. However, price volatility of raw materials, particularly corn starch, and the availability of alternative thickeners and stabilizers pose potential restraints. Stringent regulatory frameworks and the need for compliance with food safety standards across different regions can also influence market dynamics. Geographically, the Asia Pacific region, led by China and India, is expected to exhibit strong growth due to its expanding food processing industry and large consumer base. North America and Europe remain significant markets, driven by established food industries and a high consumer preference for convenience foods. The competitive landscape features prominent players like Fufeng Group, Meihua Group, CP Kelco, and Cargill, actively engaged in research and development, capacity expansion, and strategic collaborations to maintain their market positions.

Xanthan Gum Food Additives Market Concentration & Innovation
The global xanthan gum food additives market exhibits moderate concentration, with a few dominant players accounting for a significant share of revenue, estimated at over one thousand million US dollars. Leading companies like Fufeng Group, Meihua Group, CP Kelco, and Deosen Biochemical are at the forefront, driving innovation and market expansion. Innovation in xanthan gum production focuses on enhancing purity, optimizing viscosity profiles for specific applications, and developing cost-effective manufacturing processes. Regulatory frameworks, such as those set by the FDA and EFSA, play a crucial role in ensuring food safety and product quality, influencing market entry and product development strategies. While direct product substitutes are limited due to xanthan gum's unique properties, alternative thickeners and stabilizers are present. End-user trends indicate a growing demand for clean-label ingredients and natural alternatives, prompting research into fermentation processes and feedstock optimization. Mergers and acquisitions (M&A) are a recurring theme, with deal values frequently exceeding one hundred million US dollars, as larger entities seek to consolidate market position, acquire new technologies, and expand their product portfolios. Strategic partnerships are also crucial for market penetration and technological advancement.
Xanthan Gum Food Additives Industry Trends & Insights
The xanthan gum food additives industry is experiencing robust growth, driven by an increasing global demand for processed foods, beverages, and convenience products that leverage xanthan gum's exceptional thickening, stabilizing, and emulsifying properties. The compound annual growth rate (CAGR) for this sector is projected to be approximately 5.5% over the forecast period of 2025-2033. Market penetration is steadily increasing across both developed and emerging economies, fueled by evolving consumer preferences for texture enhancement and extended shelf life in food formulations. Technological disruptions, particularly in fermentation science and downstream processing, are enabling more efficient and sustainable production methods, leading to improved product quality and potentially lower costs. This innovation is crucial in meeting the stringent quality requirements of the food and beverage industries, where xanthan gum is indispensable in applications ranging from salad dressings and sauces to gluten-free baking and dairy products. The competitive landscape is characterized by intense R&D efforts, with companies like Fufeng Group and Meihua Group investing heavily in optimizing production yields and developing specialized grades of xanthan gum tailored to specific industrial needs. Consumer awareness regarding the functionality and safety of xanthan gum as a food additive continues to rise, further bolstering its market presence. The expansion of the bakery and confectionery sectors, alongside a burgeoning demand for plant-based alternatives that require effective stabilizers, are significant growth catalysts. Furthermore, the pharmaceutical and cosmetic industries, though smaller segments, also contribute to the overall market demand for high-purity xanthan gum, creating diversified revenue streams. Supply chain resilience and raw material sourcing are critical considerations for market players aiming to maintain competitive pricing and consistent product availability, especially in the face of global economic fluctuations and potential disruptions.
Dominant Markets & Segments in Xanthan Gum Food Additives
The Food Industry segment represents the largest and most dominant application within the global xanthan gum food additives market. Economic policies supporting food processing and manufacturing, coupled with robust infrastructure for distribution and retail, significantly bolster its dominance. Consumers' increasing reliance on convenience foods, baked goods, dairy products, and sauces, all of which benefit immensely from xanthan gum's functional properties, further solidifies this segment’s leadership. For instance, in countries with highly developed food processing sectors, the demand for xanthan gum as a stabilizer and thickener can account for over sixty percent of the total market revenue.
The Beverages Industry is the second-largest application segment, exhibiting substantial growth potential. Drivers in this segment include the rising popularity of functional beverages, smoothies, and plant-based milk alternatives, which require xanthan gum to maintain emulsion stability and prevent ingredient separation. Emerging economies with rapidly growing middle classes and increasing disposable incomes are key contributors to this segment's expansion. Government initiatives promoting healthier beverage options and innovation in product formulation are also critical factors.
Within product types, Powder xanthan gum holds the largest market share due to its ease of handling, storage, and incorporation into dry mixes and various food formulations. Its versatility makes it a preferred choice for manufacturers across diverse food applications. The convenience of powdered forms in industrial settings, allowing for precise dosing and consistent performance, is a significant advantage.
The Liquid xanthan gum segment, while smaller, is gaining traction, particularly in ready-to-use applications where pre-dissolved xanthan gum simplifies manufacturing processes. This segment is expected to witness a higher CAGR compared to the powder segment, driven by increasing demand for ready-to-drink beverages and sauces that require immediate incorporation of stabilizers.
Geographically, North America and Europe currently lead the market in terms of consumption, owing to their mature food processing industries and high consumer spending on processed food products. However, the Asia-Pacific region is emerging as the fastest-growing market, driven by rapid industrialization, urbanization, and a burgeoning middle class with increasing purchasing power for convenience foods and beverages. Economic policies encouraging foreign investment in the food sector and favorable demographic trends in countries like China and India are key accelerators for growth in this region.
Xanthan Gum Food Additives Product Developments
Product developments in the xanthan gum food additives market are increasingly focused on enhancing functionality and sustainability. Innovations include the development of low-viscosity xanthan gum variants for specific beverage applications and the creation of higher-purity grades for pharmaceutical and cosmetic uses. Manufacturers are also investing in improving fermentation processes to reduce production costs and environmental impact, aiming for cleaner labels and more natural ingredient profiles. Competitive advantages are being gained through tailored solutions for emerging applications, such as gluten-free baking and plant-based meat alternatives, where xanthan gum plays a crucial role in texture and stability.
Report Scope & Segmentation Analysis
This report encompasses a comprehensive analysis of the xanthan gum food additives market, segmented by application and product type.
Application: The Food Industry segment, valued at over nine hundred million US dollars, is projected to grow at a CAGR of approximately 5.3% through 2033. Its dominance stems from widespread use in sauces, dressings, baked goods, and dairy products, where it enhances texture and stability.
The Beverages Industry segment, estimated at over two hundred million US dollars, is expected to experience a CAGR of around 6.1%. This growth is driven by the demand for functional drinks, smoothies, and plant-based alternatives, requiring effective emulsifiers and stabilizers.
Product Type: The Powder xanthan gum segment, representing the majority market share, is projected to grow at a CAGR of approximately 5.0%. Its ease of use and broad applicability across food manufacturing make it a staple ingredient.
The Liquid xanthan gum segment, while smaller, is anticipated to grow at a faster CAGR of around 6.5%. This segment benefits from the demand for ready-to-use formulations in the beverage and sauce industries.
Key Drivers of Xanthan Gum Food Additives Growth
Several factors are propelling the growth of the xanthan gum food additives market. Technological advancements in fermentation and purification processes are leading to more efficient and cost-effective production, allowing for wider adoption across various industries. The increasing global demand for processed and convenience foods, coupled with a growing awareness of xanthan gum's functional benefits in enhancing texture, stability, and shelf life, are significant economic drivers. Furthermore, the rising popularity of gluten-free products, where xanthan gum is essential for mimicking gluten's binding properties, presents a substantial opportunity. Regulatory approvals and a generally positive perception of xanthan gum as a safe food additive also contribute to its sustained market expansion.
Challenges in the Xanthan Gum Food Additives Sector
Despite its growth, the xanthan gum food additives sector faces several challenges. Fluctuations in raw material prices, particularly for corn starch, can impact production costs and profit margins. Intense competition among key players, including Fufeng Group and Meihua Group, can lead to price pressures and necessitate continuous innovation to maintain market share. Stringent regulatory requirements in certain regions regarding food additive purity and labeling can also pose hurdles for market entry and product differentiation. Moreover, the growing consumer preference for "clean label" ingredients and natural alternatives, while also an opportunity, can be a challenge for synthetic or semi-synthetic ingredients like xanthan gum if perceived negatively by some consumer segments. Supply chain disruptions, as witnessed in recent years, can affect the consistent availability of xanthan gum, impacting manufacturers' ability to meet demand.
Emerging Opportunities in Xanthan Gum Food Additives
The xanthan gum food additives market is ripe with emerging opportunities. The expanding global market for plant-based foods and beverages presents a significant avenue for growth, as xanthan gum is crucial for achieving desired textures and stability in these products. Innovation in the pharmaceutical and cosmetic industries, seeking natural and effective emulsifiers and thickeners, offers diversification. The development of novel applications in industrial sectors, such as oil and gas drilling, also presents untapped potential. Furthermore, advancements in sustainable production methods, utilizing alternative feedstocks and minimizing environmental impact, can attract environmentally conscious consumers and manufacturers. The increasing demand from emerging economies for improved food quality and convenience also represents a substantial growth frontier.
Leading Players in the Xanthan Gum Food Additives Market
- Fufeng Group
- Meihua Group
- CP Kelco
- Deosen Biochemical
- Jianlong Biotechnology
- Jungbunzlauer
- Cargill
- IFF
- Hebei Xinhe Biochemical
- Vanderbilt Minerals
Key Developments in Xanthan Gum Food Additives Industry
- 2023/08: Fufeng Group announces expansion of its xanthan gum production capacity by over twenty percent to meet growing global demand.
- 2022/11: CP Kelco introduces a new grade of xanthan gum with improved cold-water dispersibility for beverage applications.
- 2021/05: Meihua Group invests heavily in R&D to optimize fermentation processes for enhanced xanthan gum purity and yield.
- 2020/09: Deosen Biochemical acquires a smaller competitor to consolidate its market position in Asia.
- 2019/07: Jungbunzlauer highlights its commitment to sustainable xanthan gum production with new eco-friendly initiatives.
Strategic Outlook for Xanthan Gum Food Additives Market
The strategic outlook for the xanthan gum food additives market is highly optimistic, driven by relentless innovation and expanding application horizons. Key growth catalysts include the burgeoning demand from the global plant-based food and beverage sectors, where xanthan gum's functional properties are indispensable for product formulation. Furthermore, advancements in biotechnology are expected to yield more sustainable and cost-effective production methods, appealing to environmentally conscious manufacturers and consumers. The pharmaceutical and cosmetic industries continue to offer promising avenues for high-purity xanthan gum. Strategic investments in research and development to create specialized grades tailored to niche applications, coupled with a focus on supply chain resilience and global market penetration, will be critical for sustained growth and market leadership.
Xanthan Gum Food Additives Segmentation
-
1. Application
- 1.1. Food Industry
- 1.2. Beverages Industry
-
2. Types
- 2.1. Powder
- 2.2. Liquid
Xanthan Gum Food Additives Segmentation By Geography
-
1. North America
- 1.1. United States
- 1.2. Canada
- 1.3. Mexico
-
2. South America
- 2.1. Brazil
- 2.2. Argentina
- 2.3. Rest of South America
-
3. Europe
- 3.1. United Kingdom
- 3.2. Germany
- 3.3. France
- 3.4. Italy
- 3.5. Spain
- 3.6. Russia
- 3.7. Benelux
- 3.8. Nordics
- 3.9. Rest of Europe
-
4. Middle East & Africa
- 4.1. Turkey
- 4.2. Israel
- 4.3. GCC
- 4.4. North Africa
- 4.5. South Africa
- 4.6. Rest of Middle East & Africa
-
5. Asia Pacific
- 5.1. China
- 5.2. India
- 5.3. Japan
- 5.4. South Korea
- 5.5. ASEAN
- 5.6. Oceania
- 5.7. Rest of Asia Pacific
Xanthan Gum Food Additives REPORT HIGHLIGHTS
| Aspects | Details |
|---|---|
| Study Period | 2019-2033 |
| Base Year | 2024 |
| Estimated Year | 2025 |
| Forecast Period | 2025-2033 |
| Historical Period | 2019-2024 |
| Growth Rate | CAGR of 2.8% from 2019-2033 |
| Segmentation |
|
Table of Contents
- 1. Introduction
- 1.1. Research Scope
- 1.2. Market Segmentation
- 1.3. Research Methodology
- 1.4. Definitions and Assumptions
- 2. Executive Summary
- 2.1. Introduction
- 3. Market Dynamics
- 3.1. Introduction
- 3.2. Market Drivers
- 3.3. Market Restrains
- 3.4. Market Trends
- 4. Market Factor Analysis
- 4.1. Porters Five Forces
- 4.2. Supply/Value Chain
- 4.3. PESTEL analysis
- 4.4. Market Entropy
- 4.5. Patent/Trademark Analysis
- 5. Global Xanthan Gum Food Additives Analysis, Insights and Forecast, 2019-2031
- 5.1. Market Analysis, Insights and Forecast - by Application
- 5.1.1. Food Industry
- 5.1.2. Beverages Industry
- 5.2. Market Analysis, Insights and Forecast - by Types
- 5.2.1. Powder
- 5.2.2. Liquid
- 5.3. Market Analysis, Insights and Forecast - by Region
- 5.3.1. North America
- 5.3.2. South America
- 5.3.3. Europe
- 5.3.4. Middle East & Africa
- 5.3.5. Asia Pacific
- 5.1. Market Analysis, Insights and Forecast - by Application
- 6. North America Xanthan Gum Food Additives Analysis, Insights and Forecast, 2019-2031
- 6.1. Market Analysis, Insights and Forecast - by Application
- 6.1.1. Food Industry
- 6.1.2. Beverages Industry
- 6.2. Market Analysis, Insights and Forecast - by Types
- 6.2.1. Powder
- 6.2.2. Liquid
- 6.1. Market Analysis, Insights and Forecast - by Application
- 7. South America Xanthan Gum Food Additives Analysis, Insights and Forecast, 2019-2031
- 7.1. Market Analysis, Insights and Forecast - by Application
- 7.1.1. Food Industry
- 7.1.2. Beverages Industry
- 7.2. Market Analysis, Insights and Forecast - by Types
- 7.2.1. Powder
- 7.2.2. Liquid
- 7.1. Market Analysis, Insights and Forecast - by Application
- 8. Europe Xanthan Gum Food Additives Analysis, Insights and Forecast, 2019-2031
- 8.1. Market Analysis, Insights and Forecast - by Application
- 8.1.1. Food Industry
- 8.1.2. Beverages Industry
- 8.2. Market Analysis, Insights and Forecast - by Types
- 8.2.1. Powder
- 8.2.2. Liquid
- 8.1. Market Analysis, Insights and Forecast - by Application
- 9. Middle East & Africa Xanthan Gum Food Additives Analysis, Insights and Forecast, 2019-2031
- 9.1. Market Analysis, Insights and Forecast - by Application
- 9.1.1. Food Industry
- 9.1.2. Beverages Industry
- 9.2. Market Analysis, Insights and Forecast - by Types
- 9.2.1. Powder
- 9.2.2. Liquid
- 9.1. Market Analysis, Insights and Forecast - by Application
- 10. Asia Pacific Xanthan Gum Food Additives Analysis, Insights and Forecast, 2019-2031
- 10.1. Market Analysis, Insights and Forecast - by Application
- 10.1.1. Food Industry
- 10.1.2. Beverages Industry
- 10.2. Market Analysis, Insights and Forecast - by Types
- 10.2.1. Powder
- 10.2.2. Liquid
- 10.1. Market Analysis, Insights and Forecast - by Application
- 11. Competitive Analysis
- 11.1. Global Market Share Analysis 2024
- 11.2. Company Profiles
- 11.2.1 Fufeng Group
- 11.2.1.1. Overview
- 11.2.1.2. Products
- 11.2.1.3. SWOT Analysis
- 11.2.1.4. Recent Developments
- 11.2.1.5. Financials (Based on Availability)
- 11.2.2 Meihua Group
- 11.2.2.1. Overview
- 11.2.2.2. Products
- 11.2.2.3. SWOT Analysis
- 11.2.2.4. Recent Developments
- 11.2.2.5. Financials (Based on Availability)
- 11.2.3 CP Kelco
- 11.2.3.1. Overview
- 11.2.3.2. Products
- 11.2.3.3. SWOT Analysis
- 11.2.3.4. Recent Developments
- 11.2.3.5. Financials (Based on Availability)
- 11.2.4 Deosen Biochemical
- 11.2.4.1. Overview
- 11.2.4.2. Products
- 11.2.4.3. SWOT Analysis
- 11.2.4.4. Recent Developments
- 11.2.4.5. Financials (Based on Availability)
- 11.2.5 Jianlong Biotechnology
- 11.2.5.1. Overview
- 11.2.5.2. Products
- 11.2.5.3. SWOT Analysis
- 11.2.5.4. Recent Developments
- 11.2.5.5. Financials (Based on Availability)
- 11.2.6 Jungbunzlauer
- 11.2.6.1. Overview
- 11.2.6.2. Products
- 11.2.6.3. SWOT Analysis
- 11.2.6.4. Recent Developments
- 11.2.6.5. Financials (Based on Availability)
- 11.2.7 Cargill
- 11.2.7.1. Overview
- 11.2.7.2. Products
- 11.2.7.3. SWOT Analysis
- 11.2.7.4. Recent Developments
- 11.2.7.5. Financials (Based on Availability)
- 11.2.8 IFF
- 11.2.8.1. Overview
- 11.2.8.2. Products
- 11.2.8.3. SWOT Analysis
- 11.2.8.4. Recent Developments
- 11.2.8.5. Financials (Based on Availability)
- 11.2.9 Hebei Xinhe Biochemical
- 11.2.9.1. Overview
- 11.2.9.2. Products
- 11.2.9.3. SWOT Analysis
- 11.2.9.4. Recent Developments
- 11.2.9.5. Financials (Based on Availability)
- 11.2.10 Vanderbilt Minerals
- 11.2.10.1. Overview
- 11.2.10.2. Products
- 11.2.10.3. SWOT Analysis
- 11.2.10.4. Recent Developments
- 11.2.10.5. Financials (Based on Availability)
- 11.2.1 Fufeng Group
List of Figures
- Figure 1: Global Xanthan Gum Food Additives Revenue Breakdown (million, %) by Region 2024 & 2032
- Figure 2: Global Xanthan Gum Food Additives Volume Breakdown (K, %) by Region 2024 & 2032
- Figure 3: North America Xanthan Gum Food Additives Revenue (million), by Application 2024 & 2032
- Figure 4: North America Xanthan Gum Food Additives Volume (K), by Application 2024 & 2032
- Figure 5: North America Xanthan Gum Food Additives Revenue Share (%), by Application 2024 & 2032
- Figure 6: North America Xanthan Gum Food Additives Volume Share (%), by Application 2024 & 2032
- Figure 7: North America Xanthan Gum Food Additives Revenue (million), by Types 2024 & 2032
- Figure 8: North America Xanthan Gum Food Additives Volume (K), by Types 2024 & 2032
- Figure 9: North America Xanthan Gum Food Additives Revenue Share (%), by Types 2024 & 2032
- Figure 10: North America Xanthan Gum Food Additives Volume Share (%), by Types 2024 & 2032
- Figure 11: North America Xanthan Gum Food Additives Revenue (million), by Country 2024 & 2032
- Figure 12: North America Xanthan Gum Food Additives Volume (K), by Country 2024 & 2032
- Figure 13: North America Xanthan Gum Food Additives Revenue Share (%), by Country 2024 & 2032
- Figure 14: North America Xanthan Gum Food Additives Volume Share (%), by Country 2024 & 2032
- Figure 15: South America Xanthan Gum Food Additives Revenue (million), by Application 2024 & 2032
- Figure 16: South America Xanthan Gum Food Additives Volume (K), by Application 2024 & 2032
- Figure 17: South America Xanthan Gum Food Additives Revenue Share (%), by Application 2024 & 2032
- Figure 18: South America Xanthan Gum Food Additives Volume Share (%), by Application 2024 & 2032
- Figure 19: South America Xanthan Gum Food Additives Revenue (million), by Types 2024 & 2032
- Figure 20: South America Xanthan Gum Food Additives Volume (K), by Types 2024 & 2032
- Figure 21: South America Xanthan Gum Food Additives Revenue Share (%), by Types 2024 & 2032
- Figure 22: South America Xanthan Gum Food Additives Volume Share (%), by Types 2024 & 2032
- Figure 23: South America Xanthan Gum Food Additives Revenue (million), by Country 2024 & 2032
- Figure 24: South America Xanthan Gum Food Additives Volume (K), by Country 2024 & 2032
- Figure 25: South America Xanthan Gum Food Additives Revenue Share (%), by Country 2024 & 2032
- Figure 26: South America Xanthan Gum Food Additives Volume Share (%), by Country 2024 & 2032
- Figure 27: Europe Xanthan Gum Food Additives Revenue (million), by Application 2024 & 2032
- Figure 28: Europe Xanthan Gum Food Additives Volume (K), by Application 2024 & 2032
- Figure 29: Europe Xanthan Gum Food Additives Revenue Share (%), by Application 2024 & 2032
- Figure 30: Europe Xanthan Gum Food Additives Volume Share (%), by Application 2024 & 2032
- Figure 31: Europe Xanthan Gum Food Additives Revenue (million), by Types 2024 & 2032
- Figure 32: Europe Xanthan Gum Food Additives Volume (K), by Types 2024 & 2032
- Figure 33: Europe Xanthan Gum Food Additives Revenue Share (%), by Types 2024 & 2032
- Figure 34: Europe Xanthan Gum Food Additives Volume Share (%), by Types 2024 & 2032
- Figure 35: Europe Xanthan Gum Food Additives Revenue (million), by Country 2024 & 2032
- Figure 36: Europe Xanthan Gum Food Additives Volume (K), by Country 2024 & 2032
- Figure 37: Europe Xanthan Gum Food Additives Revenue Share (%), by Country 2024 & 2032
- Figure 38: Europe Xanthan Gum Food Additives Volume Share (%), by Country 2024 & 2032
- Figure 39: Middle East & Africa Xanthan Gum Food Additives Revenue (million), by Application 2024 & 2032
- Figure 40: Middle East & Africa Xanthan Gum Food Additives Volume (K), by Application 2024 & 2032
- Figure 41: Middle East & Africa Xanthan Gum Food Additives Revenue Share (%), by Application 2024 & 2032
- Figure 42: Middle East & Africa Xanthan Gum Food Additives Volume Share (%), by Application 2024 & 2032
- Figure 43: Middle East & Africa Xanthan Gum Food Additives Revenue (million), by Types 2024 & 2032
- Figure 44: Middle East & Africa Xanthan Gum Food Additives Volume (K), by Types 2024 & 2032
- Figure 45: Middle East & Africa Xanthan Gum Food Additives Revenue Share (%), by Types 2024 & 2032
- Figure 46: Middle East & Africa Xanthan Gum Food Additives Volume Share (%), by Types 2024 & 2032
- Figure 47: Middle East & Africa Xanthan Gum Food Additives Revenue (million), by Country 2024 & 2032
- Figure 48: Middle East & Africa Xanthan Gum Food Additives Volume (K), by Country 2024 & 2032
- Figure 49: Middle East & Africa Xanthan Gum Food Additives Revenue Share (%), by Country 2024 & 2032
- Figure 50: Middle East & Africa Xanthan Gum Food Additives Volume Share (%), by Country 2024 & 2032
- Figure 51: Asia Pacific Xanthan Gum Food Additives Revenue (million), by Application 2024 & 2032
- Figure 52: Asia Pacific Xanthan Gum Food Additives Volume (K), by Application 2024 & 2032
- Figure 53: Asia Pacific Xanthan Gum Food Additives Revenue Share (%), by Application 2024 & 2032
- Figure 54: Asia Pacific Xanthan Gum Food Additives Volume Share (%), by Application 2024 & 2032
- Figure 55: Asia Pacific Xanthan Gum Food Additives Revenue (million), by Types 2024 & 2032
- Figure 56: Asia Pacific Xanthan Gum Food Additives Volume (K), by Types 2024 & 2032
- Figure 57: Asia Pacific Xanthan Gum Food Additives Revenue Share (%), by Types 2024 & 2032
- Figure 58: Asia Pacific Xanthan Gum Food Additives Volume Share (%), by Types 2024 & 2032
- Figure 59: Asia Pacific Xanthan Gum Food Additives Revenue (million), by Country 2024 & 2032
- Figure 60: Asia Pacific Xanthan Gum Food Additives Volume (K), by Country 2024 & 2032
- Figure 61: Asia Pacific Xanthan Gum Food Additives Revenue Share (%), by Country 2024 & 2032
- Figure 62: Asia Pacific Xanthan Gum Food Additives Volume Share (%), by Country 2024 & 2032
List of Tables
- Table 1: Global Xanthan Gum Food Additives Revenue million Forecast, by Region 2019 & 2032
- Table 2: Global Xanthan Gum Food Additives Volume K Forecast, by Region 2019 & 2032
- Table 3: Global Xanthan Gum Food Additives Revenue million Forecast, by Application 2019 & 2032
- Table 4: Global Xanthan Gum Food Additives Volume K Forecast, by Application 2019 & 2032
- Table 5: Global Xanthan Gum Food Additives Revenue million Forecast, by Types 2019 & 2032
- Table 6: Global Xanthan Gum Food Additives Volume K Forecast, by Types 2019 & 2032
- Table 7: Global Xanthan Gum Food Additives Revenue million Forecast, by Region 2019 & 2032
- Table 8: Global Xanthan Gum Food Additives Volume K Forecast, by Region 2019 & 2032
- Table 9: Global Xanthan Gum Food Additives Revenue million Forecast, by Application 2019 & 2032
- Table 10: Global Xanthan Gum Food Additives Volume K Forecast, by Application 2019 & 2032
- Table 11: Global Xanthan Gum Food Additives Revenue million Forecast, by Types 2019 & 2032
- Table 12: Global Xanthan Gum Food Additives Volume K Forecast, by Types 2019 & 2032
- Table 13: Global Xanthan Gum Food Additives Revenue million Forecast, by Country 2019 & 2032
- Table 14: Global Xanthan Gum Food Additives Volume K Forecast, by Country 2019 & 2032
- Table 15: United States Xanthan Gum Food Additives Revenue (million) Forecast, by Application 2019 & 2032
- Table 16: United States Xanthan Gum Food Additives Volume (K) Forecast, by Application 2019 & 2032
- Table 17: Canada Xanthan Gum Food Additives Revenue (million) Forecast, by Application 2019 & 2032
- Table 18: Canada Xanthan Gum Food Additives Volume (K) Forecast, by Application 2019 & 2032
- Table 19: Mexico Xanthan Gum Food Additives Revenue (million) Forecast, by Application 2019 & 2032
- Table 20: Mexico Xanthan Gum Food Additives Volume (K) Forecast, by Application 2019 & 2032
- Table 21: Global Xanthan Gum Food Additives Revenue million Forecast, by Application 2019 & 2032
- Table 22: Global Xanthan Gum Food Additives Volume K Forecast, by Application 2019 & 2032
- Table 23: Global Xanthan Gum Food Additives Revenue million Forecast, by Types 2019 & 2032
- Table 24: Global Xanthan Gum Food Additives Volume K Forecast, by Types 2019 & 2032
- Table 25: Global Xanthan Gum Food Additives Revenue million Forecast, by Country 2019 & 2032
- Table 26: Global Xanthan Gum Food Additives Volume K Forecast, by Country 2019 & 2032
- Table 27: Brazil Xanthan Gum Food Additives Revenue (million) Forecast, by Application 2019 & 2032
- Table 28: Brazil Xanthan Gum Food Additives Volume (K) Forecast, by Application 2019 & 2032
- Table 29: Argentina Xanthan Gum Food Additives Revenue (million) Forecast, by Application 2019 & 2032
- Table 30: Argentina Xanthan Gum Food Additives Volume (K) Forecast, by Application 2019 & 2032
- Table 31: Rest of South America Xanthan Gum Food Additives Revenue (million) Forecast, by Application 2019 & 2032
- Table 32: Rest of South America Xanthan Gum Food Additives Volume (K) Forecast, by Application 2019 & 2032
- Table 33: Global Xanthan Gum Food Additives Revenue million Forecast, by Application 2019 & 2032
- Table 34: Global Xanthan Gum Food Additives Volume K Forecast, by Application 2019 & 2032
- Table 35: Global Xanthan Gum Food Additives Revenue million Forecast, by Types 2019 & 2032
- Table 36: Global Xanthan Gum Food Additives Volume K Forecast, by Types 2019 & 2032
- Table 37: Global Xanthan Gum Food Additives Revenue million Forecast, by Country 2019 & 2032
- Table 38: Global Xanthan Gum Food Additives Volume K Forecast, by Country 2019 & 2032
- Table 39: United Kingdom Xanthan Gum Food Additives Revenue (million) Forecast, by Application 2019 & 2032
- Table 40: United Kingdom Xanthan Gum Food Additives Volume (K) Forecast, by Application 2019 & 2032
- Table 41: Germany Xanthan Gum Food Additives Revenue (million) Forecast, by Application 2019 & 2032
- Table 42: Germany Xanthan Gum Food Additives Volume (K) Forecast, by Application 2019 & 2032
- Table 43: France Xanthan Gum Food Additives Revenue (million) Forecast, by Application 2019 & 2032
- Table 44: France Xanthan Gum Food Additives Volume (K) Forecast, by Application 2019 & 2032
- Table 45: Italy Xanthan Gum Food Additives Revenue (million) Forecast, by Application 2019 & 2032
- Table 46: Italy Xanthan Gum Food Additives Volume (K) Forecast, by Application 2019 & 2032
- Table 47: Spain Xanthan Gum Food Additives Revenue (million) Forecast, by Application 2019 & 2032
- Table 48: Spain Xanthan Gum Food Additives Volume (K) Forecast, by Application 2019 & 2032
- Table 49: Russia Xanthan Gum Food Additives Revenue (million) Forecast, by Application 2019 & 2032
- Table 50: Russia Xanthan Gum Food Additives Volume (K) Forecast, by Application 2019 & 2032
- Table 51: Benelux Xanthan Gum Food Additives Revenue (million) Forecast, by Application 2019 & 2032
- Table 52: Benelux Xanthan Gum Food Additives Volume (K) Forecast, by Application 2019 & 2032
- Table 53: Nordics Xanthan Gum Food Additives Revenue (million) Forecast, by Application 2019 & 2032
- Table 54: Nordics Xanthan Gum Food Additives Volume (K) Forecast, by Application 2019 & 2032
- Table 55: Rest of Europe Xanthan Gum Food Additives Revenue (million) Forecast, by Application 2019 & 2032
- Table 56: Rest of Europe Xanthan Gum Food Additives Volume (K) Forecast, by Application 2019 & 2032
- Table 57: Global Xanthan Gum Food Additives Revenue million Forecast, by Application 2019 & 2032
- Table 58: Global Xanthan Gum Food Additives Volume K Forecast, by Application 2019 & 2032
- Table 59: Global Xanthan Gum Food Additives Revenue million Forecast, by Types 2019 & 2032
- Table 60: Global Xanthan Gum Food Additives Volume K Forecast, by Types 2019 & 2032
- Table 61: Global Xanthan Gum Food Additives Revenue million Forecast, by Country 2019 & 2032
- Table 62: Global Xanthan Gum Food Additives Volume K Forecast, by Country 2019 & 2032
- Table 63: Turkey Xanthan Gum Food Additives Revenue (million) Forecast, by Application 2019 & 2032
- Table 64: Turkey Xanthan Gum Food Additives Volume (K) Forecast, by Application 2019 & 2032
- Table 65: Israel Xanthan Gum Food Additives Revenue (million) Forecast, by Application 2019 & 2032
- Table 66: Israel Xanthan Gum Food Additives Volume (K) Forecast, by Application 2019 & 2032
- Table 67: GCC Xanthan Gum Food Additives Revenue (million) Forecast, by Application 2019 & 2032
- Table 68: GCC Xanthan Gum Food Additives Volume (K) Forecast, by Application 2019 & 2032
- Table 69: North Africa Xanthan Gum Food Additives Revenue (million) Forecast, by Application 2019 & 2032
- Table 70: North Africa Xanthan Gum Food Additives Volume (K) Forecast, by Application 2019 & 2032
- Table 71: South Africa Xanthan Gum Food Additives Revenue (million) Forecast, by Application 2019 & 2032
- Table 72: South Africa Xanthan Gum Food Additives Volume (K) Forecast, by Application 2019 & 2032
- Table 73: Rest of Middle East & Africa Xanthan Gum Food Additives Revenue (million) Forecast, by Application 2019 & 2032
- Table 74: Rest of Middle East & Africa Xanthan Gum Food Additives Volume (K) Forecast, by Application 2019 & 2032
- Table 75: Global Xanthan Gum Food Additives Revenue million Forecast, by Application 2019 & 2032
- Table 76: Global Xanthan Gum Food Additives Volume K Forecast, by Application 2019 & 2032
- Table 77: Global Xanthan Gum Food Additives Revenue million Forecast, by Types 2019 & 2032
- Table 78: Global Xanthan Gum Food Additives Volume K Forecast, by Types 2019 & 2032
- Table 79: Global Xanthan Gum Food Additives Revenue million Forecast, by Country 2019 & 2032
- Table 80: Global Xanthan Gum Food Additives Volume K Forecast, by Country 2019 & 2032
- Table 81: China Xanthan Gum Food Additives Revenue (million) Forecast, by Application 2019 & 2032
- Table 82: China Xanthan Gum Food Additives Volume (K) Forecast, by Application 2019 & 2032
- Table 83: India Xanthan Gum Food Additives Revenue (million) Forecast, by Application 2019 & 2032
- Table 84: India Xanthan Gum Food Additives Volume (K) Forecast, by Application 2019 & 2032
- Table 85: Japan Xanthan Gum Food Additives Revenue (million) Forecast, by Application 2019 & 2032
- Table 86: Japan Xanthan Gum Food Additives Volume (K) Forecast, by Application 2019 & 2032
- Table 87: South Korea Xanthan Gum Food Additives Revenue (million) Forecast, by Application 2019 & 2032
- Table 88: South Korea Xanthan Gum Food Additives Volume (K) Forecast, by Application 2019 & 2032
- Table 89: ASEAN Xanthan Gum Food Additives Revenue (million) Forecast, by Application 2019 & 2032
- Table 90: ASEAN Xanthan Gum Food Additives Volume (K) Forecast, by Application 2019 & 2032
- Table 91: Oceania Xanthan Gum Food Additives Revenue (million) Forecast, by Application 2019 & 2032
- Table 92: Oceania Xanthan Gum Food Additives Volume (K) Forecast, by Application 2019 & 2032
- Table 93: Rest of Asia Pacific Xanthan Gum Food Additives Revenue (million) Forecast, by Application 2019 & 2032
- Table 94: Rest of Asia Pacific Xanthan Gum Food Additives Volume (K) Forecast, by Application 2019 & 2032
Frequently Asked Questions
1. What is the projected Compound Annual Growth Rate (CAGR) of the Xanthan Gum Food Additives?
The projected CAGR is approximately 2.8%.
2. Which companies are prominent players in the Xanthan Gum Food Additives?
Key companies in the market include Fufeng Group, Meihua Group, CP Kelco, Deosen Biochemical, Jianlong Biotechnology, Jungbunzlauer, Cargill, IFF, Hebei Xinhe Biochemical, Vanderbilt Minerals.
3. What are the main segments of the Xanthan Gum Food Additives?
The market segments include Application, Types.
4. Can you provide details about the market size?
The market size is estimated to be USD 783 million as of 2022.
5. What are some drivers contributing to market growth?
N/A
6. What are the notable trends driving market growth?
N/A
7. Are there any restraints impacting market growth?
N/A
8. Can you provide examples of recent developments in the market?
N/A
9. What pricing options are available for accessing the report?
Pricing options include single-user, multi-user, and enterprise licenses priced at USD 4350.00, USD 6525.00, and USD 8700.00 respectively.
10. Is the market size provided in terms of value or volume?
The market size is provided in terms of value, measured in million and volume, measured in K.
11. Are there any specific market keywords associated with the report?
Yes, the market keyword associated with the report is "Xanthan Gum Food Additives," which aids in identifying and referencing the specific market segment covered.
12. How do I determine which pricing option suits my needs best?
The pricing options vary based on user requirements and access needs. Individual users may opt for single-user licenses, while businesses requiring broader access may choose multi-user or enterprise licenses for cost-effective access to the report.
13. Are there any additional resources or data provided in the Xanthan Gum Food Additives report?
While the report offers comprehensive insights, it's advisable to review the specific contents or supplementary materials provided to ascertain if additional resources or data are available.
14. How can I stay updated on further developments or reports in the Xanthan Gum Food Additives?
To stay informed about further developments, trends, and reports in the Xanthan Gum Food Additives, consider subscribing to industry newsletters, following relevant companies and organizations, or regularly checking reputable industry news sources and publications.
Methodology
Step 1 - Identification of Relevant Samples Size from Population Database


Step 2 - Approaches for Defining Global Market Size (Value, Volume* & Price*)

Note*: In applicable scenarios
Step 3 - Data Sources
Primary Research
- Web Analytics
- Survey Reports
- Research Institute
- Latest Research Reports
- Opinion Leaders
Secondary Research
- Annual Reports
- White Paper
- Latest Press Release
- Industry Association
- Paid Database
- Investor Presentations

Step 4 - Data Triangulation
Involves using different sources of information in order to increase the validity of a study
These sources are likely to be stakeholders in a program - participants, other researchers, program staff, other community members, and so on.
Then we put all data in single framework & apply various statistical tools to find out the dynamic on the market.
During the analysis stage, feedback from the stakeholder groups would be compared to determine areas of agreement as well as areas of divergence


