

Key Insights
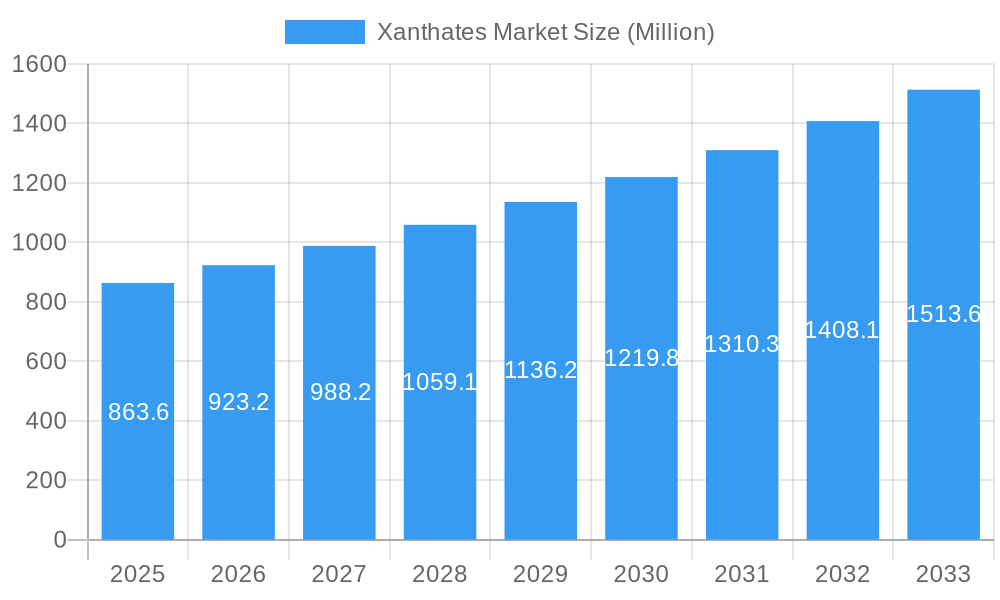
The global xanthates market, valued at $863.6 million in 2025, is projected to experience robust growth, driven by a Compound Annual Growth Rate (CAGR) of 6.8% from 2025 to 2033. This expansion is primarily fueled by the increasing demand from the mining industry, particularly in the extraction of base and precious metals. The rising global mining activities, coupled with the escalating need for efficient and effective mineral separation techniques, significantly boost the consumption of xanthates as crucial flotation reagents. Furthermore, the expanding rubber processing and agrochemical sectors contribute to market growth, although to a lesser extent compared to mining. Sodium ethyl xanthate and sodium isopropyl xanthate currently dominate the product type segment, reflecting their widespread application and established market presence. Geographically, the Asia-Pacific region, led by China and India, holds a substantial market share due to the prolific mining activities and expanding industrialization within these nations. However, North America and Europe also contribute significantly, driven by established mining operations and stringent environmental regulations promoting the adoption of efficient, and less environmentally impactful, mineral extraction technologies. Growth will likely be influenced by fluctuating commodity prices, technological advancements in mineral processing, and stringent environmental regulations impacting the manufacturing and use of these chemicals.
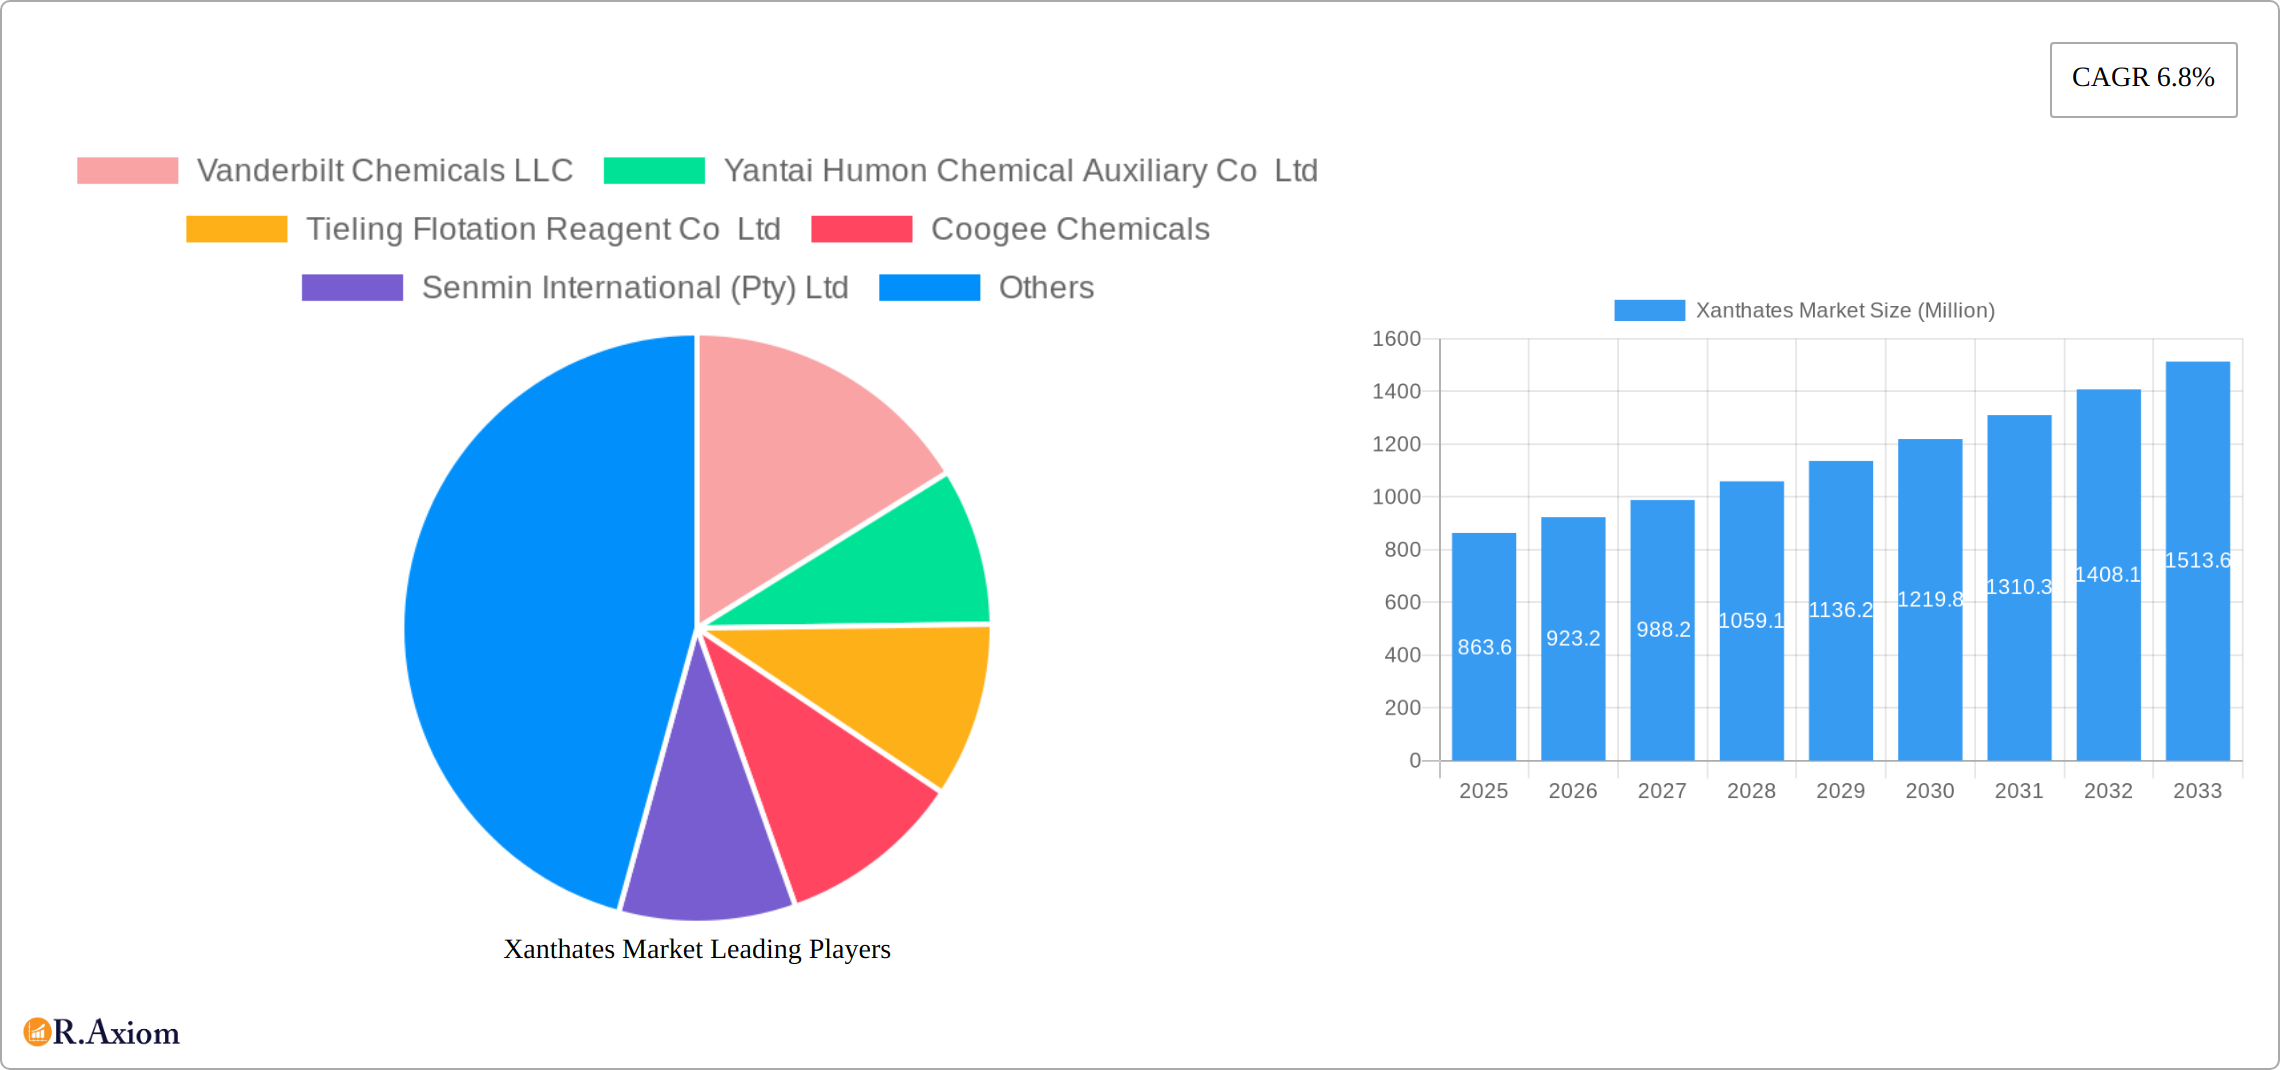
Xanthates Market Market Size (In Million)
While the market demonstrates significant growth potential, challenges remain. Price volatility of raw materials used in xanthate production poses a considerable restraint, impacting profitability and potentially slowing market expansion. Moreover, the industry faces increasing scrutiny regarding its environmental impact, particularly concerning water pollution from mining operations. Companies are actively seeking sustainable and eco-friendly alternatives, fostering innovation in the sector. Competition is intense amongst major players, such as Vanderbilt Chemicals LLC, Yantai Humon Chemical Auxiliary Co Ltd, and Orica Limited. Strategic alliances, capacity expansions, and product diversification are key strategies employed by companies to maintain competitiveness and capture market share. The forecast period anticipates a considerable expansion of the market fueled by sustained growth in mining and other related industries. The industry will continue its evolution towards more sustainable practices and efficient production processes, aligning with global environmental concerns.
Xanthates Market Company Market Share
This comprehensive report provides a detailed analysis of the global Xanthates Market, offering invaluable insights for industry stakeholders, investors, and researchers. Covering the period from 2019 to 2033, with a base year of 2025, this report examines market dynamics, competitive landscapes, and future growth prospects. The market size is projected to reach xx Million by 2033, exhibiting a CAGR of xx% during the forecast period (2025-2033).
Xanthates Market Market Concentration & Innovation
The Xanthates market exhibits a moderately concentrated structure, with a few key players holding significant market share. The top five companies—Vanderbilt Chemicals LLC, Yantai Humon Chemical Auxiliary Co Ltd, Tieling Flotation Reagent Co Ltd, Coogee Chemicals, and Senmin International (Pty) Ltd—collectively account for approximately xx% of the global market in 2025. Innovation in the xanthates market is driven by the need for improved flotation efficiency, reduced environmental impact, and the development of specialized xanthates for specific ore types. Regulatory frameworks, particularly those concerning environmental protection and worker safety, significantly influence market practices. The market witnesses continuous innovation in product formulations to enhance performance and minimize environmental footprint. Key innovation areas include the development of biodegradable xanthates and the optimization of existing formulations for specific applications.
- Market Share (2025): Vanderbilt Chemicals LLC (xx%), Yantai Humon Chemical Auxiliary Co Ltd (xx%), Tieling Flotation Reagent Co Ltd (xx%), Coogee Chemicals (xx%), Senmin International (Pty) Ltd (xx%).
- M&A Activity (2019-2024): A total of xx M&A deals were recorded, with a combined value of approximately xx Million. These deals primarily focused on expanding geographic reach and product portfolios.
- Product Substitutes: While there are some alternative collectors available for mineral flotation, xanthates maintain a dominant position due to their cost-effectiveness and performance.
- End-User Trends: The increasing demand for minerals in various industries, including construction and electronics, fuels the growth of the xanthates market. A rising focus on sustainable mining practices is also influencing product development.
Xanthates Market Industry Trends & Insights
The global Xanthates market is experiencing significant growth, driven primarily by the burgeoning mining industry, particularly in developing economies. The increasing demand for metals and minerals, coupled with advancements in mining technologies, is a major catalyst. Technological advancements, such as the development of more efficient and environmentally friendly xanthates, are further boosting market expansion. Consumer preferences are shifting towards sustainable and eco-friendly products, prompting manufacturers to develop biodegradable xanthates and optimize production processes to reduce environmental impact. Competitive dynamics are characterized by intense rivalry among major players, with a focus on product differentiation, cost optimization, and strategic partnerships. The market is also witnessing the emergence of new players, particularly in regions with significant mining activities. The market penetration of sodium ethyl xanthate remains highest due to its cost-effectiveness and wide applicability.
- Market Growth Drivers: Increased mining activities globally, technological advancements in xanthate production, and rising demand for minerals in various sectors.
- CAGR (2025-2033): xx%
- Market Penetration (Sodium Ethyl Xanthate, 2025): xx%
Dominant Markets & Segments in Xanthates Market
The mining segment dominates the xanthates market, accounting for the largest share in both volume and value. Within the product type segment, Sodium Ethyl Xanthate holds the leading position due to its widespread use and cost-effectiveness. Geographically, the Asia-Pacific region exhibits the strongest growth, fueled by robust mining activities in countries like China, Australia, and India. The dominance of these segments is attributed to several key drivers:
- Mining Segment:
- High demand for metals and minerals.
- Increasing mining activities in developing economies.
- Advancements in mining technologies.
- Sodium Ethyl Xanthate Segment:
- Cost-effectiveness compared to other xanthates.
- Wide applicability across various ore types.
- Established supply chains.
- Asia-Pacific Region:
- Significant mining activities in China, Australia, and India.
- Growing infrastructure development.
- Favorable government policies supporting mining.
The North American and European markets also contribute significantly, although at a slower growth rate compared to Asia-Pacific.
Xanthates Market Product Developments
Recent product innovations in the xanthates market have focused on enhancing flotation efficiency, reducing environmental impact, and developing specialized xanthates for specific ore types. Manufacturers are increasingly emphasizing the development of biodegradable xanthates and optimizing production processes to minimize waste and environmental footprint. These developments address the growing demand for sustainable mining practices and meet stringent environmental regulations. The market is also witnessing the introduction of xanthates with improved selectivity and performance in challenging mining conditions.
Report Scope & Segmentation Analysis
This report segments the Xanthates market based on product type and application.
Product Type: Sodium Ethyl Xanthate, Sodium Isopropyl Xanthate, Sodium Isobutyl Xanthate, Potassium Amyl Xanthate, Other Product Types. Each segment is analyzed based on its market size, growth rate, and competitive landscape. Sodium Ethyl Xanthate is expected to maintain its dominance due to its wide use and affordability.
Application: Mining, Rubber Processing, Agrochemicals, Other Applications. The mining application holds the largest market share, followed by rubber processing. Each application segment is analyzed based on its market size, growth rate, and future potential.
Growth projections for each segment are provided, considering factors like technological advancements, market trends, and regulatory changes. Competitive dynamics within each segment are also examined.
Key Drivers of Xanthates Market Growth
The xanthates market is experiencing robust growth, fueled by a confluence of factors. The escalating global demand for metals and minerals, primarily driven by rapid industrialization and extensive infrastructure development projects worldwide, forms a cornerstone of this expansion. This surge in demand necessitates increased mining activities, directly translating into higher xanthates consumption. Furthermore, significant technological advancements are continuously improving xanthate formulations and refining production processes, leading to enhanced efficiency and cost-effectiveness. Favorable government policies in key mining regions, particularly those promoting sustainable mining practices, are also acting as catalysts for market growth. The increasing emphasis on environmentally responsible mining operations is further stimulating demand for eco-friendly xanthate alternatives, creating a compelling market segment for biodegradable and less-toxic formulations.
Challenges in the Xanthates Market Sector
The Xanthates market faces challenges including fluctuations in raw material prices, stringent environmental regulations impacting production and disposal, and intense competition from other mineral collectors. Supply chain disruptions can also affect production and pricing. The volatility of the mining industry and changes in mineral prices impact demand.
Emerging Opportunities in Xanthates Market
The xanthates market presents a wealth of emerging opportunities for players willing to innovate and adapt. A key area lies in developing specialized xanthates tailored for the efficient processing of challenging ore types, a critical need for maximizing extraction yields from complex geological formations. The growing environmental consciousness is pushing the demand for biodegradable xanthates, offering a significant opportunity for companies committed to sustainable solutions. Expansion into new geographical markets with burgeoning mining activities, especially in developing economies experiencing rapid industrialization, presents another lucrative avenue for growth. Moreover, advancements in flotation techniques are consistently driving the demand for more sophisticated and effective xanthate formulations, opening doors for innovative product development and technological leadership.
Leading Players in the Xanthates Market Market
- Vanderbilt Chemicals LLC
- Yantai Humon Chemical Auxiliary Co Ltd
- Tieling Flotation Reagent Co Ltd
- Coogee Chemicals
- Senmin International (Pty) Ltd
- QiXia TongDa Flotation Reagent Co Ltd
- CTC Energy & Mining Company
- Orica Limited
- Amruta Industries
- SNF Group
Key Developments in Xanthates Market Industry
- January 2023: Vanderbilt Chemicals LLC successfully launched a new biodegradable xanthate formulation, showcasing a commitment to sustainable mining practices and responding to growing market demand for environmentally friendly solutions.
- June 2022: Yantai Humon Chemical Auxiliary Co Ltd significantly expanded its production capacity in China, underscoring the company's confidence in the market's continued growth and its strategic position to meet increasing demand.
- October 2021: A merger between two smaller xanthate producers created a larger, more competitive market player. This consolidation reflects the ongoing industry trend of strategic acquisitions and mergers, leading to increased market share and diversification of product offerings. (Further details on specific mergers and acquisitions are included in the full report).
Strategic Outlook for Xanthates Market Market
The Xanthates market is poised for continued growth, driven by several factors including the increasing demand for minerals, technological innovations, and the development of sustainable mining practices. The focus on environmentally friendly xanthates presents significant opportunities for manufacturers, while regional expansion into emerging markets will further drive growth. The market is expected to witness further consolidation, with larger players acquiring smaller companies to enhance market share and product portfolio.
Xanthates Market Segmentation
-
1. Product Type
- 1.1. Sodium Ethyl Xanthate
- 1.2. Sodium Isopropyl Xanthate
- 1.3. Sodium Isobutyl Xanthate
- 1.4. Potassium Amyl Xanthate
- 1.5. Other Product Types
-
2. Application
- 2.1. Mining
- 2.2. Rubber Processing
- 2.3. Agrochemicals
- 2.4. Other Applications
Xanthates Market Segmentation By Geography
-
1. Asia Pacific
- 1.1. China
- 1.2. India
- 1.3. Japan
- 1.4. South Korea
- 1.5. Rest of Asia Pacific
-
2. North America
- 2.1. United States
- 2.2. Canada
- 2.3. Mexico
-
3. Europe
- 3.1. Germany
- 3.2. United Kingdom
- 3.3. Italy
- 3.4. France
- 3.5. Rest of Europe
-
4. South America
- 4.1. Brazil
- 4.2. Argentina
- 4.3. Rest of South America
-
5. Middle East and Africa
- 5.1. Saudi Arabia
- 5.2. South Africa
- 5.3. Rest of Middle East and Africa
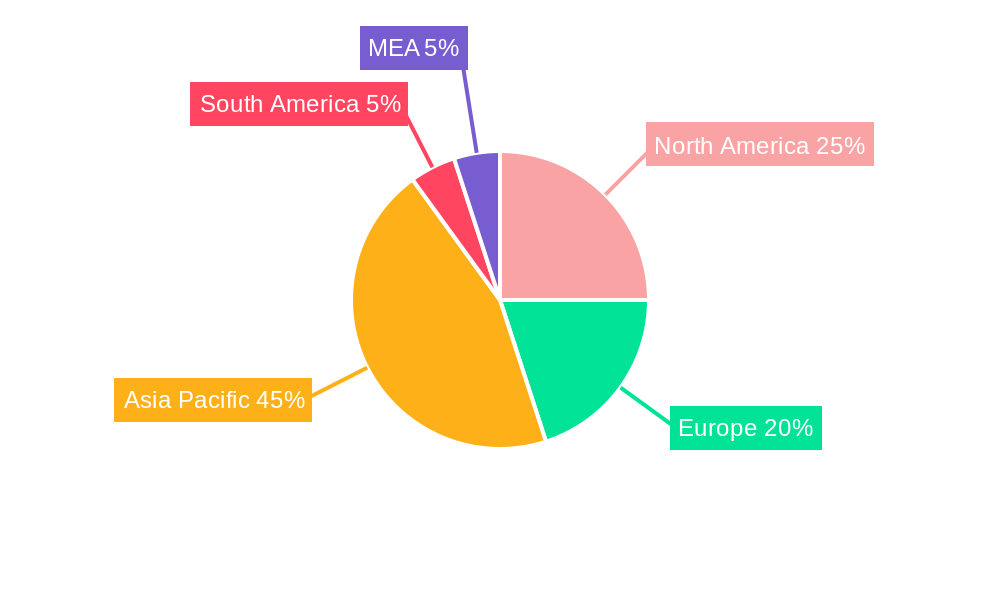
Xanthates Market Regional Market Share
Geographic Coverage of Xanthates Market
Xanthates Market REPORT HIGHLIGHTS
| Aspects | Details |
|---|---|
| Study Period | 2020-2034 |
| Base Year | 2025 |
| Estimated Year | 2026 |
| Forecast Period | 2026-2034 |
| Historical Period | 2020-2025 |
| Growth Rate | CAGR of 6.8% from 2020-2034 |
| Segmentation |
|
Table of Contents
- 1. Introduction
- 1.1. Research Scope
- 1.2. Market Segmentation
- 1.3. Research Objective
- 1.4. Definitions and Assumptions
- 2. Executive Summary
- 2.1. Market Snapshot
- 3. Market Dynamics
- 3.1. Market Drivers
- 3.2. Market Restrains
- 3.3. Market Trends
- 3.4. Market Opportunities
- 4. Market Factor Analysis
- 4.1. Porters Five Forces
- 4.1.1. Bargaining Power of Suppliers
- 4.1.2. Bargaining Power of Buyers
- 4.1.3. Threat of New Entrants
- 4.1.4. Threat of Substitutes
- 4.1.5. Competitive Rivalry
- 4.2. PESTEL analysis
- 4.3. BCG Analysis
- 4.3.1. Stars (High Growth, High Market Share)
- 4.3.2. Cash Cows (Low Growth, High Market Share)
- 4.3.3. Question Mark (High Growth, Low Market Share)
- 4.3.4. Dogs (Low Growth, Low Market Share)
- 4.4. Ansoff Matrix Analysis
- 4.5. Supply Chain Analysis
- 4.6. Regulatory Landscape
- 4.7. Current Market Potential and Opportunity Assessment (TAM–SAM–SOM Framework)
- 4.8. RAX Analyst Note
- 4.1. Porters Five Forces
- 5. Market Analysis, Insights and Forecast 2021-2033
- 5.1. Market Analysis, Insights and Forecast - by Product Type
- 5.1.1. Sodium Ethyl Xanthate
- 5.1.2. Sodium Isopropyl Xanthate
- 5.1.3. Sodium Isobutyl Xanthate
- 5.1.4. Potassium Amyl Xanthate
- 5.1.5. Other Product Types
- 5.2. Market Analysis, Insights and Forecast - by Application
- 5.2.1. Mining
- 5.2.2. Rubber Processing
- 5.2.3. Agrochemicals
- 5.2.4. Other Applications
- 5.3. Market Analysis, Insights and Forecast - by Region
- 5.3.1. Asia Pacific
- 5.3.2. North America
- 5.3.3. Europe
- 5.3.4. South America
- 5.3.5. Middle East and Africa
- 5.1. Market Analysis, Insights and Forecast - by Product Type
- 6. Global Xanthates Market Analysis, Insights and Forecast, 2021-2033
- 6.1. Market Analysis, Insights and Forecast - by Product Type
- 6.1.1. Sodium Ethyl Xanthate
- 6.1.2. Sodium Isopropyl Xanthate
- 6.1.3. Sodium Isobutyl Xanthate
- 6.1.4. Potassium Amyl Xanthate
- 6.1.5. Other Product Types
- 6.2. Market Analysis, Insights and Forecast - by Application
- 6.2.1. Mining
- 6.2.2. Rubber Processing
- 6.2.3. Agrochemicals
- 6.2.4. Other Applications
- 6.1. Market Analysis, Insights and Forecast - by Product Type
- 7. Asia Pacific Xanthates Market Analysis, Insights and Forecast, 2020-2032
- 7.1. Market Analysis, Insights and Forecast - by Product Type
- 7.1.1. Sodium Ethyl Xanthate
- 7.1.2. Sodium Isopropyl Xanthate
- 7.1.3. Sodium Isobutyl Xanthate
- 7.1.4. Potassium Amyl Xanthate
- 7.1.5. Other Product Types
- 7.2. Market Analysis, Insights and Forecast - by Application
- 7.2.1. Mining
- 7.2.2. Rubber Processing
- 7.2.3. Agrochemicals
- 7.2.4. Other Applications
- 7.1. Market Analysis, Insights and Forecast - by Product Type
- 8. North America Xanthates Market Analysis, Insights and Forecast, 2020-2032
- 8.1. Market Analysis, Insights and Forecast - by Product Type
- 8.1.1. Sodium Ethyl Xanthate
- 8.1.2. Sodium Isopropyl Xanthate
- 8.1.3. Sodium Isobutyl Xanthate
- 8.1.4. Potassium Amyl Xanthate
- 8.1.5. Other Product Types
- 8.2. Market Analysis, Insights and Forecast - by Application
- 8.2.1. Mining
- 8.2.2. Rubber Processing
- 8.2.3. Agrochemicals
- 8.2.4. Other Applications
- 8.1. Market Analysis, Insights and Forecast - by Product Type
- 9. Europe Xanthates Market Analysis, Insights and Forecast, 2020-2032
- 9.1. Market Analysis, Insights and Forecast - by Product Type
- 9.1.1. Sodium Ethyl Xanthate
- 9.1.2. Sodium Isopropyl Xanthate
- 9.1.3. Sodium Isobutyl Xanthate
- 9.1.4. Potassium Amyl Xanthate
- 9.1.5. Other Product Types
- 9.2. Market Analysis, Insights and Forecast - by Application
- 9.2.1. Mining
- 9.2.2. Rubber Processing
- 9.2.3. Agrochemicals
- 9.2.4. Other Applications
- 9.1. Market Analysis, Insights and Forecast - by Product Type
- 10. South America Xanthates Market Analysis, Insights and Forecast, 2020-2032
- 10.1. Market Analysis, Insights and Forecast - by Product Type
- 10.1.1. Sodium Ethyl Xanthate
- 10.1.2. Sodium Isopropyl Xanthate
- 10.1.3. Sodium Isobutyl Xanthate
- 10.1.4. Potassium Amyl Xanthate
- 10.1.5. Other Product Types
- 10.2. Market Analysis, Insights and Forecast - by Application
- 10.2.1. Mining
- 10.2.2. Rubber Processing
- 10.2.3. Agrochemicals
- 10.2.4. Other Applications
- 10.1. Market Analysis, Insights and Forecast - by Product Type
- 11. Middle East and Africa Xanthates Market Analysis, Insights and Forecast, 2020-2032
- 11.1. Market Analysis, Insights and Forecast - by Product Type
- 11.1.1. Sodium Ethyl Xanthate
- 11.1.2. Sodium Isopropyl Xanthate
- 11.1.3. Sodium Isobutyl Xanthate
- 11.1.4. Potassium Amyl Xanthate
- 11.1.5. Other Product Types
- 11.2. Market Analysis, Insights and Forecast - by Application
- 11.2.1. Mining
- 11.2.2. Rubber Processing
- 11.2.3. Agrochemicals
- 11.2.4. Other Applications
- 11.1. Market Analysis, Insights and Forecast - by Product Type
- 12. Competitive Analysis
- 12.1. Company Profiles
- 12.1.1 Vanderbilt Chemicals LLC
- 12.1.1.1. Company Overview
- 12.1.1.2. Products
- 12.1.1.3. Company Financials
- 12.1.1.4. SWOT Analysis
- 12.1.2 Yantai Humon Chemical Auxiliary Co Ltd
- 12.1.2.1. Company Overview
- 12.1.2.2. Products
- 12.1.2.3. Company Financials
- 12.1.2.4. SWOT Analysis
- 12.1.3 Tieling Flotation Reagent Co Ltd
- 12.1.3.1. Company Overview
- 12.1.3.2. Products
- 12.1.3.3. Company Financials
- 12.1.3.4. SWOT Analysis
- 12.1.4 Coogee Chemicals
- 12.1.4.1. Company Overview
- 12.1.4.2. Products
- 12.1.4.3. Company Financials
- 12.1.4.4. SWOT Analysis
- 12.1.5 Senmin International (Pty) Ltd
- 12.1.5.1. Company Overview
- 12.1.5.2. Products
- 12.1.5.3. Company Financials
- 12.1.5.4. SWOT Analysis
- 12.1.6 QiXia TongDa Flotation Reagent Co Ltd
- 12.1.6.1. Company Overview
- 12.1.6.2. Products
- 12.1.6.3. Company Financials
- 12.1.6.4. SWOT Analysis
- 12.1.7 CTC Energy & Mining Company
- 12.1.7.1. Company Overview
- 12.1.7.2. Products
- 12.1.7.3. Company Financials
- 12.1.7.4. SWOT Analysis
- 12.1.8 Orica Limited
- 12.1.8.1. Company Overview
- 12.1.8.2. Products
- 12.1.8.3. Company Financials
- 12.1.8.4. SWOT Analysis
- 12.1.9 Amruta Industries
- 12.1.9.1. Company Overview
- 12.1.9.2. Products
- 12.1.9.3. Company Financials
- 12.1.9.4. SWOT Analysis
- 12.1.10 SNF Group
- 12.1.10.1. Company Overview
- 12.1.10.2. Products
- 12.1.10.3. Company Financials
- 12.1.10.4. SWOT Analysis
- 12.1.1 Vanderbilt Chemicals LLC
- 12.2. Market Entropy
- 12.2.1 Company's Key Areas Served
- 12.2.2 Recent Developments
- 12.3. Company Market Share Analysis 2025
- 12.3.1 Top 5 Companies Market Share Analysis
- 12.3.2 Top 3 Companies Market Share Analysis
- 12.4. List of Potential Customers
- 13. Research Methodology
List of Figures
- Figure 1: Global Xanthates Market Revenue Breakdown (Million, %) by Region 2025 & 2033
- Figure 2: Global Xanthates Market Volume Breakdown (K Tons, %) by Region 2025 & 2033
- Figure 3: Asia Pacific Xanthates Market Revenue (Million), by Product Type 2025 & 2033
- Figure 4: Asia Pacific Xanthates Market Volume (K Tons), by Product Type 2025 & 2033
- Figure 5: Asia Pacific Xanthates Market Revenue Share (%), by Product Type 2025 & 2033
- Figure 6: Asia Pacific Xanthates Market Volume Share (%), by Product Type 2025 & 2033
- Figure 7: Asia Pacific Xanthates Market Revenue (Million), by Application 2025 & 2033
- Figure 8: Asia Pacific Xanthates Market Volume (K Tons), by Application 2025 & 2033
- Figure 9: Asia Pacific Xanthates Market Revenue Share (%), by Application 2025 & 2033
- Figure 10: Asia Pacific Xanthates Market Volume Share (%), by Application 2025 & 2033
- Figure 11: Asia Pacific Xanthates Market Revenue (Million), by Country 2025 & 2033
- Figure 12: Asia Pacific Xanthates Market Volume (K Tons), by Country 2025 & 2033
- Figure 13: Asia Pacific Xanthates Market Revenue Share (%), by Country 2025 & 2033
- Figure 14: Asia Pacific Xanthates Market Volume Share (%), by Country 2025 & 2033
- Figure 15: North America Xanthates Market Revenue (Million), by Product Type 2025 & 2033
- Figure 16: North America Xanthates Market Volume (K Tons), by Product Type 2025 & 2033
- Figure 17: North America Xanthates Market Revenue Share (%), by Product Type 2025 & 2033
- Figure 18: North America Xanthates Market Volume Share (%), by Product Type 2025 & 2033
- Figure 19: North America Xanthates Market Revenue (Million), by Application 2025 & 2033
- Figure 20: North America Xanthates Market Volume (K Tons), by Application 2025 & 2033
- Figure 21: North America Xanthates Market Revenue Share (%), by Application 2025 & 2033
- Figure 22: North America Xanthates Market Volume Share (%), by Application 2025 & 2033
- Figure 23: North America Xanthates Market Revenue (Million), by Country 2025 & 2033
- Figure 24: North America Xanthates Market Volume (K Tons), by Country 2025 & 2033
- Figure 25: North America Xanthates Market Revenue Share (%), by Country 2025 & 2033
- Figure 26: North America Xanthates Market Volume Share (%), by Country 2025 & 2033
- Figure 27: Europe Xanthates Market Revenue (Million), by Product Type 2025 & 2033
- Figure 28: Europe Xanthates Market Volume (K Tons), by Product Type 2025 & 2033
- Figure 29: Europe Xanthates Market Revenue Share (%), by Product Type 2025 & 2033
- Figure 30: Europe Xanthates Market Volume Share (%), by Product Type 2025 & 2033
- Figure 31: Europe Xanthates Market Revenue (Million), by Application 2025 & 2033
- Figure 32: Europe Xanthates Market Volume (K Tons), by Application 2025 & 2033
- Figure 33: Europe Xanthates Market Revenue Share (%), by Application 2025 & 2033
- Figure 34: Europe Xanthates Market Volume Share (%), by Application 2025 & 2033
- Figure 35: Europe Xanthates Market Revenue (Million), by Country 2025 & 2033
- Figure 36: Europe Xanthates Market Volume (K Tons), by Country 2025 & 2033
- Figure 37: Europe Xanthates Market Revenue Share (%), by Country 2025 & 2033
- Figure 38: Europe Xanthates Market Volume Share (%), by Country 2025 & 2033
- Figure 39: South America Xanthates Market Revenue (Million), by Product Type 2025 & 2033
- Figure 40: South America Xanthates Market Volume (K Tons), by Product Type 2025 & 2033
- Figure 41: South America Xanthates Market Revenue Share (%), by Product Type 2025 & 2033
- Figure 42: South America Xanthates Market Volume Share (%), by Product Type 2025 & 2033
- Figure 43: South America Xanthates Market Revenue (Million), by Application 2025 & 2033
- Figure 44: South America Xanthates Market Volume (K Tons), by Application 2025 & 2033
- Figure 45: South America Xanthates Market Revenue Share (%), by Application 2025 & 2033
- Figure 46: South America Xanthates Market Volume Share (%), by Application 2025 & 2033
- Figure 47: South America Xanthates Market Revenue (Million), by Country 2025 & 2033
- Figure 48: South America Xanthates Market Volume (K Tons), by Country 2025 & 2033
- Figure 49: South America Xanthates Market Revenue Share (%), by Country 2025 & 2033
- Figure 50: South America Xanthates Market Volume Share (%), by Country 2025 & 2033
- Figure 51: Middle East and Africa Xanthates Market Revenue (Million), by Product Type 2025 & 2033
- Figure 52: Middle East and Africa Xanthates Market Volume (K Tons), by Product Type 2025 & 2033
- Figure 53: Middle East and Africa Xanthates Market Revenue Share (%), by Product Type 2025 & 2033
- Figure 54: Middle East and Africa Xanthates Market Volume Share (%), by Product Type 2025 & 2033
- Figure 55: Middle East and Africa Xanthates Market Revenue (Million), by Application 2025 & 2033
- Figure 56: Middle East and Africa Xanthates Market Volume (K Tons), by Application 2025 & 2033
- Figure 57: Middle East and Africa Xanthates Market Revenue Share (%), by Application 2025 & 2033
- Figure 58: Middle East and Africa Xanthates Market Volume Share (%), by Application 2025 & 2033
- Figure 59: Middle East and Africa Xanthates Market Revenue (Million), by Country 2025 & 2033
- Figure 60: Middle East and Africa Xanthates Market Volume (K Tons), by Country 2025 & 2033
- Figure 61: Middle East and Africa Xanthates Market Revenue Share (%), by Country 2025 & 2033
- Figure 62: Middle East and Africa Xanthates Market Volume Share (%), by Country 2025 & 2033
List of Tables
- Table 1: Global Xanthates Market Revenue Million Forecast, by Product Type 2020 & 2033
- Table 2: Global Xanthates Market Volume K Tons Forecast, by Product Type 2020 & 2033
- Table 3: Global Xanthates Market Revenue Million Forecast, by Application 2020 & 2033
- Table 4: Global Xanthates Market Volume K Tons Forecast, by Application 2020 & 2033
- Table 5: Global Xanthates Market Revenue Million Forecast, by Region 2020 & 2033
- Table 6: Global Xanthates Market Volume K Tons Forecast, by Region 2020 & 2033
- Table 7: Global Xanthates Market Revenue Million Forecast, by Product Type 2020 & 2033
- Table 8: Global Xanthates Market Volume K Tons Forecast, by Product Type 2020 & 2033
- Table 9: Global Xanthates Market Revenue Million Forecast, by Application 2020 & 2033
- Table 10: Global Xanthates Market Volume K Tons Forecast, by Application 2020 & 2033
- Table 11: Global Xanthates Market Revenue Million Forecast, by Country 2020 & 2033
- Table 12: Global Xanthates Market Volume K Tons Forecast, by Country 2020 & 2033
- Table 13: China Xanthates Market Revenue (Million) Forecast, by Application 2020 & 2033
- Table 14: China Xanthates Market Volume (K Tons) Forecast, by Application 2020 & 2033
- Table 15: India Xanthates Market Revenue (Million) Forecast, by Application 2020 & 2033
- Table 16: India Xanthates Market Volume (K Tons) Forecast, by Application 2020 & 2033
- Table 17: Japan Xanthates Market Revenue (Million) Forecast, by Application 2020 & 2033
- Table 18: Japan Xanthates Market Volume (K Tons) Forecast, by Application 2020 & 2033
- Table 19: South Korea Xanthates Market Revenue (Million) Forecast, by Application 2020 & 2033
- Table 20: South Korea Xanthates Market Volume (K Tons) Forecast, by Application 2020 & 2033
- Table 21: Rest of Asia Pacific Xanthates Market Revenue (Million) Forecast, by Application 2020 & 2033
- Table 22: Rest of Asia Pacific Xanthates Market Volume (K Tons) Forecast, by Application 2020 & 2033
- Table 23: Global Xanthates Market Revenue Million Forecast, by Product Type 2020 & 2033
- Table 24: Global Xanthates Market Volume K Tons Forecast, by Product Type 2020 & 2033
- Table 25: Global Xanthates Market Revenue Million Forecast, by Application 2020 & 2033
- Table 26: Global Xanthates Market Volume K Tons Forecast, by Application 2020 & 2033
- Table 27: Global Xanthates Market Revenue Million Forecast, by Country 2020 & 2033
- Table 28: Global Xanthates Market Volume K Tons Forecast, by Country 2020 & 2033
- Table 29: United States Xanthates Market Revenue (Million) Forecast, by Application 2020 & 2033
- Table 30: United States Xanthates Market Volume (K Tons) Forecast, by Application 2020 & 2033
- Table 31: Canada Xanthates Market Revenue (Million) Forecast, by Application 2020 & 2033
- Table 32: Canada Xanthates Market Volume (K Tons) Forecast, by Application 2020 & 2033
- Table 33: Mexico Xanthates Market Revenue (Million) Forecast, by Application 2020 & 2033
- Table 34: Mexico Xanthates Market Volume (K Tons) Forecast, by Application 2020 & 2033
- Table 35: Global Xanthates Market Revenue Million Forecast, by Product Type 2020 & 2033
- Table 36: Global Xanthates Market Volume K Tons Forecast, by Product Type 2020 & 2033
- Table 37: Global Xanthates Market Revenue Million Forecast, by Application 2020 & 2033
- Table 38: Global Xanthates Market Volume K Tons Forecast, by Application 2020 & 2033
- Table 39: Global Xanthates Market Revenue Million Forecast, by Country 2020 & 2033
- Table 40: Global Xanthates Market Volume K Tons Forecast, by Country 2020 & 2033
- Table 41: Germany Xanthates Market Revenue (Million) Forecast, by Application 2020 & 2033
- Table 42: Germany Xanthates Market Volume (K Tons) Forecast, by Application 2020 & 2033
- Table 43: United Kingdom Xanthates Market Revenue (Million) Forecast, by Application 2020 & 2033
- Table 44: United Kingdom Xanthates Market Volume (K Tons) Forecast, by Application 2020 & 2033
- Table 45: Italy Xanthates Market Revenue (Million) Forecast, by Application 2020 & 2033
- Table 46: Italy Xanthates Market Volume (K Tons) Forecast, by Application 2020 & 2033
- Table 47: France Xanthates Market Revenue (Million) Forecast, by Application 2020 & 2033
- Table 48: France Xanthates Market Volume (K Tons) Forecast, by Application 2020 & 2033
- Table 49: Rest of Europe Xanthates Market Revenue (Million) Forecast, by Application 2020 & 2033
- Table 50: Rest of Europe Xanthates Market Volume (K Tons) Forecast, by Application 2020 & 2033
- Table 51: Global Xanthates Market Revenue Million Forecast, by Product Type 2020 & 2033
- Table 52: Global Xanthates Market Volume K Tons Forecast, by Product Type 2020 & 2033
- Table 53: Global Xanthates Market Revenue Million Forecast, by Application 2020 & 2033
- Table 54: Global Xanthates Market Volume K Tons Forecast, by Application 2020 & 2033
- Table 55: Global Xanthates Market Revenue Million Forecast, by Country 2020 & 2033
- Table 56: Global Xanthates Market Volume K Tons Forecast, by Country 2020 & 2033
- Table 57: Brazil Xanthates Market Revenue (Million) Forecast, by Application 2020 & 2033
- Table 58: Brazil Xanthates Market Volume (K Tons) Forecast, by Application 2020 & 2033
- Table 59: Argentina Xanthates Market Revenue (Million) Forecast, by Application 2020 & 2033
- Table 60: Argentina Xanthates Market Volume (K Tons) Forecast, by Application 2020 & 2033
- Table 61: Rest of South America Xanthates Market Revenue (Million) Forecast, by Application 2020 & 2033
- Table 62: Rest of South America Xanthates Market Volume (K Tons) Forecast, by Application 2020 & 2033
- Table 63: Global Xanthates Market Revenue Million Forecast, by Product Type 2020 & 2033
- Table 64: Global Xanthates Market Volume K Tons Forecast, by Product Type 2020 & 2033
- Table 65: Global Xanthates Market Revenue Million Forecast, by Application 2020 & 2033
- Table 66: Global Xanthates Market Volume K Tons Forecast, by Application 2020 & 2033
- Table 67: Global Xanthates Market Revenue Million Forecast, by Country 2020 & 2033
- Table 68: Global Xanthates Market Volume K Tons Forecast, by Country 2020 & 2033
- Table 69: Saudi Arabia Xanthates Market Revenue (Million) Forecast, by Application 2020 & 2033
- Table 70: Saudi Arabia Xanthates Market Volume (K Tons) Forecast, by Application 2020 & 2033
- Table 71: South Africa Xanthates Market Revenue (Million) Forecast, by Application 2020 & 2033
- Table 72: South Africa Xanthates Market Volume (K Tons) Forecast, by Application 2020 & 2033
- Table 73: Rest of Middle East and Africa Xanthates Market Revenue (Million) Forecast, by Application 2020 & 2033
- Table 74: Rest of Middle East and Africa Xanthates Market Volume (K Tons) Forecast, by Application 2020 & 2033
Frequently Asked Questions
1. What is the projected Compound Annual Growth Rate (CAGR) of the Xanthates Market?
The projected CAGR is approximately 6.8%.
2. Which companies are prominent players in the Xanthates Market?
Key companies in the market include Vanderbilt Chemicals LLC, Yantai Humon Chemical Auxiliary Co Ltd, Tieling Flotation Reagent Co Ltd, Coogee Chemicals, Senmin International (Pty) Ltd, QiXia TongDa Flotation Reagent Co Ltd, CTC Energy & Mining Company, Orica Limited, Amruta Industries, SNF Group.
3. What are the main segments of the Xanthates Market?
The market segments include Product Type, Application.
4. Can you provide details about the market size?
The market size is estimated to be USD 863.6 Million as of 2022.
5. What are some drivers contributing to market growth?
Rising Mining Activities Across the Globe; Widening Use of Xanthates in Rubber Industry.
6. What are the notable trends driving market growth?
Rising Mining Activities Across the Globe.
7. Are there any restraints impacting market growth?
Emergence of Xanthates Replacement Technology; Environmental Regulations Associated with Mining Activities.
8. Can you provide examples of recent developments in the market?
N/A
9. What pricing options are available for accessing the report?
Pricing options include single-user, multi-user, and enterprise licenses priced at USD 4750, USD 5250, and USD 8750 respectively.
10. Is the market size provided in terms of value or volume?
The market size is provided in terms of value, measured in Million and volume, measured in K Tons.
11. Are there any specific market keywords associated with the report?
Yes, the market keyword associated with the report is "Xanthates Market," which aids in identifying and referencing the specific market segment covered.
12. How do I determine which pricing option suits my needs best?
The pricing options vary based on user requirements and access needs. Individual users may opt for single-user licenses, while businesses requiring broader access may choose multi-user or enterprise licenses for cost-effective access to the report.
13. Are there any additional resources or data provided in the Xanthates Market report?
While the report offers comprehensive insights, it's advisable to review the specific contents or supplementary materials provided to ascertain if additional resources or data are available.
14. How can I stay updated on further developments or reports in the Xanthates Market?
To stay informed about further developments, trends, and reports in the Xanthates Market, consider subscribing to industry newsletters, following relevant companies and organizations, or regularly checking reputable industry news sources and publications.
Methodology
Step 1 - Identification of Relevant Samples Size from Population Database


Step 2 - Approaches for Defining Global Market Size (Value, Volume* & Price*)

Note*: In applicable scenarios
Step 3 - Data Sources
Primary Research
- Web Analytics
- Survey Reports
- Research Institute
- Latest Research Reports
- Opinion Leaders
Secondary Research
- Annual Reports
- White Paper
- Latest Press Release
- Industry Association
- Paid Database
- Investor Presentations

Step 4 - Data Triangulation
Involves using different sources of information in order to increase the validity of a study
These sources are likely to be stakeholders in a program - participants, other researchers, program staff, other community members, and so on.
Then we put all data in single framework & apply various statistical tools to find out the dynamic on the market.
During the analysis stage, feedback from the stakeholder groups would be compared to determine areas of agreement as well as areas of divergence