

Key Insights
The global zeolite molecular sieve market is experiencing significant expansion, projected to reach $1729 million by 2025, with a Compound Annual Growth Rate (CAGR) of 3.9% from 2025 to 2033. This growth is propelled by increasing demand across key industries, notably the petrochemical sector, where zeolites are crucial for catalysis and separation. The growing emphasis on environmental sustainability and stricter regulations are driving the adoption of zeolites for air and water purification. Furthermore, the development of energy-efficient heating and refrigeration systems, utilizing zeolite adsorption technologies, contributes substantially to market expansion. While natural zeolites currently lead due to cost-effectiveness and availability, synthetic zeolites are gaining prominence for their enhanced performance in specialized applications. The Asia-Pacific region, led by China and India, is anticipated to be the largest market, fueled by rapid industrialization and infrastructure development.
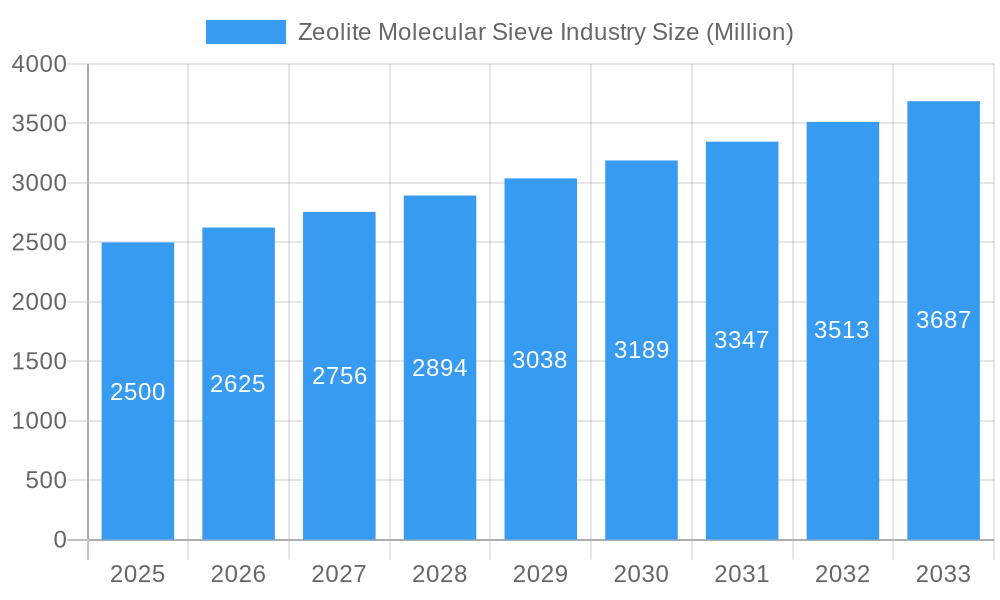
Zeolite Molecular Sieve Industry Market Size (In Billion)
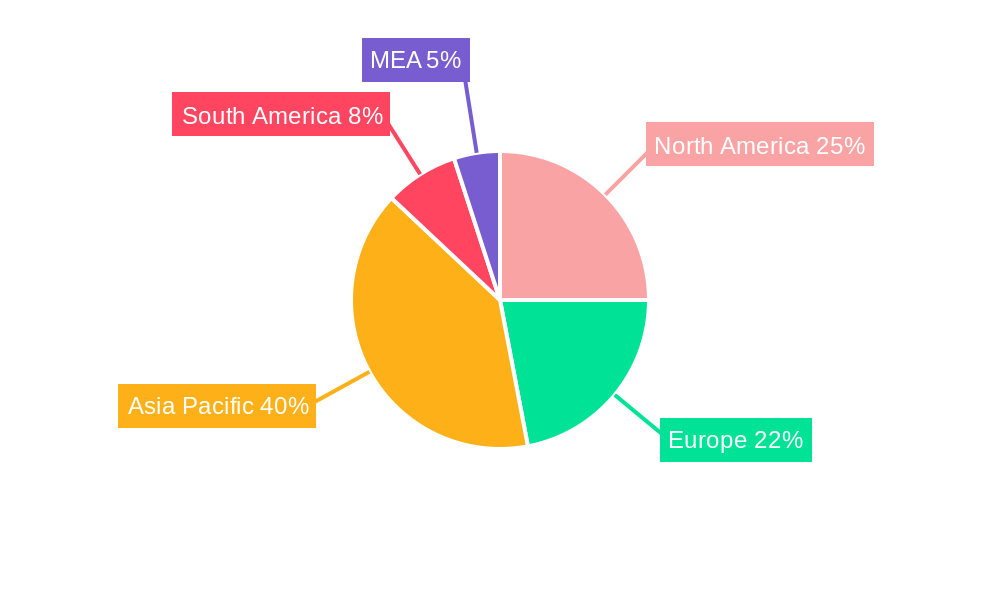
Geographically, North America and Europe are significant contributors to market revenue. However, the Asia-Pacific region is poised for the most rapid growth, driven by industrialization and a commitment to environmental sustainability. End-use segmentation highlights strong demand from the petrochemical, agricultural, and water treatment industries. The market is characterized by the presence of major players like BASF SE, Clariant AG, and Zeolyst, alongside numerous regional contributors, fostering innovation and competition. Potential challenges include raw material price volatility and the emergence of alternative technologies. Despite these factors, the overall outlook for the zeolite molecular sieve market remains robust, driven by the continuous need for efficient and sustainable solutions across diverse industrial applications.
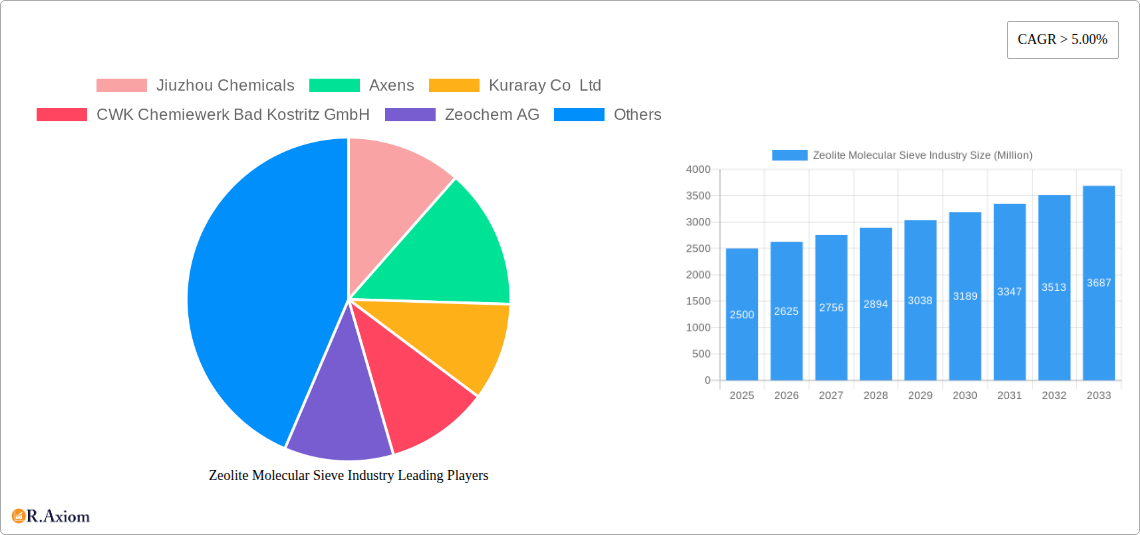
Zeolite Molecular Sieve Industry Company Market Share
Zeolite Molecular Sieve Industry: A Comprehensive Market Report (2019-2033)
This comprehensive report provides an in-depth analysis of the Zeolite Molecular Sieve industry, covering market size, segmentation, competitive landscape, and future growth prospects from 2019 to 2033. The report utilizes data from the historical period (2019-2024), the base year (2025), and the forecast period (2025-2033) to offer actionable insights for industry stakeholders. The global market value is estimated at xx Million in 2025 and is projected to reach xx Million by 2033.
Zeolite Molecular Sieve Industry Market Concentration & Innovation
The Zeolite Molecular Sieve industry exhibits a moderately concentrated market structure, with key players such as BASF SE, Arkema Group, and Zeolyst holding significant market share. However, the presence of numerous smaller regional players and emerging companies fosters competition. Market share data for 2025 estimates BASF SE at approximately 15%, Arkema Group at 12%, and Zeolyst at 10%, with the remaining share distributed among other companies including Jiuzhou Chemicals, Axens, Kuraray Co Ltd, CWK Chemiewerk Bad Kostritz GmbH, Zeochem AG, Sorbead India, Tosoh Corp, KNT Group, Hengye Group, W R Grace, and Clariant AG. Innovation in the industry is driven by the need for enhanced selectivity, thermal stability, and cost-effectiveness of zeolite molecular sieves. This is fueled by ongoing research into novel synthesis methods and modifications to existing structures. Regulatory frameworks, such as environmental regulations concerning emissions and waste disposal, significantly impact the industry. Product substitutes, such as activated carbon and other adsorbents, pose a competitive challenge. End-user trends, particularly in the petrochemical and water treatment sectors, strongly influence demand. Recent M&A activities, though not extensively documented with precise deal values (xx Million estimated total deal value in the last 5 years), indicate consolidation and expansion strategies among industry players.
- Market Concentration: Moderate, with a few dominant players and numerous smaller companies.
- Innovation Drivers: Enhanced selectivity, thermal stability, cost reduction.
- Regulatory Frameworks: Environmental regulations impacting production and disposal.
- Product Substitutes: Activated carbon, other adsorbents.
- End-User Trends: Growing demand from petrochemical and water treatment sectors.
- M&A Activities: Consolidation and expansion strategies observed in recent years.
Zeolite Molecular Sieve Industry Industry Trends & Insights
The global Zeolite Molecular Sieve market is experiencing robust growth, driven primarily by the increasing demand from various end-use industries. The compound annual growth rate (CAGR) during the forecast period (2025-2033) is projected to be approximately xx%. Market penetration is particularly strong in developed economies with established industrial bases. Key growth drivers include stringent environmental regulations promoting cleaner technologies, the rising demand for efficient separation and purification processes in various industries, and advancements in zeolite synthesis and modification techniques. Technological disruptions, such as the development of novel zeolite structures with enhanced properties, are continually reshaping the market landscape. Consumer preferences are shifting towards high-performance, cost-effective, and environmentally friendly solutions. Intense competitive dynamics among existing players and new entrants drive innovation and price competition. Market penetration of specific applications, like air purification and industrial gas production, continues to rise, especially in emerging economies. The market is projected to show a significant expansion in specific applications within the next decade.
Dominant Markets & Segments in Zeolite Molecular Sieve Industry
The Asia-Pacific region dominates the global Zeolite Molecular Sieve market, driven by rapid industrialization and significant investments in infrastructure development. China, in particular, is a major contributor to this growth due to its large-scale industrial activities and the implementation of stringent environmental regulations.
Dominant Segments:
- Raw Material: Artificial zeolite holds a larger market share compared to natural zeolite due to its superior and consistent properties for specific applications.
- End-use: Petrochemical applications are the leading segment, followed by waste and water treatment, driven by rising environmental concerns and increasing industrial effluent. Other significant segments include industrial gas production, air purification, and detergent.
Key Drivers:
- Asia-Pacific: Rapid industrialization, infrastructure development, stringent environmental regulations.
- Petrochemical: Growing demand for efficient separation and purification processes.
- Waste & Water Treatment: Stringent environmental regulations, rising industrial effluent.
Zeolite Molecular Sieve Industry Product Developments
Recent product innovations focus on developing zeolites with enhanced selectivity, stability, and durability for specific applications. This involves modifications to existing structures and the synthesis of novel zeolite materials. For example, the development of hierarchical zeolites with improved mass transfer properties has broadened their applications in catalysis and adsorption. These advancements create competitive advantages by offering superior performance, energy efficiency, and environmental benefits. The market is seeing more tailored zeolites optimized for particular processes.
Report Scope & Segmentation Analysis
This report segments the Zeolite Molecular Sieve market based on raw material (Natural Zeolite, Artificial Zeolite) and end-use (Air Purification, Detergent, Heating and Refrigeration, Industrial Gas Production, Petrochemical, Agricultural Products, Waste and Water Treatment, Other End-uses). Each segment is analyzed in terms of its market size, growth projections, and competitive dynamics. For example, the artificial zeolite segment is experiencing faster growth than the natural zeolite segment due to its superior and consistent quality. Similarly, petrochemical and water treatment are the fastest-growing end-use segments. Market sizes and growth projections are provided for each segment in the full report. The competitive dynamics within each segment are also analyzed, highlighting key players and their market strategies.
Key Drivers of Zeolite Molecular Sieve Industry Growth
The growth of the Zeolite Molecular Sieve industry is driven by several factors. Stringent environmental regulations are promoting the adoption of cleaner technologies, increasing the demand for zeolites in waste and water treatment. The rising demand for efficient separation and purification processes across various industries, particularly in petrochemicals and pharmaceuticals, fuels growth. Advancements in zeolite synthesis and modification techniques lead to the development of higher-performing materials suitable for a wider range of applications. Finally, continuous growth and expansion of the chemical industry itself fuel demand for improved separation and purification solutions.
Challenges in the Zeolite Molecular Sieve Industry Sector
The Zeolite Molecular Sieve industry faces several challenges. Fluctuations in raw material prices, particularly for natural zeolites, can impact profitability. Supply chain disruptions can affect production and delivery timelines. Intense competition from established players and new entrants creates pressure on pricing and margins. Furthermore, the energy intensive nature of zeolite production and the complexity of waste disposal contribute to production costs.
Emerging Opportunities in Zeolite Molecular Sieve Industry
Emerging opportunities lie in the development of novel zeolite structures with enhanced functionalities, tailored for specific applications in areas such as carbon capture and energy storage. Growing demand for high-performance materials in emerging markets presents significant growth potential. Furthermore, advancements in synthesis techniques and the integration of zeolites into innovative technologies could create new markets.
Leading Players in the Zeolite Molecular Sieve Industry Market
Key Developments in Zeolite Molecular Sieve Industry Industry
- 2022 Q3: BASF SE announced the expansion of its zeolite production capacity in Germany.
- 2023 Q1: Zeolyst launched a new generation of high-performance zeolite catalysts for the petrochemical industry.
- 2024 Q2: Arkema Group acquired a smaller zeolite producer, strengthening its market position. (Further developments will be added to the full report)
Strategic Outlook for Zeolite Molecular Sieve Industry Market
The Zeolite Molecular Sieve market is poised for continued growth, driven by the increasing demand for efficient separation and purification technologies across diverse industries. New applications, particularly in emerging sectors like carbon capture and energy storage, hold significant potential. Technological advancements and strategic partnerships will be crucial for companies to maintain competitiveness. The market is expected to remain robust throughout the forecast period, exhibiting substantial expansion in diverse segments.
Zeolite Molecular Sieve Industry Segmentation
-
1. Raw Material
- 1.1. Natural Zeolite
- 1.2. Artificial Zeolite
-
2. End-use
- 2.1. Air Purification
- 2.2. Detergent
- 2.3. Heating and Refrigeration
- 2.4. Industrial Gas Production
- 2.5. Petrochemical
- 2.6. Agricultural Products
- 2.7. Waste and Water Treatment
- 2.8. Other End-uses
Zeolite Molecular Sieve Industry Segmentation By Geography
-
1. Asia Pacific
- 1.1. China
- 1.2. India
- 1.3. Japan
- 1.4. South Korea
- 1.5. Rest of Asia Pacific
-
2. North America
- 2.1. United States
- 2.2. Canada
- 2.3. Mexico
-
3. Europe
- 3.1. Germany
- 3.2. United Kingdom
- 3.3. France
- 3.4. Italy
- 3.5. Rest of Europe
-
4. South America
- 4.1. Brazil
- 4.2. Argentina
- 4.3. Rest of South America
- 5. Middle East
-
6. Saudi Arabia
- 6.1. South Africa
- 6.2. Rest of Middle East
Zeolite Molecular Sieve Industry Regional Market Share
Geographic Coverage of Zeolite Molecular Sieve Industry
Zeolite Molecular Sieve Industry REPORT HIGHLIGHTS
| Aspects | Details |
|---|---|
| Study Period | 2020-2034 |
| Base Year | 2025 |
| Estimated Year | 2026 |
| Forecast Period | 2026-2034 |
| Historical Period | 2020-2025 |
| Growth Rate | CAGR of 3.9% from 2020-2034 |
| Segmentation |
|
Table of Contents
- 1. Introduction
- 1.1. Research Scope
- 1.2. Market Segmentation
- 1.3. Research Objective
- 1.4. Definitions and Assumptions
- 2. Executive Summary
- 2.1. Market Snapshot
- 3. Market Dynamics
- 3.1. Market Drivers
- 3.2. Market Restrains
- 3.3. Market Trends
- 3.4. Market Opportunities
- 4. Market Factor Analysis
- 4.1. Porters Five Forces
- 4.1.1. Bargaining Power of Suppliers
- 4.1.2. Bargaining Power of Buyers
- 4.1.3. Threat of New Entrants
- 4.1.4. Threat of Substitutes
- 4.1.5. Competitive Rivalry
- 4.2. PESTEL analysis
- 4.3. BCG Analysis
- 4.3.1. Stars (High Growth, High Market Share)
- 4.3.2. Cash Cows (Low Growth, High Market Share)
- 4.3.3. Question Mark (High Growth, Low Market Share)
- 4.3.4. Dogs (Low Growth, Low Market Share)
- 4.4. Ansoff Matrix Analysis
- 4.5. Supply Chain Analysis
- 4.6. Regulatory Landscape
- 4.7. Current Market Potential and Opportunity Assessment (TAM–SAM–SOM Framework)
- 4.8. RAX Analyst Note
- 4.1. Porters Five Forces
- 5. Market Analysis, Insights and Forecast 2021-2033
- 5.1. Market Analysis, Insights and Forecast - by Raw Material
- 5.1.1. Natural Zeolite
- 5.1.2. Artificial Zeolite
- 5.2. Market Analysis, Insights and Forecast - by End-use
- 5.2.1. Air Purification
- 5.2.2. Detergent
- 5.2.3. Heating and Refrigeration
- 5.2.4. Industrial Gas Production
- 5.2.5. Petrochemical
- 5.2.6. Agricultural Products
- 5.2.7. Waste and Water Treatment
- 5.2.8. Other End-uses
- 5.3. Market Analysis, Insights and Forecast - by Region
- 5.3.1. Asia Pacific
- 5.3.2. North America
- 5.3.3. Europe
- 5.3.4. South America
- 5.3.5. Middle East
- 5.3.6. Saudi Arabia
- 5.1. Market Analysis, Insights and Forecast - by Raw Material
- 6. Global Zeolite Molecular Sieve Industry Analysis, Insights and Forecast, 2021-2033
- 6.1. Market Analysis, Insights and Forecast - by Raw Material
- 6.1.1. Natural Zeolite
- 6.1.2. Artificial Zeolite
- 6.2. Market Analysis, Insights and Forecast - by End-use
- 6.2.1. Air Purification
- 6.2.2. Detergent
- 6.2.3. Heating and Refrigeration
- 6.2.4. Industrial Gas Production
- 6.2.5. Petrochemical
- 6.2.6. Agricultural Products
- 6.2.7. Waste and Water Treatment
- 6.2.8. Other End-uses
- 6.1. Market Analysis, Insights and Forecast - by Raw Material
- 7. Asia Pacific Zeolite Molecular Sieve Industry Analysis, Insights and Forecast, 2020-2032
- 7.1. Market Analysis, Insights and Forecast - by Raw Material
- 7.1.1. Natural Zeolite
- 7.1.2. Artificial Zeolite
- 7.2. Market Analysis, Insights and Forecast - by End-use
- 7.2.1. Air Purification
- 7.2.2. Detergent
- 7.2.3. Heating and Refrigeration
- 7.2.4. Industrial Gas Production
- 7.2.5. Petrochemical
- 7.2.6. Agricultural Products
- 7.2.7. Waste and Water Treatment
- 7.2.8. Other End-uses
- 7.1. Market Analysis, Insights and Forecast - by Raw Material
- 8. North America Zeolite Molecular Sieve Industry Analysis, Insights and Forecast, 2020-2032
- 8.1. Market Analysis, Insights and Forecast - by Raw Material
- 8.1.1. Natural Zeolite
- 8.1.2. Artificial Zeolite
- 8.2. Market Analysis, Insights and Forecast - by End-use
- 8.2.1. Air Purification
- 8.2.2. Detergent
- 8.2.3. Heating and Refrigeration
- 8.2.4. Industrial Gas Production
- 8.2.5. Petrochemical
- 8.2.6. Agricultural Products
- 8.2.7. Waste and Water Treatment
- 8.2.8. Other End-uses
- 8.1. Market Analysis, Insights and Forecast - by Raw Material
- 9. Europe Zeolite Molecular Sieve Industry Analysis, Insights and Forecast, 2020-2032
- 9.1. Market Analysis, Insights and Forecast - by Raw Material
- 9.1.1. Natural Zeolite
- 9.1.2. Artificial Zeolite
- 9.2. Market Analysis, Insights and Forecast - by End-use
- 9.2.1. Air Purification
- 9.2.2. Detergent
- 9.2.3. Heating and Refrigeration
- 9.2.4. Industrial Gas Production
- 9.2.5. Petrochemical
- 9.2.6. Agricultural Products
- 9.2.7. Waste and Water Treatment
- 9.2.8. Other End-uses
- 9.1. Market Analysis, Insights and Forecast - by Raw Material
- 10. South America Zeolite Molecular Sieve Industry Analysis, Insights and Forecast, 2020-2032
- 10.1. Market Analysis, Insights and Forecast - by Raw Material
- 10.1.1. Natural Zeolite
- 10.1.2. Artificial Zeolite
- 10.2. Market Analysis, Insights and Forecast - by End-use
- 10.2.1. Air Purification
- 10.2.2. Detergent
- 10.2.3. Heating and Refrigeration
- 10.2.4. Industrial Gas Production
- 10.2.5. Petrochemical
- 10.2.6. Agricultural Products
- 10.2.7. Waste and Water Treatment
- 10.2.8. Other End-uses
- 10.1. Market Analysis, Insights and Forecast - by Raw Material
- 11. Middle East Zeolite Molecular Sieve Industry Analysis, Insights and Forecast, 2020-2032
- 11.1. Market Analysis, Insights and Forecast - by Raw Material
- 11.1.1. Natural Zeolite
- 11.1.2. Artificial Zeolite
- 11.2. Market Analysis, Insights and Forecast - by End-use
- 11.2.1. Air Purification
- 11.2.2. Detergent
- 11.2.3. Heating and Refrigeration
- 11.2.4. Industrial Gas Production
- 11.2.5. Petrochemical
- 11.2.6. Agricultural Products
- 11.2.7. Waste and Water Treatment
- 11.2.8. Other End-uses
- 11.1. Market Analysis, Insights and Forecast - by Raw Material
- 12. Saudi Arabia Zeolite Molecular Sieve Industry Analysis, Insights and Forecast, 2020-2032
- 12.1. Market Analysis, Insights and Forecast - by Raw Material
- 12.1.1. Natural Zeolite
- 12.1.2. Artificial Zeolite
- 12.2. Market Analysis, Insights and Forecast - by End-use
- 12.2.1. Air Purification
- 12.2.2. Detergent
- 12.2.3. Heating and Refrigeration
- 12.2.4. Industrial Gas Production
- 12.2.5. Petrochemical
- 12.2.6. Agricultural Products
- 12.2.7. Waste and Water Treatment
- 12.2.8. Other End-uses
- 12.1. Market Analysis, Insights and Forecast - by Raw Material
- 13. Competitive Analysis
- 13.1. Company Profiles
- 13.1.1 Jiuzhou Chemicals
- 13.1.1.1. Company Overview
- 13.1.1.2. Products
- 13.1.1.3. Company Financials
- 13.1.1.4. SWOT Analysis
- 13.1.2 Axens
- 13.1.2.1. Company Overview
- 13.1.2.2. Products
- 13.1.2.3. Company Financials
- 13.1.2.4. SWOT Analysis
- 13.1.3 Kuraray Co Ltd
- 13.1.3.1. Company Overview
- 13.1.3.2. Products
- 13.1.3.3. Company Financials
- 13.1.3.4. SWOT Analysis
- 13.1.4 CWK Chemiewerk Bad Kostritz GmbH
- 13.1.4.1. Company Overview
- 13.1.4.2. Products
- 13.1.4.3. Company Financials
- 13.1.4.4. SWOT Analysis
- 13.1.5 Zeochem AG
- 13.1.5.1. Company Overview
- 13.1.5.2. Products
- 13.1.5.3. Company Financials
- 13.1.5.4. SWOT Analysis
- 13.1.6 Sorbead India
- 13.1.6.1. Company Overview
- 13.1.6.2. Products
- 13.1.6.3. Company Financials
- 13.1.6.4. SWOT Analysis
- 13.1.7 Tosoh Corp
- 13.1.7.1. Company Overview
- 13.1.7.2. Products
- 13.1.7.3. Company Financials
- 13.1.7.4. SWOT Analysis
- 13.1.8 KNT Group
- 13.1.8.1. Company Overview
- 13.1.8.2. Products
- 13.1.8.3. Company Financials
- 13.1.8.4. SWOT Analysis
- 13.1.9 BASF SE
- 13.1.9.1. Company Overview
- 13.1.9.2. Products
- 13.1.9.3. Company Financials
- 13.1.9.4. SWOT Analysis
- 13.1.10 Arkema Group
- 13.1.10.1. Company Overview
- 13.1.10.2. Products
- 13.1.10.3. Company Financials
- 13.1.10.4. SWOT Analysis
- 13.1.11 Zeolyst
- 13.1.11.1. Company Overview
- 13.1.11.2. Products
- 13.1.11.3. Company Financials
- 13.1.11.4. SWOT Analysis
- 13.1.12 Hengye Group
- 13.1.12.1. Company Overview
- 13.1.12.2. Products
- 13.1.12.3. Company Financials
- 13.1.12.4. SWOT Analysis
- 13.1.13 W R Grace
- 13.1.13.1. Company Overview
- 13.1.13.2. Products
- 13.1.13.3. Company Financials
- 13.1.13.4. SWOT Analysis
- 13.1.14 Clariant AG
- 13.1.14.1. Company Overview
- 13.1.14.2. Products
- 13.1.14.3. Company Financials
- 13.1.14.4. SWOT Analysis
- 13.1.1 Jiuzhou Chemicals
- 13.2. Market Entropy
- 13.2.1 Company's Key Areas Served
- 13.2.2 Recent Developments
- 13.3. Company Market Share Analysis 2025
- 13.3.1 Top 5 Companies Market Share Analysis
- 13.3.2 Top 3 Companies Market Share Analysis
- 13.4. List of Potential Customers
- 14. Research Methodology
List of Figures
- Figure 1: Global Zeolite Molecular Sieve Industry Revenue Breakdown (million, %) by Region 2025 & 2033
- Figure 2: Global Zeolite Molecular Sieve Industry Volume Breakdown (K Tons, %) by Region 2025 & 2033
- Figure 3: Asia Pacific Zeolite Molecular Sieve Industry Revenue (million), by Raw Material 2025 & 2033
- Figure 4: Asia Pacific Zeolite Molecular Sieve Industry Volume (K Tons), by Raw Material 2025 & 2033
- Figure 5: Asia Pacific Zeolite Molecular Sieve Industry Revenue Share (%), by Raw Material 2025 & 2033
- Figure 6: Asia Pacific Zeolite Molecular Sieve Industry Volume Share (%), by Raw Material 2025 & 2033
- Figure 7: Asia Pacific Zeolite Molecular Sieve Industry Revenue (million), by End-use 2025 & 2033
- Figure 8: Asia Pacific Zeolite Molecular Sieve Industry Volume (K Tons), by End-use 2025 & 2033
- Figure 9: Asia Pacific Zeolite Molecular Sieve Industry Revenue Share (%), by End-use 2025 & 2033
- Figure 10: Asia Pacific Zeolite Molecular Sieve Industry Volume Share (%), by End-use 2025 & 2033
- Figure 11: Asia Pacific Zeolite Molecular Sieve Industry Revenue (million), by Country 2025 & 2033
- Figure 12: Asia Pacific Zeolite Molecular Sieve Industry Volume (K Tons), by Country 2025 & 2033
- Figure 13: Asia Pacific Zeolite Molecular Sieve Industry Revenue Share (%), by Country 2025 & 2033
- Figure 14: Asia Pacific Zeolite Molecular Sieve Industry Volume Share (%), by Country 2025 & 2033
- Figure 15: North America Zeolite Molecular Sieve Industry Revenue (million), by Raw Material 2025 & 2033
- Figure 16: North America Zeolite Molecular Sieve Industry Volume (K Tons), by Raw Material 2025 & 2033
- Figure 17: North America Zeolite Molecular Sieve Industry Revenue Share (%), by Raw Material 2025 & 2033
- Figure 18: North America Zeolite Molecular Sieve Industry Volume Share (%), by Raw Material 2025 & 2033
- Figure 19: North America Zeolite Molecular Sieve Industry Revenue (million), by End-use 2025 & 2033
- Figure 20: North America Zeolite Molecular Sieve Industry Volume (K Tons), by End-use 2025 & 2033
- Figure 21: North America Zeolite Molecular Sieve Industry Revenue Share (%), by End-use 2025 & 2033
- Figure 22: North America Zeolite Molecular Sieve Industry Volume Share (%), by End-use 2025 & 2033
- Figure 23: North America Zeolite Molecular Sieve Industry Revenue (million), by Country 2025 & 2033
- Figure 24: North America Zeolite Molecular Sieve Industry Volume (K Tons), by Country 2025 & 2033
- Figure 25: North America Zeolite Molecular Sieve Industry Revenue Share (%), by Country 2025 & 2033
- Figure 26: North America Zeolite Molecular Sieve Industry Volume Share (%), by Country 2025 & 2033
- Figure 27: Europe Zeolite Molecular Sieve Industry Revenue (million), by Raw Material 2025 & 2033
- Figure 28: Europe Zeolite Molecular Sieve Industry Volume (K Tons), by Raw Material 2025 & 2033
- Figure 29: Europe Zeolite Molecular Sieve Industry Revenue Share (%), by Raw Material 2025 & 2033
- Figure 30: Europe Zeolite Molecular Sieve Industry Volume Share (%), by Raw Material 2025 & 2033
- Figure 31: Europe Zeolite Molecular Sieve Industry Revenue (million), by End-use 2025 & 2033
- Figure 32: Europe Zeolite Molecular Sieve Industry Volume (K Tons), by End-use 2025 & 2033
- Figure 33: Europe Zeolite Molecular Sieve Industry Revenue Share (%), by End-use 2025 & 2033
- Figure 34: Europe Zeolite Molecular Sieve Industry Volume Share (%), by End-use 2025 & 2033
- Figure 35: Europe Zeolite Molecular Sieve Industry Revenue (million), by Country 2025 & 2033
- Figure 36: Europe Zeolite Molecular Sieve Industry Volume (K Tons), by Country 2025 & 2033
- Figure 37: Europe Zeolite Molecular Sieve Industry Revenue Share (%), by Country 2025 & 2033
- Figure 38: Europe Zeolite Molecular Sieve Industry Volume Share (%), by Country 2025 & 2033
- Figure 39: South America Zeolite Molecular Sieve Industry Revenue (million), by Raw Material 2025 & 2033
- Figure 40: South America Zeolite Molecular Sieve Industry Volume (K Tons), by Raw Material 2025 & 2033
- Figure 41: South America Zeolite Molecular Sieve Industry Revenue Share (%), by Raw Material 2025 & 2033
- Figure 42: South America Zeolite Molecular Sieve Industry Volume Share (%), by Raw Material 2025 & 2033
- Figure 43: South America Zeolite Molecular Sieve Industry Revenue (million), by End-use 2025 & 2033
- Figure 44: South America Zeolite Molecular Sieve Industry Volume (K Tons), by End-use 2025 & 2033
- Figure 45: South America Zeolite Molecular Sieve Industry Revenue Share (%), by End-use 2025 & 2033
- Figure 46: South America Zeolite Molecular Sieve Industry Volume Share (%), by End-use 2025 & 2033
- Figure 47: South America Zeolite Molecular Sieve Industry Revenue (million), by Country 2025 & 2033
- Figure 48: South America Zeolite Molecular Sieve Industry Volume (K Tons), by Country 2025 & 2033
- Figure 49: South America Zeolite Molecular Sieve Industry Revenue Share (%), by Country 2025 & 2033
- Figure 50: South America Zeolite Molecular Sieve Industry Volume Share (%), by Country 2025 & 2033
- Figure 51: Middle East Zeolite Molecular Sieve Industry Revenue (million), by Raw Material 2025 & 2033
- Figure 52: Middle East Zeolite Molecular Sieve Industry Volume (K Tons), by Raw Material 2025 & 2033
- Figure 53: Middle East Zeolite Molecular Sieve Industry Revenue Share (%), by Raw Material 2025 & 2033
- Figure 54: Middle East Zeolite Molecular Sieve Industry Volume Share (%), by Raw Material 2025 & 2033
- Figure 55: Middle East Zeolite Molecular Sieve Industry Revenue (million), by End-use 2025 & 2033
- Figure 56: Middle East Zeolite Molecular Sieve Industry Volume (K Tons), by End-use 2025 & 2033
- Figure 57: Middle East Zeolite Molecular Sieve Industry Revenue Share (%), by End-use 2025 & 2033
- Figure 58: Middle East Zeolite Molecular Sieve Industry Volume Share (%), by End-use 2025 & 2033
- Figure 59: Middle East Zeolite Molecular Sieve Industry Revenue (million), by Country 2025 & 2033
- Figure 60: Middle East Zeolite Molecular Sieve Industry Volume (K Tons), by Country 2025 & 2033
- Figure 61: Middle East Zeolite Molecular Sieve Industry Revenue Share (%), by Country 2025 & 2033
- Figure 62: Middle East Zeolite Molecular Sieve Industry Volume Share (%), by Country 2025 & 2033
- Figure 63: Saudi Arabia Zeolite Molecular Sieve Industry Revenue (million), by Raw Material 2025 & 2033
- Figure 64: Saudi Arabia Zeolite Molecular Sieve Industry Volume (K Tons), by Raw Material 2025 & 2033
- Figure 65: Saudi Arabia Zeolite Molecular Sieve Industry Revenue Share (%), by Raw Material 2025 & 2033
- Figure 66: Saudi Arabia Zeolite Molecular Sieve Industry Volume Share (%), by Raw Material 2025 & 2033
- Figure 67: Saudi Arabia Zeolite Molecular Sieve Industry Revenue (million), by End-use 2025 & 2033
- Figure 68: Saudi Arabia Zeolite Molecular Sieve Industry Volume (K Tons), by End-use 2025 & 2033
- Figure 69: Saudi Arabia Zeolite Molecular Sieve Industry Revenue Share (%), by End-use 2025 & 2033
- Figure 70: Saudi Arabia Zeolite Molecular Sieve Industry Volume Share (%), by End-use 2025 & 2033
- Figure 71: Saudi Arabia Zeolite Molecular Sieve Industry Revenue (million), by Country 2025 & 2033
- Figure 72: Saudi Arabia Zeolite Molecular Sieve Industry Volume (K Tons), by Country 2025 & 2033
- Figure 73: Saudi Arabia Zeolite Molecular Sieve Industry Revenue Share (%), by Country 2025 & 2033
- Figure 74: Saudi Arabia Zeolite Molecular Sieve Industry Volume Share (%), by Country 2025 & 2033
List of Tables
- Table 1: Global Zeolite Molecular Sieve Industry Revenue million Forecast, by Raw Material 2020 & 2033
- Table 2: Global Zeolite Molecular Sieve Industry Volume K Tons Forecast, by Raw Material 2020 & 2033
- Table 3: Global Zeolite Molecular Sieve Industry Revenue million Forecast, by End-use 2020 & 2033
- Table 4: Global Zeolite Molecular Sieve Industry Volume K Tons Forecast, by End-use 2020 & 2033
- Table 5: Global Zeolite Molecular Sieve Industry Revenue million Forecast, by Region 2020 & 2033
- Table 6: Global Zeolite Molecular Sieve Industry Volume K Tons Forecast, by Region 2020 & 2033
- Table 7: Global Zeolite Molecular Sieve Industry Revenue million Forecast, by Raw Material 2020 & 2033
- Table 8: Global Zeolite Molecular Sieve Industry Volume K Tons Forecast, by Raw Material 2020 & 2033
- Table 9: Global Zeolite Molecular Sieve Industry Revenue million Forecast, by End-use 2020 & 2033
- Table 10: Global Zeolite Molecular Sieve Industry Volume K Tons Forecast, by End-use 2020 & 2033
- Table 11: Global Zeolite Molecular Sieve Industry Revenue million Forecast, by Country 2020 & 2033
- Table 12: Global Zeolite Molecular Sieve Industry Volume K Tons Forecast, by Country 2020 & 2033
- Table 13: China Zeolite Molecular Sieve Industry Revenue (million) Forecast, by Application 2020 & 2033
- Table 14: China Zeolite Molecular Sieve Industry Volume (K Tons) Forecast, by Application 2020 & 2033
- Table 15: India Zeolite Molecular Sieve Industry Revenue (million) Forecast, by Application 2020 & 2033
- Table 16: India Zeolite Molecular Sieve Industry Volume (K Tons) Forecast, by Application 2020 & 2033
- Table 17: Japan Zeolite Molecular Sieve Industry Revenue (million) Forecast, by Application 2020 & 2033
- Table 18: Japan Zeolite Molecular Sieve Industry Volume (K Tons) Forecast, by Application 2020 & 2033
- Table 19: South Korea Zeolite Molecular Sieve Industry Revenue (million) Forecast, by Application 2020 & 2033
- Table 20: South Korea Zeolite Molecular Sieve Industry Volume (K Tons) Forecast, by Application 2020 & 2033
- Table 21: Rest of Asia Pacific Zeolite Molecular Sieve Industry Revenue (million) Forecast, by Application 2020 & 2033
- Table 22: Rest of Asia Pacific Zeolite Molecular Sieve Industry Volume (K Tons) Forecast, by Application 2020 & 2033
- Table 23: Global Zeolite Molecular Sieve Industry Revenue million Forecast, by Raw Material 2020 & 2033
- Table 24: Global Zeolite Molecular Sieve Industry Volume K Tons Forecast, by Raw Material 2020 & 2033
- Table 25: Global Zeolite Molecular Sieve Industry Revenue million Forecast, by End-use 2020 & 2033
- Table 26: Global Zeolite Molecular Sieve Industry Volume K Tons Forecast, by End-use 2020 & 2033
- Table 27: Global Zeolite Molecular Sieve Industry Revenue million Forecast, by Country 2020 & 2033
- Table 28: Global Zeolite Molecular Sieve Industry Volume K Tons Forecast, by Country 2020 & 2033
- Table 29: United States Zeolite Molecular Sieve Industry Revenue (million) Forecast, by Application 2020 & 2033
- Table 30: United States Zeolite Molecular Sieve Industry Volume (K Tons) Forecast, by Application 2020 & 2033
- Table 31: Canada Zeolite Molecular Sieve Industry Revenue (million) Forecast, by Application 2020 & 2033
- Table 32: Canada Zeolite Molecular Sieve Industry Volume (K Tons) Forecast, by Application 2020 & 2033
- Table 33: Mexico Zeolite Molecular Sieve Industry Revenue (million) Forecast, by Application 2020 & 2033
- Table 34: Mexico Zeolite Molecular Sieve Industry Volume (K Tons) Forecast, by Application 2020 & 2033
- Table 35: Global Zeolite Molecular Sieve Industry Revenue million Forecast, by Raw Material 2020 & 2033
- Table 36: Global Zeolite Molecular Sieve Industry Volume K Tons Forecast, by Raw Material 2020 & 2033
- Table 37: Global Zeolite Molecular Sieve Industry Revenue million Forecast, by End-use 2020 & 2033
- Table 38: Global Zeolite Molecular Sieve Industry Volume K Tons Forecast, by End-use 2020 & 2033
- Table 39: Global Zeolite Molecular Sieve Industry Revenue million Forecast, by Country 2020 & 2033
- Table 40: Global Zeolite Molecular Sieve Industry Volume K Tons Forecast, by Country 2020 & 2033
- Table 41: Germany Zeolite Molecular Sieve Industry Revenue (million) Forecast, by Application 2020 & 2033
- Table 42: Germany Zeolite Molecular Sieve Industry Volume (K Tons) Forecast, by Application 2020 & 2033
- Table 43: United Kingdom Zeolite Molecular Sieve Industry Revenue (million) Forecast, by Application 2020 & 2033
- Table 44: United Kingdom Zeolite Molecular Sieve Industry Volume (K Tons) Forecast, by Application 2020 & 2033
- Table 45: France Zeolite Molecular Sieve Industry Revenue (million) Forecast, by Application 2020 & 2033
- Table 46: France Zeolite Molecular Sieve Industry Volume (K Tons) Forecast, by Application 2020 & 2033
- Table 47: Italy Zeolite Molecular Sieve Industry Revenue (million) Forecast, by Application 2020 & 2033
- Table 48: Italy Zeolite Molecular Sieve Industry Volume (K Tons) Forecast, by Application 2020 & 2033
- Table 49: Rest of Europe Zeolite Molecular Sieve Industry Revenue (million) Forecast, by Application 2020 & 2033
- Table 50: Rest of Europe Zeolite Molecular Sieve Industry Volume (K Tons) Forecast, by Application 2020 & 2033
- Table 51: Global Zeolite Molecular Sieve Industry Revenue million Forecast, by Raw Material 2020 & 2033
- Table 52: Global Zeolite Molecular Sieve Industry Volume K Tons Forecast, by Raw Material 2020 & 2033
- Table 53: Global Zeolite Molecular Sieve Industry Revenue million Forecast, by End-use 2020 & 2033
- Table 54: Global Zeolite Molecular Sieve Industry Volume K Tons Forecast, by End-use 2020 & 2033
- Table 55: Global Zeolite Molecular Sieve Industry Revenue million Forecast, by Country 2020 & 2033
- Table 56: Global Zeolite Molecular Sieve Industry Volume K Tons Forecast, by Country 2020 & 2033
- Table 57: Brazil Zeolite Molecular Sieve Industry Revenue (million) Forecast, by Application 2020 & 2033
- Table 58: Brazil Zeolite Molecular Sieve Industry Volume (K Tons) Forecast, by Application 2020 & 2033
- Table 59: Argentina Zeolite Molecular Sieve Industry Revenue (million) Forecast, by Application 2020 & 2033
- Table 60: Argentina Zeolite Molecular Sieve Industry Volume (K Tons) Forecast, by Application 2020 & 2033
- Table 61: Rest of South America Zeolite Molecular Sieve Industry Revenue (million) Forecast, by Application 2020 & 2033
- Table 62: Rest of South America Zeolite Molecular Sieve Industry Volume (K Tons) Forecast, by Application 2020 & 2033
- Table 63: Global Zeolite Molecular Sieve Industry Revenue million Forecast, by Raw Material 2020 & 2033
- Table 64: Global Zeolite Molecular Sieve Industry Volume K Tons Forecast, by Raw Material 2020 & 2033
- Table 65: Global Zeolite Molecular Sieve Industry Revenue million Forecast, by End-use 2020 & 2033
- Table 66: Global Zeolite Molecular Sieve Industry Volume K Tons Forecast, by End-use 2020 & 2033
- Table 67: Global Zeolite Molecular Sieve Industry Revenue million Forecast, by Country 2020 & 2033
- Table 68: Global Zeolite Molecular Sieve Industry Volume K Tons Forecast, by Country 2020 & 2033
- Table 69: Global Zeolite Molecular Sieve Industry Revenue million Forecast, by Raw Material 2020 & 2033
- Table 70: Global Zeolite Molecular Sieve Industry Volume K Tons Forecast, by Raw Material 2020 & 2033
- Table 71: Global Zeolite Molecular Sieve Industry Revenue million Forecast, by End-use 2020 & 2033
- Table 72: Global Zeolite Molecular Sieve Industry Volume K Tons Forecast, by End-use 2020 & 2033
- Table 73: Global Zeolite Molecular Sieve Industry Revenue million Forecast, by Country 2020 & 2033
- Table 74: Global Zeolite Molecular Sieve Industry Volume K Tons Forecast, by Country 2020 & 2033
- Table 75: South Africa Zeolite Molecular Sieve Industry Revenue (million) Forecast, by Application 2020 & 2033
- Table 76: South Africa Zeolite Molecular Sieve Industry Volume (K Tons) Forecast, by Application 2020 & 2033
- Table 77: Rest of Middle East Zeolite Molecular Sieve Industry Revenue (million) Forecast, by Application 2020 & 2033
- Table 78: Rest of Middle East Zeolite Molecular Sieve Industry Volume (K Tons) Forecast, by Application 2020 & 2033
Frequently Asked Questions
1. What is the projected Compound Annual Growth Rate (CAGR) of the Zeolite Molecular Sieve Industry?
The projected CAGR is approximately 3.9%.
2. Which companies are prominent players in the Zeolite Molecular Sieve Industry?
Key companies in the market include Jiuzhou Chemicals, Axens, Kuraray Co Ltd, CWK Chemiewerk Bad Kostritz GmbH, Zeochem AG, Sorbead India, Tosoh Corp, KNT Group, BASF SE, Arkema Group, Zeolyst, Hengye Group, W R Grace, Clariant AG.
3. What are the main segments of the Zeolite Molecular Sieve Industry?
The market segments include Raw Material, End-use.
4. Can you provide details about the market size?
The market size is estimated to be USD 1729 million as of 2022.
5. What are some drivers contributing to market growth?
; Rising Awareness for Treatment of Hazardous Organic Materials in Wastewater; High Demand from the Detergent Market.
6. What are the notable trends driving market growth?
Detergent Segment to Dominate the Market Demand.
7. Are there any restraints impacting market growth?
; Threat from Chemical Composites. Enzymes. and Other Substitutes.
8. Can you provide examples of recent developments in the market?
N/A
9. What pricing options are available for accessing the report?
Pricing options include single-user, multi-user, and enterprise licenses priced at USD 4750, USD 5250, and USD 8750 respectively.
10. Is the market size provided in terms of value or volume?
The market size is provided in terms of value, measured in million and volume, measured in K Tons.
11. Are there any specific market keywords associated with the report?
Yes, the market keyword associated with the report is "Zeolite Molecular Sieve Industry," which aids in identifying and referencing the specific market segment covered.
12. How do I determine which pricing option suits my needs best?
The pricing options vary based on user requirements and access needs. Individual users may opt for single-user licenses, while businesses requiring broader access may choose multi-user or enterprise licenses for cost-effective access to the report.
13. Are there any additional resources or data provided in the Zeolite Molecular Sieve Industry report?
While the report offers comprehensive insights, it's advisable to review the specific contents or supplementary materials provided to ascertain if additional resources or data are available.
14. How can I stay updated on further developments or reports in the Zeolite Molecular Sieve Industry?
To stay informed about further developments, trends, and reports in the Zeolite Molecular Sieve Industry, consider subscribing to industry newsletters, following relevant companies and organizations, or regularly checking reputable industry news sources and publications.
Methodology
Step 1 - Identification of Relevant Samples Size from Population Database


Step 2 - Approaches for Defining Global Market Size (Value, Volume* & Price*)

Note*: In applicable scenarios
Step 3 - Data Sources
Primary Research
- Web Analytics
- Survey Reports
- Research Institute
- Latest Research Reports
- Opinion Leaders
Secondary Research
- Annual Reports
- White Paper
- Latest Press Release
- Industry Association
- Paid Database
- Investor Presentations

Step 4 - Data Triangulation
Involves using different sources of information in order to increase the validity of a study
These sources are likely to be stakeholders in a program - participants, other researchers, program staff, other community members, and so on.
Then we put all data in single framework & apply various statistical tools to find out the dynamic on the market.
During the analysis stage, feedback from the stakeholder groups would be compared to determine areas of agreement as well as areas of divergence