

Key Insights
The global Zinc Oxide market, valued at $2.36 billion in 2025, is poised for significant expansion with a projected Compound Annual Growth Rate (CAGR) of 3.81% from 2025 to 2033. This growth is propelled by increasing demand from key industries. The burgeoning rubber and tire sector, a major consumer utilizing zinc oxide for reinforcement and vulcanization activation, is a primary driver. The ceramics and glass industries also contribute, leveraging zinc oxide for enhanced durability and optical properties. Furthermore, the pharmaceutical and cosmetic sectors drive demand due to zinc oxide's UV-blocking and antimicrobial benefits. Applications in paints, coatings, agriculture as a micronutrient, and other chemical and food industries further support market expansion. Potential challenges may include zinc price volatility, production-related environmental regulations, and competition from substitute materials. The market is segmented by production process (indirect, direct, wet) and application, offering diverse opportunities. Asia-Pacific, particularly China and India, leads growth due to expanding manufacturing, while North America and Europe maintain consistent demand.
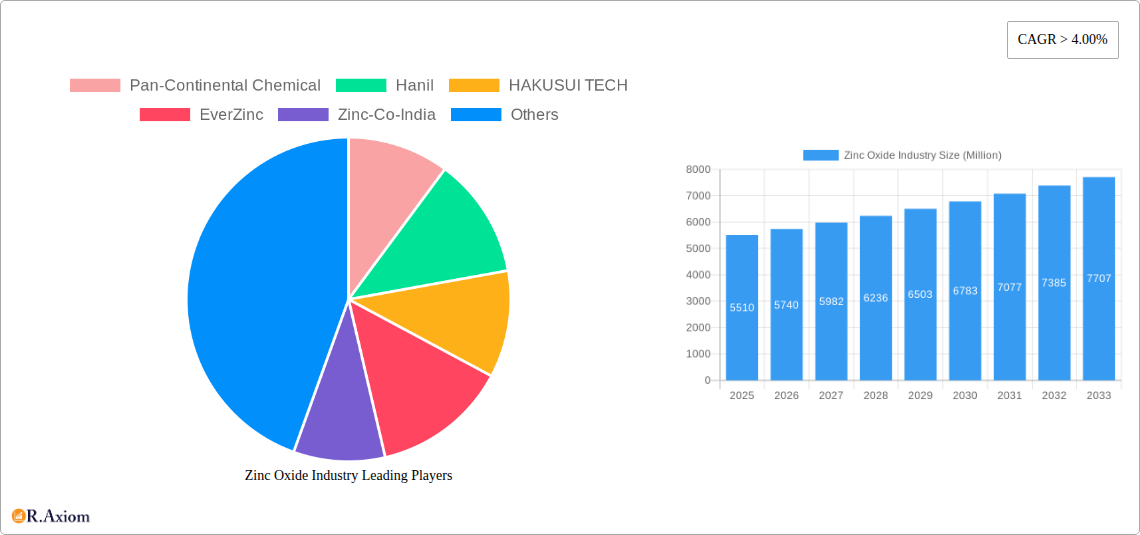
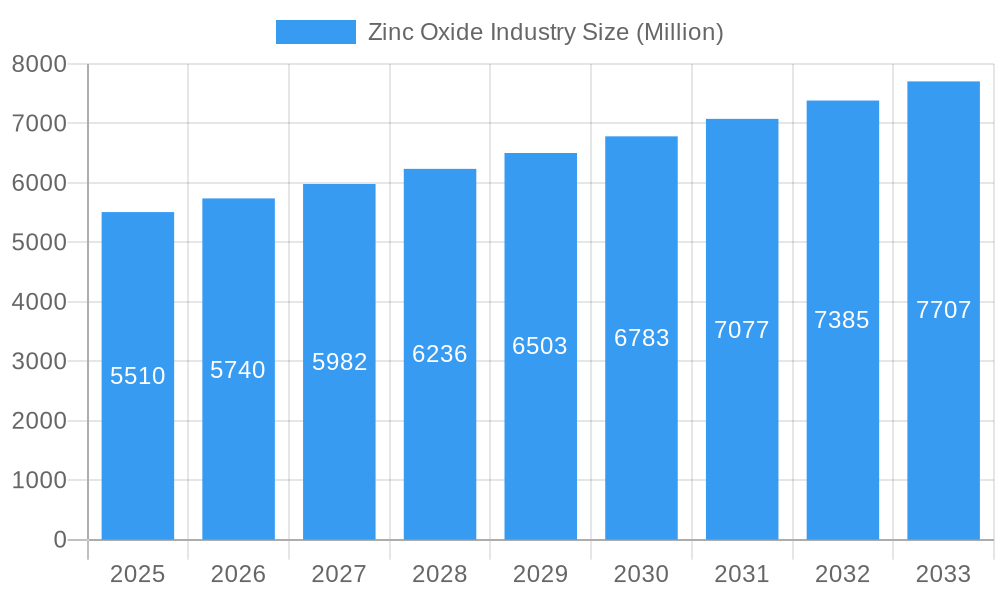
Zinc Oxide Industry Market Size (In Million)
The competitive arena features established global corporations and regional manufacturers. Future growth hinges on production innovations, new application development, and strategic supply chain collaborations. Sustained demand across core sectors and continuous innovation indicate strong long-term market potential. The robust CAGR highlights the market's resilience and capacity for substantial growth. Further research can pinpoint specific opportunities within niche segments and geographies.
Zinc Oxide Industry Company Market Share
Zinc Oxide Industry: A Comprehensive Market Report (2019-2033)
This in-depth report provides a comprehensive analysis of the global zinc oxide industry, covering market size, segmentation, key players, growth drivers, challenges, and future opportunities. The study period spans from 2019 to 2033, with 2025 serving as both the base and estimated year. The report leverages extensive data and insights to offer actionable intelligence for industry stakeholders, investors, and businesses seeking to navigate this dynamic market.
Zinc Oxide Industry Market Concentration & Innovation
The global zinc oxide market exhibits a moderately concentrated structure, with several large players holding significant market share. While precise market share figures for each company are proprietary, it's evident that companies like EverZinc (post-merger with U.S. Zinc), Hindustan Zinc Limited, and Zochem Inc. command substantial portions of the market. Smaller players such as Pan-Continental Chemical, Hanil, HAKUSUI TECH, Zinc-Co-India, Rubamin, Weifang Longda Zinc Industry Co Ltd, Suraj Udyog, Zinc Nacional SA, Silox SA, Akrochem Corporation, and ZM SILESIA SA contribute to the overall market dynamism. Innovation in the industry is driven by the demand for higher-quality zinc oxide with specific properties tailored to different applications. This leads to continuous research and development in production processes (e.g., improvements in the French and American processes, development of advanced wet processes) and new product formulations. Regulatory frameworks concerning environmental compliance and worker safety significantly influence production methods and operational costs. The market also sees substitution pressures from alternative materials in certain applications. Recent M&A activity, highlighted by the EverZinc and U.S. Zinc merger in June 2022 (valued at xx Million), demonstrates a trend toward consolidation and increased vertical integration within the industry. The deal value alone showcases the significant financial stake in the market's future. Furthermore, end-user trends, such as the growing demand for zinc oxide in the rubber and tire, and pharmaceutical sectors, are shaping product development and market expansion.
Zinc Oxide Industry Industry Trends & Insights
The global zinc oxide market is projected to experience substantial growth, with a Compound Annual Growth Rate (CAGR) of xx% during the forecast period (2025-2033). This growth is propelled by several factors. Rising demand from key application sectors like rubber and tires (driven by the automotive industry's growth), paints and coatings (fueled by infrastructure development and construction activities), and pharmaceuticals and cosmetics (driven by increasing consumer spending and the rising popularity of natural and organic products) are key growth catalysts. Technological disruptions, particularly advancements in production processes and the development of high-purity zinc oxide, are enabling manufacturers to produce superior products catering to the niche requirements of end-users. Consumer preferences increasingly lean toward products with environmentally friendly characteristics, pushing for the development of sustainable and eco-friendly zinc oxide production methods. The competitive landscape is marked by both intense competition among established players and the emergence of new entrants. Market penetration for zinc oxide varies across regions, with developed economies exhibiting higher levels of adoption than developing economies due to differing consumer purchasing power and industrial sophistication. Prices fluctuate based on raw material availability (zinc metal) and global economic conditions.
Dominant Markets & Segments in Zinc Oxide Industry
Leading Region/Country: The xx region is currently the dominant market for zinc oxide, driven by robust industrial growth and significant demand from key application sectors, particularly xx. Strong economic policies, favourable government regulations and supportive infrastructure have fueled this expansion. China, historically a key player, continues to exert influence.
Dominant Process: The indirect process (French process) currently holds a larger market share compared to the direct (American) and wet processes due to its established infrastructure and cost-effectiveness. However, the wet process is gaining traction due to its potential for producing high-purity zinc oxide.
Dominant Application: The rubber and tire industry constitutes the largest application segment for zinc oxide, followed closely by paints and coatings. The consistent growth in the automotive sector directly correlates with increasing demand in these applications. The pharmaceuticals and cosmetics sector represents a high-growth segment characterized by high-value products and high margins. The Agriculture sector's usage, though comparatively smaller, is expected to experience consistent growth.
The dominance analysis reveals a complex interplay of technological capabilities, economic factors, and regional disparities. Mature markets are characterized by established players and high competition, while emerging markets offer opportunities for expansion and growth, but potentially present hurdles like infrastructural limitations and regulatory complexities.
Zinc Oxide Industry Product Developments
Recent innovations in zinc oxide production focus on enhancing purity, particle size control, and surface modification to improve performance in specific applications. These advancements enable producers to offer customized zinc oxide products with superior properties, catering to the diverse needs of different industries. For instance, nano-sized zinc oxide particles are gaining popularity due to their enhanced properties, especially in sunscreens and other cosmetic applications. This product innovation underscores the industry's commitment to adapting to specific market needs and leveraging technological advancements.
Report Scope & Segmentation Analysis
This report segments the zinc oxide market based on the manufacturing process (Indirect/French Process, Direct/American Process, Wet Process) and application (Rubber and Tires, Ceramics and Glass, Pharmaceuticals and Cosmetics, Agriculture, Paints and Coatings, Other Applications). Each segment is analyzed based on historical data (2019-2024), current market size (2025), and future growth projections (2025-2033). Competitive dynamics within each segment are assessed, identifying key players and their market strategies. Growth projections vary across segments, reflecting the distinct growth drivers and challenges specific to each application and production methodology. Market sizes are detailed for each segment, offering insights into their relative contribution to the overall market.
Key Drivers of Zinc Oxide Industry Growth
Several key factors fuel the zinc oxide industry's growth. Firstly, the robust growth of the construction industry globally, demanding large volumes of zinc oxide for paints and coatings, is a significant driver. Secondly, the expanding automotive sector, requiring zinc oxide in rubber and tire manufacturing, contributes significantly. Thirdly, growing demand from the pharmaceuticals and cosmetics industries, driven by their preference for the material's properties in various formulations, adds further momentum. Finally, technological advancements in production methods enhancing efficiency and quality boost the overall market growth.
Challenges in the Zinc Oxide Industry Sector
The zinc oxide industry faces challenges including fluctuations in zinc metal prices, a key raw material, impacting production costs. Supply chain disruptions, particularly concerning the availability of raw materials and logistics, can lead to production delays and increased costs. Intense competition among established players also pressures profit margins. Stringent environmental regulations demand significant investments in pollution control technologies, adding to operational expenses.
Emerging Opportunities in Zinc Oxide Industry
The growing demand for zinc oxide in niche applications like advanced electronics and energy storage presents significant emerging opportunities. The development of sustainable and eco-friendly production methods enhances the industry’s appeal and expands the addressable market. Furthermore, increasing awareness regarding the material’s antimicrobial properties boosts its adoption in consumer goods, such as textiles and healthcare products.
Leading Players in the Zinc Oxide Industry Market
- Pan-Continental Chemical
- Hanil
- HAKUSUI TECH
- EverZinc
- Zinc-Co-India
- Rubamin
- Weifang Longda Zinc Industry Co Ltd
- Suraj Udyog
- Hindustan Zinc Limited
- Zochem Inc
- Zinc Nacional SA
- Silox SA
- Akrochem Corporation
- ZM SILESIA SA
Key Developments in Zinc Oxide Industry Industry
- June 2022: Aterian Investment Partners merged U.S. Zinc and EverZinc, creating the world's leading zinc chemistry company, significantly altering market dynamics and consolidating production capabilities.
- February 2022: Zochem Inc. expanded its zinc oxide production capacity by 15,000 metric tons, increasing its market share and production capabilities.
Strategic Outlook for Zinc Oxide Industry Market
The zinc oxide market presents promising growth prospects, driven by continued expansion in key application sectors, technological advancements in production, and exploration of new applications. Strategic initiatives focusing on innovation, sustainability, and efficient supply chains are crucial for achieving sustainable growth and maintaining a competitive edge. Market expansion in developing economies holds further potential.
Zinc Oxide Industry Segmentation
-
1. Process
- 1.1. Indirect Process (French Process)
- 1.2. Direct Process (American Process)
- 1.3. Wet Process
-
2. Application
- 2.1. Rubber and Tires
- 2.2. Ceramics and Glass
- 2.3. Pharmaceuticals and Cosmetics
- 2.4. Agriculture
- 2.5. Paints and Coatings
- 2.6. Other Applications (Chemicals and Food)
Zinc Oxide Industry Segmentation By Geography
-
1. Asia Pacific
- 1.1. China
- 1.2. India
- 1.3. Japan
- 1.4. South Korea
- 1.5. Rest of Asia Pacific
-
2. North America
- 2.1. United States
- 2.2. Canada
- 2.3. Mexico
-
3. Europe
- 3.1. Germany
- 3.2. United Kingdom
- 3.3. France
- 3.4. Italy
- 3.5. Rest of Europe
-
4. South America
- 4.1. Brazil
- 4.2. Argentina
- 4.3. Rest of South America
-
5. Middle East and Africa
- 5.1. Saudi Arabia
- 5.2. South Africa
- 5.3. Rest of Middle East and Africa
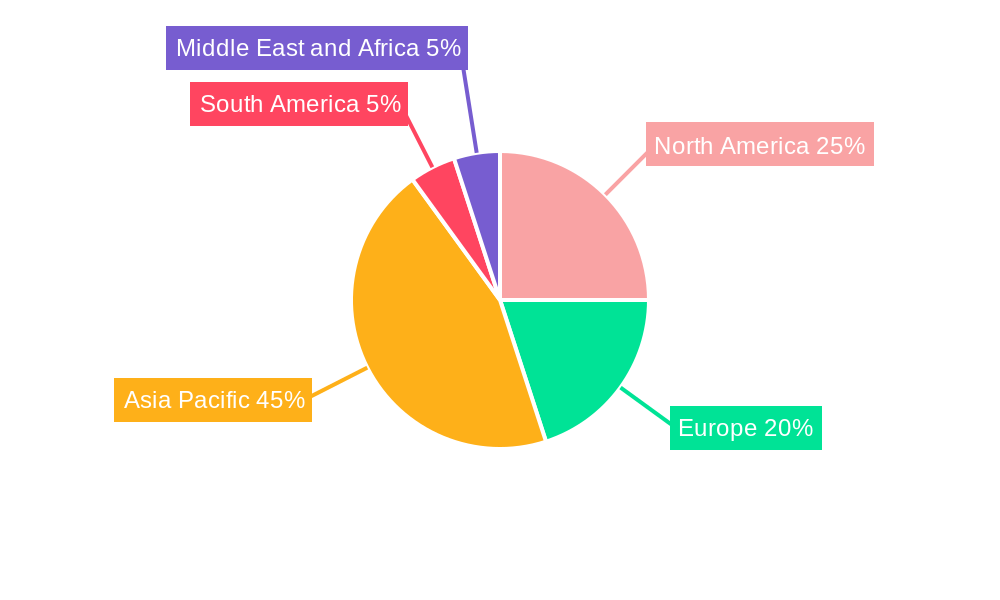
Zinc Oxide Industry Regional Market Share
Geographic Coverage of Zinc Oxide Industry
Zinc Oxide Industry REPORT HIGHLIGHTS
| Aspects | Details |
|---|---|
| Study Period | 2020-2034 |
| Base Year | 2025 |
| Estimated Year | 2026 |
| Forecast Period | 2026-2034 |
| Historical Period | 2020-2025 |
| Growth Rate | CAGR of 3.81% from 2020-2034 |
| Segmentation |
|
Table of Contents
- 1. Introduction
- 1.1. Research Scope
- 1.2. Market Segmentation
- 1.3. Research Objective
- 1.4. Definitions and Assumptions
- 2. Executive Summary
- 2.1. Market Snapshot
- 3. Market Dynamics
- 3.1. Market Drivers
- 3.2. Market Restrains
- 3.3. Market Trends
- 3.4. Market Opportunities
- 4. Market Factor Analysis
- 4.1. Porters Five Forces
- 4.1.1. Bargaining Power of Suppliers
- 4.1.2. Bargaining Power of Buyers
- 4.1.3. Threat of New Entrants
- 4.1.4. Threat of Substitutes
- 4.1.5. Competitive Rivalry
- 4.2. PESTEL analysis
- 4.3. BCG Analysis
- 4.3.1. Stars (High Growth, High Market Share)
- 4.3.2. Cash Cows (Low Growth, High Market Share)
- 4.3.3. Question Mark (High Growth, Low Market Share)
- 4.3.4. Dogs (Low Growth, Low Market Share)
- 4.4. Ansoff Matrix Analysis
- 4.5. Supply Chain Analysis
- 4.6. Regulatory Landscape
- 4.7. Current Market Potential and Opportunity Assessment (TAM–SAM–SOM Framework)
- 4.8. RAX Analyst Note
- 4.1. Porters Five Forces
- 5. Market Analysis, Insights and Forecast 2021-2033
- 5.1. Market Analysis, Insights and Forecast - by Process
- 5.1.1. Indirect Process (French Process)
- 5.1.2. Direct Process (American Process)
- 5.1.3. Wet Process
- 5.2. Market Analysis, Insights and Forecast - by Application
- 5.2.1. Rubber and Tires
- 5.2.2. Ceramics and Glass
- 5.2.3. Pharmaceuticals and Cosmetics
- 5.2.4. Agriculture
- 5.2.5. Paints and Coatings
- 5.2.6. Other Applications (Chemicals and Food)
- 5.3. Market Analysis, Insights and Forecast - by Region
- 5.3.1. Asia Pacific
- 5.3.2. North America
- 5.3.3. Europe
- 5.3.4. South America
- 5.3.5. Middle East and Africa
- 5.1. Market Analysis, Insights and Forecast - by Process
- 6. Global Zinc Oxide Industry Analysis, Insights and Forecast, 2021-2033
- 6.1. Market Analysis, Insights and Forecast - by Process
- 6.1.1. Indirect Process (French Process)
- 6.1.2. Direct Process (American Process)
- 6.1.3. Wet Process
- 6.2. Market Analysis, Insights and Forecast - by Application
- 6.2.1. Rubber and Tires
- 6.2.2. Ceramics and Glass
- 6.2.3. Pharmaceuticals and Cosmetics
- 6.2.4. Agriculture
- 6.2.5. Paints and Coatings
- 6.2.6. Other Applications (Chemicals and Food)
- 6.1. Market Analysis, Insights and Forecast - by Process
- 7. Asia Pacific Zinc Oxide Industry Analysis, Insights and Forecast, 2020-2032
- 7.1. Market Analysis, Insights and Forecast - by Process
- 7.1.1. Indirect Process (French Process)
- 7.1.2. Direct Process (American Process)
- 7.1.3. Wet Process
- 7.2. Market Analysis, Insights and Forecast - by Application
- 7.2.1. Rubber and Tires
- 7.2.2. Ceramics and Glass
- 7.2.3. Pharmaceuticals and Cosmetics
- 7.2.4. Agriculture
- 7.2.5. Paints and Coatings
- 7.2.6. Other Applications (Chemicals and Food)
- 7.1. Market Analysis, Insights and Forecast - by Process
- 8. North America Zinc Oxide Industry Analysis, Insights and Forecast, 2020-2032
- 8.1. Market Analysis, Insights and Forecast - by Process
- 8.1.1. Indirect Process (French Process)
- 8.1.2. Direct Process (American Process)
- 8.1.3. Wet Process
- 8.2. Market Analysis, Insights and Forecast - by Application
- 8.2.1. Rubber and Tires
- 8.2.2. Ceramics and Glass
- 8.2.3. Pharmaceuticals and Cosmetics
- 8.2.4. Agriculture
- 8.2.5. Paints and Coatings
- 8.2.6. Other Applications (Chemicals and Food)
- 8.1. Market Analysis, Insights and Forecast - by Process
- 9. Europe Zinc Oxide Industry Analysis, Insights and Forecast, 2020-2032
- 9.1. Market Analysis, Insights and Forecast - by Process
- 9.1.1. Indirect Process (French Process)
- 9.1.2. Direct Process (American Process)
- 9.1.3. Wet Process
- 9.2. Market Analysis, Insights and Forecast - by Application
- 9.2.1. Rubber and Tires
- 9.2.2. Ceramics and Glass
- 9.2.3. Pharmaceuticals and Cosmetics
- 9.2.4. Agriculture
- 9.2.5. Paints and Coatings
- 9.2.6. Other Applications (Chemicals and Food)
- 9.1. Market Analysis, Insights and Forecast - by Process
- 10. South America Zinc Oxide Industry Analysis, Insights and Forecast, 2020-2032
- 10.1. Market Analysis, Insights and Forecast - by Process
- 10.1.1. Indirect Process (French Process)
- 10.1.2. Direct Process (American Process)
- 10.1.3. Wet Process
- 10.2. Market Analysis, Insights and Forecast - by Application
- 10.2.1. Rubber and Tires
- 10.2.2. Ceramics and Glass
- 10.2.3. Pharmaceuticals and Cosmetics
- 10.2.4. Agriculture
- 10.2.5. Paints and Coatings
- 10.2.6. Other Applications (Chemicals and Food)
- 10.1. Market Analysis, Insights and Forecast - by Process
- 11. Middle East and Africa Zinc Oxide Industry Analysis, Insights and Forecast, 2020-2032
- 11.1. Market Analysis, Insights and Forecast - by Process
- 11.1.1. Indirect Process (French Process)
- 11.1.2. Direct Process (American Process)
- 11.1.3. Wet Process
- 11.2. Market Analysis, Insights and Forecast - by Application
- 11.2.1. Rubber and Tires
- 11.2.2. Ceramics and Glass
- 11.2.3. Pharmaceuticals and Cosmetics
- 11.2.4. Agriculture
- 11.2.5. Paints and Coatings
- 11.2.6. Other Applications (Chemicals and Food)
- 11.1. Market Analysis, Insights and Forecast - by Process
- 12. Competitive Analysis
- 12.1. Company Profiles
- 12.1.1 Pan-Continental Chemical
- 12.1.1.1. Company Overview
- 12.1.1.2. Products
- 12.1.1.3. Company Financials
- 12.1.1.4. SWOT Analysis
- 12.1.2 Hanil
- 12.1.2.1. Company Overview
- 12.1.2.2. Products
- 12.1.2.3. Company Financials
- 12.1.2.4. SWOT Analysis
- 12.1.3 HAKUSUI TECH
- 12.1.3.1. Company Overview
- 12.1.3.2. Products
- 12.1.3.3. Company Financials
- 12.1.3.4. SWOT Analysis
- 12.1.4 EverZinc
- 12.1.4.1. Company Overview
- 12.1.4.2. Products
- 12.1.4.3. Company Financials
- 12.1.4.4. SWOT Analysis
- 12.1.5 Zinc-Co-India
- 12.1.5.1. Company Overview
- 12.1.5.2. Products
- 12.1.5.3. Company Financials
- 12.1.5.4. SWOT Analysis
- 12.1.6 Rubamin
- 12.1.6.1. Company Overview
- 12.1.6.2. Products
- 12.1.6.3. Company Financials
- 12.1.6.4. SWOT Analysis
- 12.1.7 Weifang Longda Zinc Industry Co Ltd
- 12.1.7.1. Company Overview
- 12.1.7.2. Products
- 12.1.7.3. Company Financials
- 12.1.7.4. SWOT Analysis
- 12.1.8 Suraj Udyog
- 12.1.8.1. Company Overview
- 12.1.8.2. Products
- 12.1.8.3. Company Financials
- 12.1.8.4. SWOT Analysis
- 12.1.9 Hindustan Zinc Limited
- 12.1.9.1. Company Overview
- 12.1.9.2. Products
- 12.1.9.3. Company Financials
- 12.1.9.4. SWOT Analysis
- 12.1.10 Zochem Inc *List Not Exhaustive
- 12.1.10.1. Company Overview
- 12.1.10.2. Products
- 12.1.10.3. Company Financials
- 12.1.10.4. SWOT Analysis
- 12.1.11 Zinc Nacional SA
- 12.1.11.1. Company Overview
- 12.1.11.2. Products
- 12.1.11.3. Company Financials
- 12.1.11.4. SWOT Analysis
- 12.1.12 Silox SA
- 12.1.12.1. Company Overview
- 12.1.12.2. Products
- 12.1.12.3. Company Financials
- 12.1.12.4. SWOT Analysis
- 12.1.13 Akrochem Corporation
- 12.1.13.1. Company Overview
- 12.1.13.2. Products
- 12.1.13.3. Company Financials
- 12.1.13.4. SWOT Analysis
- 12.1.14 ZM SILESIA SA
- 12.1.14.1. Company Overview
- 12.1.14.2. Products
- 12.1.14.3. Company Financials
- 12.1.14.4. SWOT Analysis
- 12.1.1 Pan-Continental Chemical
- 12.2. Market Entropy
- 12.2.1 Company's Key Areas Served
- 12.2.2 Recent Developments
- 12.3. Company Market Share Analysis 2025
- 12.3.1 Top 5 Companies Market Share Analysis
- 12.3.2 Top 3 Companies Market Share Analysis
- 12.4. List of Potential Customers
- 13. Research Methodology
List of Figures
- Figure 1: Global Zinc Oxide Industry Revenue Breakdown (million, %) by Region 2025 & 2033
- Figure 2: Global Zinc Oxide Industry Volume Breakdown (K Tons, %) by Region 2025 & 2033
- Figure 3: Asia Pacific Zinc Oxide Industry Revenue (million), by Process 2025 & 2033
- Figure 4: Asia Pacific Zinc Oxide Industry Volume (K Tons), by Process 2025 & 2033
- Figure 5: Asia Pacific Zinc Oxide Industry Revenue Share (%), by Process 2025 & 2033
- Figure 6: Asia Pacific Zinc Oxide Industry Volume Share (%), by Process 2025 & 2033
- Figure 7: Asia Pacific Zinc Oxide Industry Revenue (million), by Application 2025 & 2033
- Figure 8: Asia Pacific Zinc Oxide Industry Volume (K Tons), by Application 2025 & 2033
- Figure 9: Asia Pacific Zinc Oxide Industry Revenue Share (%), by Application 2025 & 2033
- Figure 10: Asia Pacific Zinc Oxide Industry Volume Share (%), by Application 2025 & 2033
- Figure 11: Asia Pacific Zinc Oxide Industry Revenue (million), by Country 2025 & 2033
- Figure 12: Asia Pacific Zinc Oxide Industry Volume (K Tons), by Country 2025 & 2033
- Figure 13: Asia Pacific Zinc Oxide Industry Revenue Share (%), by Country 2025 & 2033
- Figure 14: Asia Pacific Zinc Oxide Industry Volume Share (%), by Country 2025 & 2033
- Figure 15: North America Zinc Oxide Industry Revenue (million), by Process 2025 & 2033
- Figure 16: North America Zinc Oxide Industry Volume (K Tons), by Process 2025 & 2033
- Figure 17: North America Zinc Oxide Industry Revenue Share (%), by Process 2025 & 2033
- Figure 18: North America Zinc Oxide Industry Volume Share (%), by Process 2025 & 2033
- Figure 19: North America Zinc Oxide Industry Revenue (million), by Application 2025 & 2033
- Figure 20: North America Zinc Oxide Industry Volume (K Tons), by Application 2025 & 2033
- Figure 21: North America Zinc Oxide Industry Revenue Share (%), by Application 2025 & 2033
- Figure 22: North America Zinc Oxide Industry Volume Share (%), by Application 2025 & 2033
- Figure 23: North America Zinc Oxide Industry Revenue (million), by Country 2025 & 2033
- Figure 24: North America Zinc Oxide Industry Volume (K Tons), by Country 2025 & 2033
- Figure 25: North America Zinc Oxide Industry Revenue Share (%), by Country 2025 & 2033
- Figure 26: North America Zinc Oxide Industry Volume Share (%), by Country 2025 & 2033
- Figure 27: Europe Zinc Oxide Industry Revenue (million), by Process 2025 & 2033
- Figure 28: Europe Zinc Oxide Industry Volume (K Tons), by Process 2025 & 2033
- Figure 29: Europe Zinc Oxide Industry Revenue Share (%), by Process 2025 & 2033
- Figure 30: Europe Zinc Oxide Industry Volume Share (%), by Process 2025 & 2033
- Figure 31: Europe Zinc Oxide Industry Revenue (million), by Application 2025 & 2033
- Figure 32: Europe Zinc Oxide Industry Volume (K Tons), by Application 2025 & 2033
- Figure 33: Europe Zinc Oxide Industry Revenue Share (%), by Application 2025 & 2033
- Figure 34: Europe Zinc Oxide Industry Volume Share (%), by Application 2025 & 2033
- Figure 35: Europe Zinc Oxide Industry Revenue (million), by Country 2025 & 2033
- Figure 36: Europe Zinc Oxide Industry Volume (K Tons), by Country 2025 & 2033
- Figure 37: Europe Zinc Oxide Industry Revenue Share (%), by Country 2025 & 2033
- Figure 38: Europe Zinc Oxide Industry Volume Share (%), by Country 2025 & 2033
- Figure 39: South America Zinc Oxide Industry Revenue (million), by Process 2025 & 2033
- Figure 40: South America Zinc Oxide Industry Volume (K Tons), by Process 2025 & 2033
- Figure 41: South America Zinc Oxide Industry Revenue Share (%), by Process 2025 & 2033
- Figure 42: South America Zinc Oxide Industry Volume Share (%), by Process 2025 & 2033
- Figure 43: South America Zinc Oxide Industry Revenue (million), by Application 2025 & 2033
- Figure 44: South America Zinc Oxide Industry Volume (K Tons), by Application 2025 & 2033
- Figure 45: South America Zinc Oxide Industry Revenue Share (%), by Application 2025 & 2033
- Figure 46: South America Zinc Oxide Industry Volume Share (%), by Application 2025 & 2033
- Figure 47: South America Zinc Oxide Industry Revenue (million), by Country 2025 & 2033
- Figure 48: South America Zinc Oxide Industry Volume (K Tons), by Country 2025 & 2033
- Figure 49: South America Zinc Oxide Industry Revenue Share (%), by Country 2025 & 2033
- Figure 50: South America Zinc Oxide Industry Volume Share (%), by Country 2025 & 2033
- Figure 51: Middle East and Africa Zinc Oxide Industry Revenue (million), by Process 2025 & 2033
- Figure 52: Middle East and Africa Zinc Oxide Industry Volume (K Tons), by Process 2025 & 2033
- Figure 53: Middle East and Africa Zinc Oxide Industry Revenue Share (%), by Process 2025 & 2033
- Figure 54: Middle East and Africa Zinc Oxide Industry Volume Share (%), by Process 2025 & 2033
- Figure 55: Middle East and Africa Zinc Oxide Industry Revenue (million), by Application 2025 & 2033
- Figure 56: Middle East and Africa Zinc Oxide Industry Volume (K Tons), by Application 2025 & 2033
- Figure 57: Middle East and Africa Zinc Oxide Industry Revenue Share (%), by Application 2025 & 2033
- Figure 58: Middle East and Africa Zinc Oxide Industry Volume Share (%), by Application 2025 & 2033
- Figure 59: Middle East and Africa Zinc Oxide Industry Revenue (million), by Country 2025 & 2033
- Figure 60: Middle East and Africa Zinc Oxide Industry Volume (K Tons), by Country 2025 & 2033
- Figure 61: Middle East and Africa Zinc Oxide Industry Revenue Share (%), by Country 2025 & 2033
- Figure 62: Middle East and Africa Zinc Oxide Industry Volume Share (%), by Country 2025 & 2033
List of Tables
- Table 1: Global Zinc Oxide Industry Revenue million Forecast, by Process 2020 & 2033
- Table 2: Global Zinc Oxide Industry Volume K Tons Forecast, by Process 2020 & 2033
- Table 3: Global Zinc Oxide Industry Revenue million Forecast, by Application 2020 & 2033
- Table 4: Global Zinc Oxide Industry Volume K Tons Forecast, by Application 2020 & 2033
- Table 5: Global Zinc Oxide Industry Revenue million Forecast, by Region 2020 & 2033
- Table 6: Global Zinc Oxide Industry Volume K Tons Forecast, by Region 2020 & 2033
- Table 7: Global Zinc Oxide Industry Revenue million Forecast, by Process 2020 & 2033
- Table 8: Global Zinc Oxide Industry Volume K Tons Forecast, by Process 2020 & 2033
- Table 9: Global Zinc Oxide Industry Revenue million Forecast, by Application 2020 & 2033
- Table 10: Global Zinc Oxide Industry Volume K Tons Forecast, by Application 2020 & 2033
- Table 11: Global Zinc Oxide Industry Revenue million Forecast, by Country 2020 & 2033
- Table 12: Global Zinc Oxide Industry Volume K Tons Forecast, by Country 2020 & 2033
- Table 13: China Zinc Oxide Industry Revenue (million) Forecast, by Application 2020 & 2033
- Table 14: China Zinc Oxide Industry Volume (K Tons) Forecast, by Application 2020 & 2033
- Table 15: India Zinc Oxide Industry Revenue (million) Forecast, by Application 2020 & 2033
- Table 16: India Zinc Oxide Industry Volume (K Tons) Forecast, by Application 2020 & 2033
- Table 17: Japan Zinc Oxide Industry Revenue (million) Forecast, by Application 2020 & 2033
- Table 18: Japan Zinc Oxide Industry Volume (K Tons) Forecast, by Application 2020 & 2033
- Table 19: South Korea Zinc Oxide Industry Revenue (million) Forecast, by Application 2020 & 2033
- Table 20: South Korea Zinc Oxide Industry Volume (K Tons) Forecast, by Application 2020 & 2033
- Table 21: Rest of Asia Pacific Zinc Oxide Industry Revenue (million) Forecast, by Application 2020 & 2033
- Table 22: Rest of Asia Pacific Zinc Oxide Industry Volume (K Tons) Forecast, by Application 2020 & 2033
- Table 23: Global Zinc Oxide Industry Revenue million Forecast, by Process 2020 & 2033
- Table 24: Global Zinc Oxide Industry Volume K Tons Forecast, by Process 2020 & 2033
- Table 25: Global Zinc Oxide Industry Revenue million Forecast, by Application 2020 & 2033
- Table 26: Global Zinc Oxide Industry Volume K Tons Forecast, by Application 2020 & 2033
- Table 27: Global Zinc Oxide Industry Revenue million Forecast, by Country 2020 & 2033
- Table 28: Global Zinc Oxide Industry Volume K Tons Forecast, by Country 2020 & 2033
- Table 29: United States Zinc Oxide Industry Revenue (million) Forecast, by Application 2020 & 2033
- Table 30: United States Zinc Oxide Industry Volume (K Tons) Forecast, by Application 2020 & 2033
- Table 31: Canada Zinc Oxide Industry Revenue (million) Forecast, by Application 2020 & 2033
- Table 32: Canada Zinc Oxide Industry Volume (K Tons) Forecast, by Application 2020 & 2033
- Table 33: Mexico Zinc Oxide Industry Revenue (million) Forecast, by Application 2020 & 2033
- Table 34: Mexico Zinc Oxide Industry Volume (K Tons) Forecast, by Application 2020 & 2033
- Table 35: Global Zinc Oxide Industry Revenue million Forecast, by Process 2020 & 2033
- Table 36: Global Zinc Oxide Industry Volume K Tons Forecast, by Process 2020 & 2033
- Table 37: Global Zinc Oxide Industry Revenue million Forecast, by Application 2020 & 2033
- Table 38: Global Zinc Oxide Industry Volume K Tons Forecast, by Application 2020 & 2033
- Table 39: Global Zinc Oxide Industry Revenue million Forecast, by Country 2020 & 2033
- Table 40: Global Zinc Oxide Industry Volume K Tons Forecast, by Country 2020 & 2033
- Table 41: Germany Zinc Oxide Industry Revenue (million) Forecast, by Application 2020 & 2033
- Table 42: Germany Zinc Oxide Industry Volume (K Tons) Forecast, by Application 2020 & 2033
- Table 43: United Kingdom Zinc Oxide Industry Revenue (million) Forecast, by Application 2020 & 2033
- Table 44: United Kingdom Zinc Oxide Industry Volume (K Tons) Forecast, by Application 2020 & 2033
- Table 45: France Zinc Oxide Industry Revenue (million) Forecast, by Application 2020 & 2033
- Table 46: France Zinc Oxide Industry Volume (K Tons) Forecast, by Application 2020 & 2033
- Table 47: Italy Zinc Oxide Industry Revenue (million) Forecast, by Application 2020 & 2033
- Table 48: Italy Zinc Oxide Industry Volume (K Tons) Forecast, by Application 2020 & 2033
- Table 49: Rest of Europe Zinc Oxide Industry Revenue (million) Forecast, by Application 2020 & 2033
- Table 50: Rest of Europe Zinc Oxide Industry Volume (K Tons) Forecast, by Application 2020 & 2033
- Table 51: Global Zinc Oxide Industry Revenue million Forecast, by Process 2020 & 2033
- Table 52: Global Zinc Oxide Industry Volume K Tons Forecast, by Process 2020 & 2033
- Table 53: Global Zinc Oxide Industry Revenue million Forecast, by Application 2020 & 2033
- Table 54: Global Zinc Oxide Industry Volume K Tons Forecast, by Application 2020 & 2033
- Table 55: Global Zinc Oxide Industry Revenue million Forecast, by Country 2020 & 2033
- Table 56: Global Zinc Oxide Industry Volume K Tons Forecast, by Country 2020 & 2033
- Table 57: Brazil Zinc Oxide Industry Revenue (million) Forecast, by Application 2020 & 2033
- Table 58: Brazil Zinc Oxide Industry Volume (K Tons) Forecast, by Application 2020 & 2033
- Table 59: Argentina Zinc Oxide Industry Revenue (million) Forecast, by Application 2020 & 2033
- Table 60: Argentina Zinc Oxide Industry Volume (K Tons) Forecast, by Application 2020 & 2033
- Table 61: Rest of South America Zinc Oxide Industry Revenue (million) Forecast, by Application 2020 & 2033
- Table 62: Rest of South America Zinc Oxide Industry Volume (K Tons) Forecast, by Application 2020 & 2033
- Table 63: Global Zinc Oxide Industry Revenue million Forecast, by Process 2020 & 2033
- Table 64: Global Zinc Oxide Industry Volume K Tons Forecast, by Process 2020 & 2033
- Table 65: Global Zinc Oxide Industry Revenue million Forecast, by Application 2020 & 2033
- Table 66: Global Zinc Oxide Industry Volume K Tons Forecast, by Application 2020 & 2033
- Table 67: Global Zinc Oxide Industry Revenue million Forecast, by Country 2020 & 2033
- Table 68: Global Zinc Oxide Industry Volume K Tons Forecast, by Country 2020 & 2033
- Table 69: Saudi Arabia Zinc Oxide Industry Revenue (million) Forecast, by Application 2020 & 2033
- Table 70: Saudi Arabia Zinc Oxide Industry Volume (K Tons) Forecast, by Application 2020 & 2033
- Table 71: South Africa Zinc Oxide Industry Revenue (million) Forecast, by Application 2020 & 2033
- Table 72: South Africa Zinc Oxide Industry Volume (K Tons) Forecast, by Application 2020 & 2033
- Table 73: Rest of Middle East and Africa Zinc Oxide Industry Revenue (million) Forecast, by Application 2020 & 2033
- Table 74: Rest of Middle East and Africa Zinc Oxide Industry Volume (K Tons) Forecast, by Application 2020 & 2033
Frequently Asked Questions
1. What is the projected Compound Annual Growth Rate (CAGR) of the Zinc Oxide Industry?
The projected CAGR is approximately 3.81%.
2. Which companies are prominent players in the Zinc Oxide Industry?
Key companies in the market include Pan-Continental Chemical, Hanil, HAKUSUI TECH, EverZinc, Zinc-Co-India, Rubamin, Weifang Longda Zinc Industry Co Ltd, Suraj Udyog, Hindustan Zinc Limited, Zochem Inc *List Not Exhaustive, Zinc Nacional SA, Silox SA, Akrochem Corporation, ZM SILESIA SA.
3. What are the main segments of the Zinc Oxide Industry?
The market segments include Process, Application.
4. Can you provide details about the market size?
The market size is estimated to be USD 2.36 million as of 2022.
5. What are some drivers contributing to market growth?
Growing Demand from the Rubber and Tire Industry; Other Drivers.
6. What are the notable trends driving market growth?
The Rubber and Tire Industry Dominate the Market.
7. Are there any restraints impacting market growth?
Fluctuation in Raw Material Prices; Other Restraints.
8. Can you provide examples of recent developments in the market?
June 2022: Aterian Investment Partners merged U.S. Zinc and EverZinc, two of the world's largest producers of zinc chemical products, to form the world's leading zinc chemistry company.
9. What pricing options are available for accessing the report?
Pricing options include single-user, multi-user, and enterprise licenses priced at USD 4750, USD 5250, and USD 8750 respectively.
10. Is the market size provided in terms of value or volume?
The market size is provided in terms of value, measured in million and volume, measured in K Tons.
11. Are there any specific market keywords associated with the report?
Yes, the market keyword associated with the report is "Zinc Oxide Industry," which aids in identifying and referencing the specific market segment covered.
12. How do I determine which pricing option suits my needs best?
The pricing options vary based on user requirements and access needs. Individual users may opt for single-user licenses, while businesses requiring broader access may choose multi-user or enterprise licenses for cost-effective access to the report.
13. Are there any additional resources or data provided in the Zinc Oxide Industry report?
While the report offers comprehensive insights, it's advisable to review the specific contents or supplementary materials provided to ascertain if additional resources or data are available.
14. How can I stay updated on further developments or reports in the Zinc Oxide Industry?
To stay informed about further developments, trends, and reports in the Zinc Oxide Industry, consider subscribing to industry newsletters, following relevant companies and organizations, or regularly checking reputable industry news sources and publications.
Methodology
Step 1 - Identification of Relevant Samples Size from Population Database


Step 2 - Approaches for Defining Global Market Size (Value, Volume* & Price*)

Note*: In applicable scenarios
Step 3 - Data Sources
Primary Research
- Web Analytics
- Survey Reports
- Research Institute
- Latest Research Reports
- Opinion Leaders
Secondary Research
- Annual Reports
- White Paper
- Latest Press Release
- Industry Association
- Paid Database
- Investor Presentations

Step 4 - Data Triangulation
Involves using different sources of information in order to increase the validity of a study
These sources are likely to be stakeholders in a program - participants, other researchers, program staff, other community members, and so on.
Then we put all data in single framework & apply various statistical tools to find out the dynamic on the market.
During the analysis stage, feedback from the stakeholder groups would be compared to determine areas of agreement as well as areas of divergence