

Key Insights
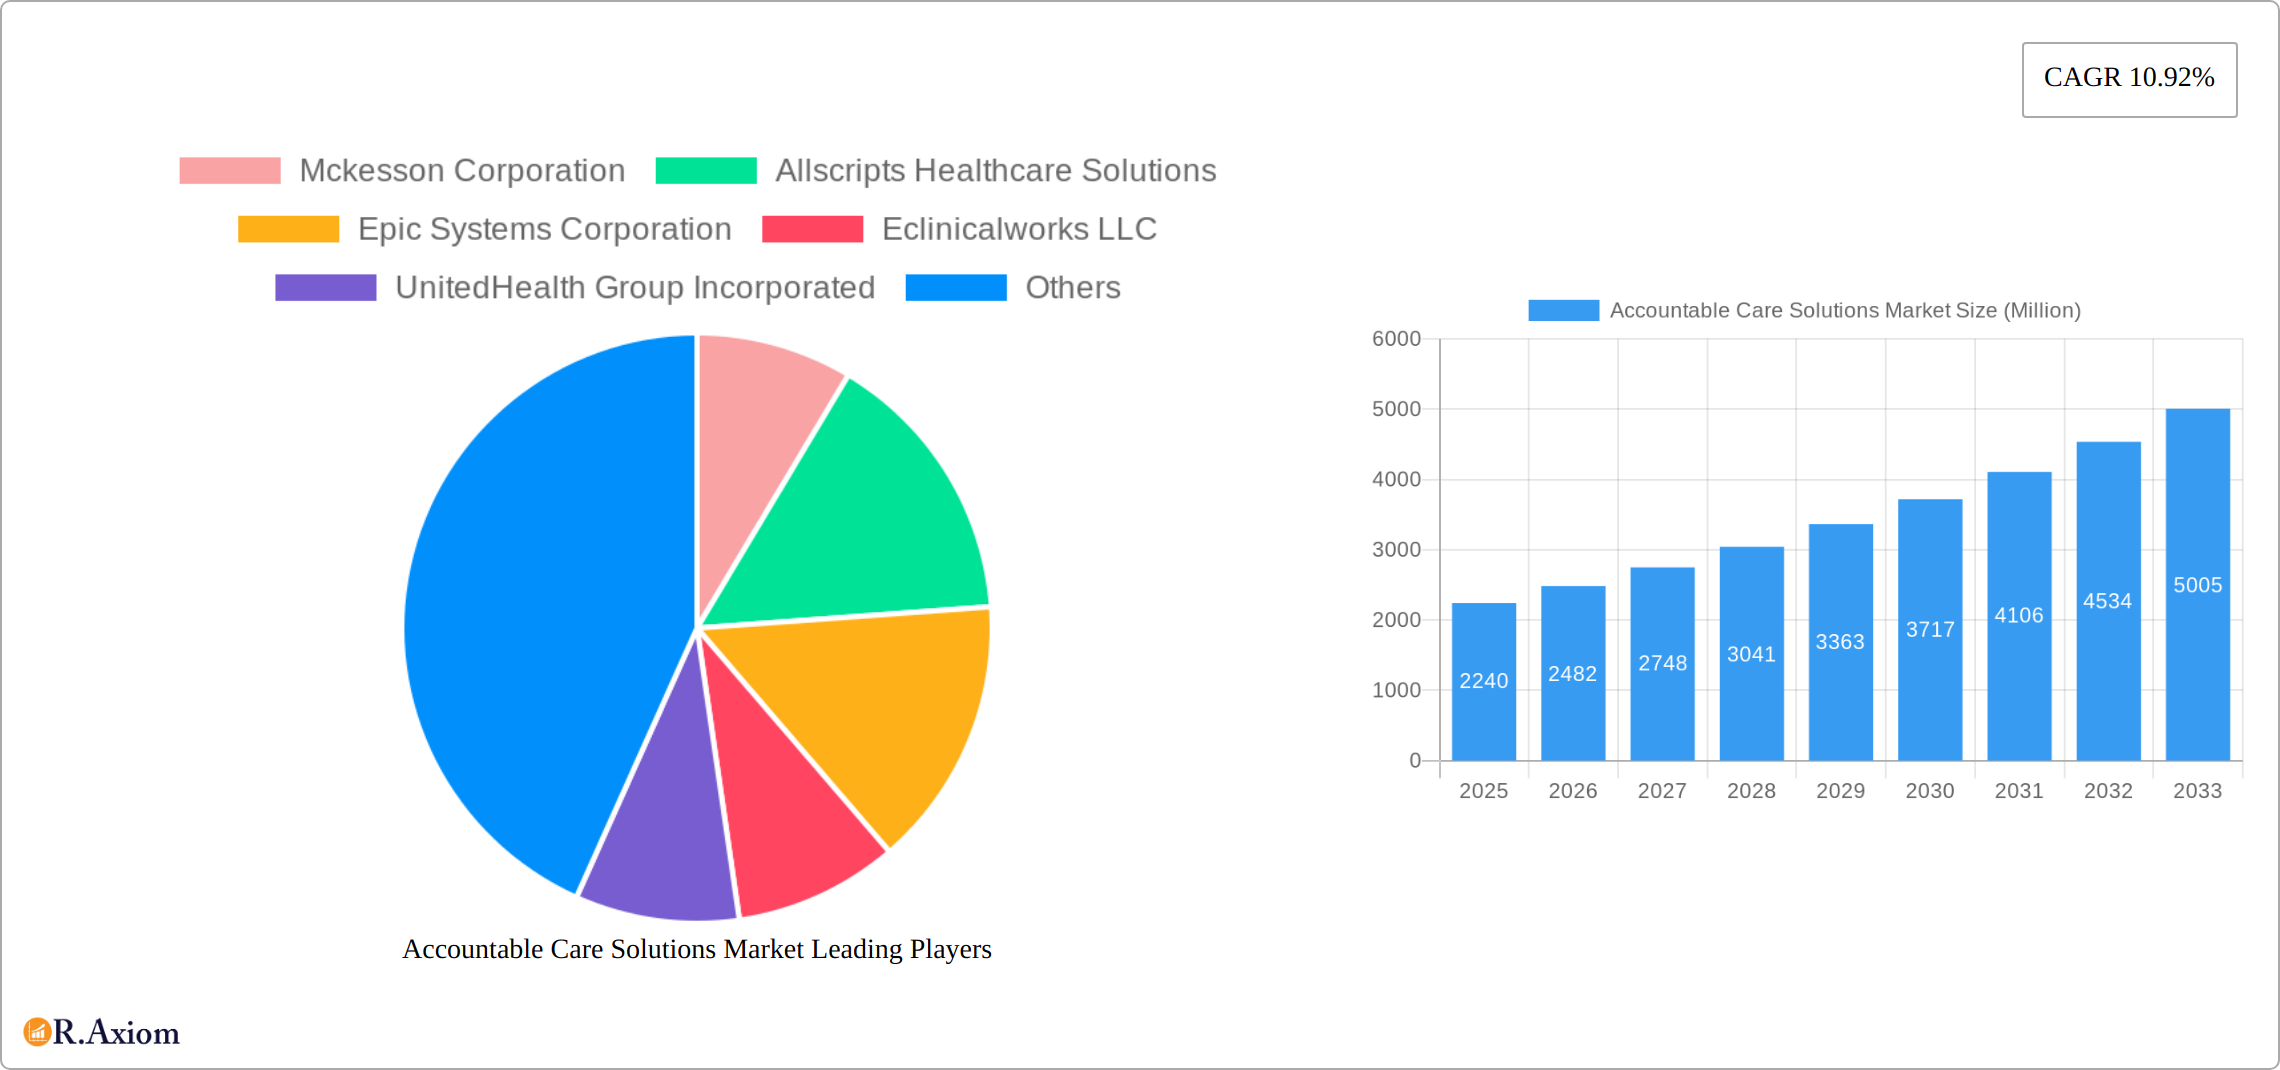
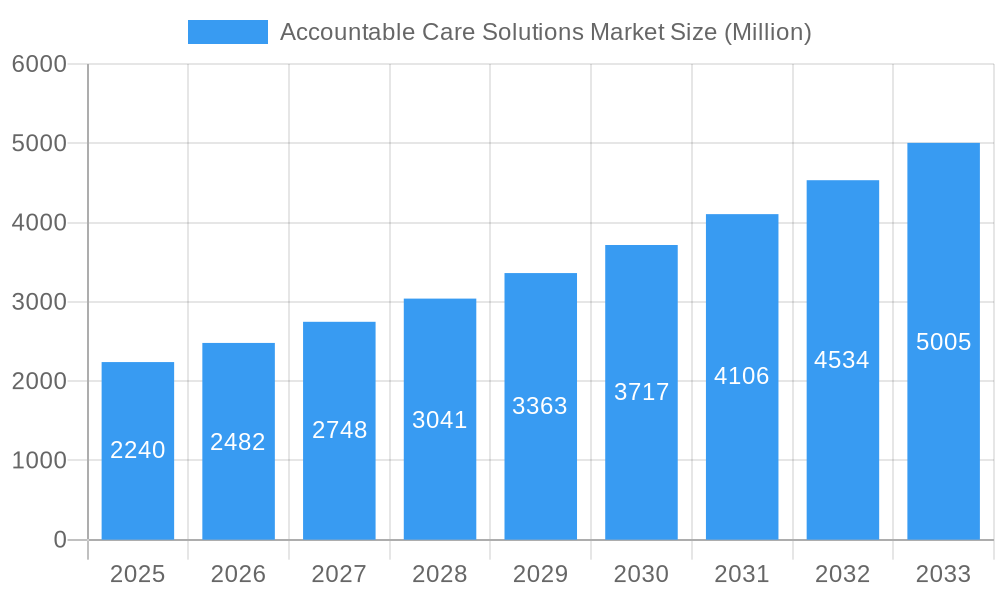
The Accountable Care Solutions (ACS) market, valued at $2.24 billion in 2025, is projected to experience robust growth, driven by a Compound Annual Growth Rate (CAGR) of 10.92% from 2025 to 2033. This expansion is fueled by several key factors. Increasing government initiatives promoting value-based care models incentivize healthcare providers to adopt ACS solutions for improved patient outcomes and cost efficiency. The rising prevalence of chronic diseases necessitates better care coordination and management, further driving demand for these solutions. Technological advancements, particularly in areas like electronic health records (EHRs), healthcare analytics, and cloud-based platforms, are enhancing the efficiency and effectiveness of ACS, making them more accessible and attractive to healthcare providers and payers. The integration of data analytics within ACS platforms enables better predictive modeling, allowing for proactive intervention and personalized care plans, thereby contributing to overall market growth. Furthermore, the rising adoption of telehealth and remote patient monitoring further fuels this market, as ACS solutions are integral to effectively managing patients across various care settings.
Accountable Care Solutions Market Market Size (In Billion)
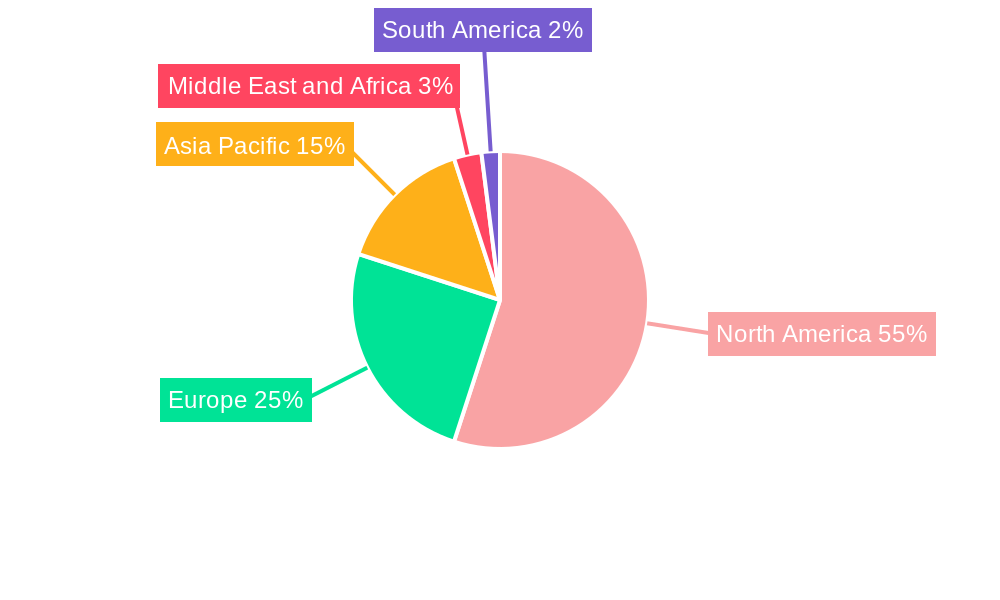
Market segmentation reveals significant opportunities across product and services (Electronic Health Records, Healthcare Analytics, Revenue Cycle Management, etc.), deployment models (on-premise, cloud-based), and end-users (healthcare providers and payers). North America currently dominates the market, given the advanced healthcare infrastructure and early adoption of value-based care models. However, Asia Pacific is projected to exhibit the fastest growth during the forecast period, driven by increasing healthcare expenditure, rising digitalization, and growing adoption of advanced healthcare technologies in developing economies within the region. While market restraints include high implementation costs and the need for robust IT infrastructure, the long-term benefits of improved patient outcomes and cost savings are expected to outweigh these challenges, driving continued market expansion in the coming years.
Accountable Care Solutions Market Company Market Share
Accountable Care Solutions Market: A Comprehensive Report (2019-2033)
This in-depth report provides a comprehensive analysis of the Accountable Care Solutions market, encompassing market size, growth drivers, challenges, and future opportunities from 2019 to 2033. The study covers key segments, leading players, and significant industry developments, offering actionable insights for stakeholders across the healthcare ecosystem. The report utilizes data from the historical period (2019-2024), base year (2025), and estimated year (2025) to project the market forecast (2025-2033). The total market value in 2025 is estimated at xx Million.
Accountable Care Solutions Market Concentration & Innovation
The Accountable Care Solutions (ACS) market exhibits a moderately consolidated structure, with several key players holding significant market share. Mckesson Corporation, Allscripts Healthcare Solutions, Epic Systems Corporation, and Cerner Corporation are among the dominant players, each contributing xx% to xx% of the total market revenue in 2025. However, the market also features numerous smaller, specialized players, particularly in niche areas like revenue cycle management or specific analytics solutions.
Innovation Drivers: The market is propelled by technological advancements such as AI-driven predictive analytics, cloud-based solutions, and the increasing adoption of interoperable EHR systems. Regulatory pressures for improved healthcare outcomes and cost efficiency further stimulate innovation.
Regulatory Frameworks: Government regulations and initiatives, such as the Centers for Medicare & Medicaid Services (CMS) programs, strongly influence the market. These regulations shape the adoption of ACS solutions and drive the development of compliant technologies. The shift from the GPDC model to the REACH model in March 2022 exemplifies this regulatory influence.
Product Substitutes: While direct substitutes are limited, the absence of effective ACS solutions can lead to reliance on traditional, less efficient healthcare management methods.
End-User Trends: Healthcare providers are increasingly adopting ACS solutions to improve patient outcomes, reduce costs, and meet regulatory requirements. Payers are also leveraging these solutions for risk management and better network management.
M&A Activities: The ACS market has witnessed significant mergers and acquisitions (M&A) activity in recent years, with deal values ranging from xx Million to xx Million. These activities reflect the market's consolidation trend and the pursuit of enhanced capabilities and market reach.
Accountable Care Solutions Market Industry Trends & Insights
The Accountable Care Solutions market is experiencing robust growth, driven by several factors. The increasing prevalence of chronic diseases, coupled with a growing aging population, necessitates efficient healthcare management solutions. Furthermore, government initiatives promoting value-based care and the increasing adoption of electronic health records (EHRs) are fueling market expansion. The rising demand for data analytics for better decision-making and improved care coordination also contributes significantly to this growth.
Technological advancements, such as the development of AI-powered tools for predictive analytics and remote patient monitoring, are disrupting the traditional ACS landscape. These technologies offer enhanced efficiency, improved accuracy, and better patient engagement. Consumer preferences for personalized and accessible healthcare services are further driving the demand for sophisticated ACS solutions. The competitive dynamics within the market are intense, with established players facing challenges from agile startups offering innovative solutions. The Compound Annual Growth Rate (CAGR) for the period 2025-2033 is projected at xx%, with market penetration expected to reach xx% by 2033.
Dominant Markets & Segments in Accountable Care Solutions Market
Leading Region/Country: The North American market currently holds the largest share of the global Accountable Care Solutions market, driven by factors such as robust healthcare infrastructure, increasing adoption of advanced technologies, and supportive government policies. Europe and Asia Pacific are anticipated to show significant growth in the coming years.
Dominant Segments:
- Product & Services: Electronic Health/Medical Records (EHRs) currently dominate the product segment, followed by Healthcare Analytics and Revenue Cycle Management (RCM) solutions. The market for EHRs is projected to reach xx Million in 2033. Claims and Payment Management solutions also exhibit significant growth potential.
- Deployment: Web & Cloud-based deployments are gaining popularity due to their scalability, flexibility, and cost-effectiveness. However, On-premise deployments still hold a significant market share, particularly among larger healthcare organizations with stringent security requirements.
- End User: Healthcare providers constitute the largest end-user segment, followed by healthcare payers. The increasing adoption of value-based care models is driving demand from both segments.
Key Drivers:
- Economic Policies: Government initiatives promoting value-based care and telehealth are crucial drivers.
- Healthcare Infrastructure: The development and upgrade of healthcare IT infrastructure significantly influence adoption rates.
Accountable Care Solutions Market Product Developments
Recent product innovations in the Accountable Care Solutions (ACS) market are revolutionizing healthcare delivery. The focus is intensely on enhanced interoperability, seamless integration with existing Electronic Health Records (EHRs) and other healthcare IT systems, and a significantly improved user experience for both clinicians and patients. AI-powered tools are no longer a novelty; they are becoming indispensable, offering sophisticated predictive analytics, robust risk stratification capabilities, and personalized care pathways. The market is rapidly transitioning towards cloud-based and mobile-accessible solutions, dramatically improving accessibility, efficiency, and data security. These advancements provide significant competitive advantages through more accurate data analysis, the ability to deliver truly personalized care plans, and streamlined, automated workflows. Ultimately, the goal remains steadfast: to improve patient outcomes while simultaneously reducing the overall cost of care.
Report Scope & Segmentation Analysis
This report segments the Accountable Care Solutions market across various parameters:
Product & Services: Electronic Health/Medical Records, Healthcare Analytics, Revenue Cycle Management Solutions (RCM), Claims Management Solutions, Payment Management Solutions, Support and Maintenance Services, Other Products & Services. Each segment is analyzed for its market size, growth rate, and competitive landscape. Growth projections for each segment are included in the full report.
Deployment: On-premise, Web & Cloud-Based. This segmentation details market share and projected growth for each deployment model, considering factors like security concerns and scalability requirements.
End User: Healthcare Providers, Healthcare Payers. Analysis of the unique needs and adoption patterns of these end-user groups is provided, along with projections for future growth.
Key Drivers of Accountable Care Solutions Market Growth
The burgeoning Accountable Care Solutions market is propelled by several converging factors. The widespread adoption of value-based care models by governments and payers worldwide is a primary driver. Simultaneously, advancements in data analytics and artificial intelligence (AI) are empowering providers with unprecedented insights into patient populations. The urgent need for improved care coordination, a reduction in wasteful healthcare spending, and the escalating prevalence of chronic diseases are creating an undeniable demand for effective ACS solutions. Furthermore, regulatory pressures and financial incentives designed to reward improved efficiency and quality of care are further stimulating market expansion.
Challenges in the Accountable Care Solutions Market Sector
Significant challenges include the high cost of implementation and integration of ACS solutions, data interoperability issues across different healthcare systems, concerns around data security and privacy, and the need for skilled professionals to manage these complex systems. These factors can significantly impact the adoption rate and market growth.
Emerging Opportunities in Accountable Care Solutions Market
Exciting opportunities abound within the ACS market, particularly in the development and sophisticated integration of AI and machine learning technologies. These technologies are transforming predictive analytics and enabling the delivery of truly personalized medicine. The explosive growth of telehealth and remote patient monitoring (RPM) is also creating a wealth of new opportunities for ACS solutions to enhance patient engagement and access to care. Expansion into underserved markets, often characterized by significant health disparities, and the development of specialized solutions tailored to the unique needs of specific populations (e.g., geriatric care, pediatric care, oncology) present substantial, untapped growth potential.
Leading Players in the Accountable Care Solutions Market
Key Developments in Accountable Care Solutions Market Industry
- March 2022: Collaborative Health Systems and Community Care Alliance partnered in a joint venture to significantly enhance population health management capabilities, demonstrating a trend towards collaboration and resource pooling within the ACS space.
- March 2022: CMS launched the REACH accountable care model, replacing the GPDC model, reflecting a significant shift in the government's approach to value-based care and incentivizing the adoption of innovative ACS solutions.
- [Add more recent developments here with dates and brief descriptions]
Strategic Outlook for Accountable Care Solutions Market
The Accountable Care Solutions market is poised for substantial and sustained growth. This growth trajectory is fueled by continuous technological innovation, the accelerating adoption of value-based care models, and supportive government policies aimed at improving healthcare quality and affordability. The seamless integration of AI, machine learning, and telehealth will undeniably shape the future of ACS, creating transformative opportunities for market expansion and, most importantly, improved patient outcomes. While growth is expected, the market is also anticipated to experience continued consolidation, with larger established players strategically acquiring smaller companies to gain a competitive edge, expand their product portfolios, and solidify their market dominance. This consolidation will likely lead to further innovation and wider accessibility of advanced ACS solutions.
Accountable Care Solutions Market Segmentation
-
1. Product & Services
- 1.1. Electronic Health/Medical Records
- 1.2. Healthcare Analytics
- 1.3. Revenue Cycle Management Solutions (RCM)
- 1.4. Claims Management Solutions
- 1.5. Payment Management Solutions
- 1.6. Support and Maintenance Services
- 1.7. Other Products & Services
-
2. Deployment
- 2.1. On-premise
- 2.2. Web & Cloud-Based
-
3. End User
- 3.1. Healthcare Providers
- 3.2. Healthcare Payers
Accountable Care Solutions Market Segmentation By Geography
-
1. North America
- 1.1. United States
- 1.2. Canada
- 1.3. Mexico
-
2. Europe
- 2.1. Germany
- 2.2. United Kingdom
- 2.3. France
- 2.4. Italy
- 2.5. Spain
- 2.6. Rest of Europe
-
3. Asia Pacific
- 3.1. China
- 3.2. Japan
- 3.3. India
- 3.4. Australia
- 3.5. South Korea
- 3.6. Rest of Asia Pacific
-
4. Middle East and Africa
- 4.1. GCC
- 4.2. South Africa
- 4.3. Rest of Middle East and Africa
-
5. South America
- 5.1. Brazil
- 5.2. Argentina
- 5.3. Rest of South America
Accountable Care Solutions Market Regional Market Share
Geographic Coverage of Accountable Care Solutions Market
Accountable Care Solutions Market REPORT HIGHLIGHTS
| Aspects | Details |
|---|---|
| Study Period | 2020-2034 |
| Base Year | 2025 |
| Estimated Year | 2026 |
| Forecast Period | 2026-2034 |
| Historical Period | 2020-2025 |
| Growth Rate | CAGR of 10.92% from 2020-2034 |
| Segmentation |
|
Table of Contents
- 1. Introduction
- 1.1. Research Scope
- 1.2. Market Segmentation
- 1.3. Research Methodology
- 1.4. Definitions and Assumptions
- 2. Executive Summary
- 2.1. Introduction
- 3. Market Dynamics
- 3.1. Introduction
- 3.2. Market Drivers
- 3.2.1. Emergence of Big Data in Healthcare; Government Regulations and Initiatives to Promote Patient-Centric Care; Increasing Demand to Curtail Healthcare Costs
- 3.3. Market Restrains
- 3.3.1. Data Security and Privacy Concerns; High Investments Required for Supporting Infrastructure
- 3.4. Market Trends
- 3.4.1. Electronic Health/Medical Records Segment is Expected to Hold a Significant Market Share Over the Forecast Period
- 4. Market Factor Analysis
- 4.1. Porters Five Forces
- 4.2. Supply/Value Chain
- 4.3. PESTEL analysis
- 4.4. Market Entropy
- 4.5. Patent/Trademark Analysis
- 5. Global Accountable Care Solutions Market Analysis, Insights and Forecast, 2020-2032
- 5.1. Market Analysis, Insights and Forecast - by Product & Services
- 5.1.1. Electronic Health/Medical Records
- 5.1.2. Healthcare Analytics
- 5.1.3. Revenue Cycle Management Solutions (RCM)
- 5.1.4. Claims Management Solutions
- 5.1.5. Payment Management Solutions
- 5.1.6. Support and Maintenance Services
- 5.1.7. Other Products & Services
- 5.2. Market Analysis, Insights and Forecast - by Deployment
- 5.2.1. On-premise
- 5.2.2. Web & Cloud-Based
- 5.3. Market Analysis, Insights and Forecast - by End User
- 5.3.1. Healthcare Providers
- 5.3.2. Healthcare Payers
- 5.4. Market Analysis, Insights and Forecast - by Region
- 5.4.1. North America
- 5.4.2. Europe
- 5.4.3. Asia Pacific
- 5.4.4. Middle East and Africa
- 5.4.5. South America
- 5.1. Market Analysis, Insights and Forecast - by Product & Services
- 6. North America Accountable Care Solutions Market Analysis, Insights and Forecast, 2020-2032
- 6.1. Market Analysis, Insights and Forecast - by Product & Services
- 6.1.1. Electronic Health/Medical Records
- 6.1.2. Healthcare Analytics
- 6.1.3. Revenue Cycle Management Solutions (RCM)
- 6.1.4. Claims Management Solutions
- 6.1.5. Payment Management Solutions
- 6.1.6. Support and Maintenance Services
- 6.1.7. Other Products & Services
- 6.2. Market Analysis, Insights and Forecast - by Deployment
- 6.2.1. On-premise
- 6.2.2. Web & Cloud-Based
- 6.3. Market Analysis, Insights and Forecast - by End User
- 6.3.1. Healthcare Providers
- 6.3.2. Healthcare Payers
- 6.1. Market Analysis, Insights and Forecast - by Product & Services
- 7. Europe Accountable Care Solutions Market Analysis, Insights and Forecast, 2020-2032
- 7.1. Market Analysis, Insights and Forecast - by Product & Services
- 7.1.1. Electronic Health/Medical Records
- 7.1.2. Healthcare Analytics
- 7.1.3. Revenue Cycle Management Solutions (RCM)
- 7.1.4. Claims Management Solutions
- 7.1.5. Payment Management Solutions
- 7.1.6. Support and Maintenance Services
- 7.1.7. Other Products & Services
- 7.2. Market Analysis, Insights and Forecast - by Deployment
- 7.2.1. On-premise
- 7.2.2. Web & Cloud-Based
- 7.3. Market Analysis, Insights and Forecast - by End User
- 7.3.1. Healthcare Providers
- 7.3.2. Healthcare Payers
- 7.1. Market Analysis, Insights and Forecast - by Product & Services
- 8. Asia Pacific Accountable Care Solutions Market Analysis, Insights and Forecast, 2020-2032
- 8.1. Market Analysis, Insights and Forecast - by Product & Services
- 8.1.1. Electronic Health/Medical Records
- 8.1.2. Healthcare Analytics
- 8.1.3. Revenue Cycle Management Solutions (RCM)
- 8.1.4. Claims Management Solutions
- 8.1.5. Payment Management Solutions
- 8.1.6. Support and Maintenance Services
- 8.1.7. Other Products & Services
- 8.2. Market Analysis, Insights and Forecast - by Deployment
- 8.2.1. On-premise
- 8.2.2. Web & Cloud-Based
- 8.3. Market Analysis, Insights and Forecast - by End User
- 8.3.1. Healthcare Providers
- 8.3.2. Healthcare Payers
- 8.1. Market Analysis, Insights and Forecast - by Product & Services
- 9. Middle East and Africa Accountable Care Solutions Market Analysis, Insights and Forecast, 2020-2032
- 9.1. Market Analysis, Insights and Forecast - by Product & Services
- 9.1.1. Electronic Health/Medical Records
- 9.1.2. Healthcare Analytics
- 9.1.3. Revenue Cycle Management Solutions (RCM)
- 9.1.4. Claims Management Solutions
- 9.1.5. Payment Management Solutions
- 9.1.6. Support and Maintenance Services
- 9.1.7. Other Products & Services
- 9.2. Market Analysis, Insights and Forecast - by Deployment
- 9.2.1. On-premise
- 9.2.2. Web & Cloud-Based
- 9.3. Market Analysis, Insights and Forecast - by End User
- 9.3.1. Healthcare Providers
- 9.3.2. Healthcare Payers
- 9.1. Market Analysis, Insights and Forecast - by Product & Services
- 10. South America Accountable Care Solutions Market Analysis, Insights and Forecast, 2020-2032
- 10.1. Market Analysis, Insights and Forecast - by Product & Services
- 10.1.1. Electronic Health/Medical Records
- 10.1.2. Healthcare Analytics
- 10.1.3. Revenue Cycle Management Solutions (RCM)
- 10.1.4. Claims Management Solutions
- 10.1.5. Payment Management Solutions
- 10.1.6. Support and Maintenance Services
- 10.1.7. Other Products & Services
- 10.2. Market Analysis, Insights and Forecast - by Deployment
- 10.2.1. On-premise
- 10.2.2. Web & Cloud-Based
- 10.3. Market Analysis, Insights and Forecast - by End User
- 10.3.1. Healthcare Providers
- 10.3.2. Healthcare Payers
- 10.1. Market Analysis, Insights and Forecast - by Product & Services
- 11. Competitive Analysis
- 11.1. Global Market Share Analysis 2025
- 11.2. Company Profiles
- 11.2.1 Mckesson Corporation
- 11.2.1.1. Overview
- 11.2.1.2. Products
- 11.2.1.3. SWOT Analysis
- 11.2.1.4. Recent Developments
- 11.2.1.5. Financials (Based on Availability)
- 11.2.2 Allscripts Healthcare Solutions
- 11.2.2.1. Overview
- 11.2.2.2. Products
- 11.2.2.3. SWOT Analysis
- 11.2.2.4. Recent Developments
- 11.2.2.5. Financials (Based on Availability)
- 11.2.3 Epic Systems Corporation
- 11.2.3.1. Overview
- 11.2.3.2. Products
- 11.2.3.3. SWOT Analysis
- 11.2.3.4. Recent Developments
- 11.2.3.5. Financials (Based on Availability)
- 11.2.4 Eclinicalworks LLC
- 11.2.4.1. Overview
- 11.2.4.2. Products
- 11.2.4.3. SWOT Analysis
- 11.2.4.4. Recent Developments
- 11.2.4.5. Financials (Based on Availability)
- 11.2.5 UnitedHealth Group Incorporated
- 11.2.5.1. Overview
- 11.2.5.2. Products
- 11.2.5.3. SWOT Analysis
- 11.2.5.4. Recent Developments
- 11.2.5.5. Financials (Based on Availability)
- 11.2.6 Verisk Analytics Inc
- 11.2.6.1. Overview
- 11.2.6.2. Products
- 11.2.6.3. SWOT Analysis
- 11.2.6.4. Recent Developments
- 11.2.6.5. Financials (Based on Availability)
- 11.2.7 Constellation Software
- 11.2.7.1. Overview
- 11.2.7.2. Products
- 11.2.7.3. SWOT Analysis
- 11.2.7.4. Recent Developments
- 11.2.7.5. Financials (Based on Availability)
- 11.2.8 IBM Healthcare
- 11.2.8.1. Overview
- 11.2.8.2. Products
- 11.2.8.3. SWOT Analysis
- 11.2.8.4. Recent Developments
- 11.2.8.5. Financials (Based on Availability)
- 11.2.9 Cerner Corporation
- 11.2.9.1. Overview
- 11.2.9.2. Products
- 11.2.9.3. SWOT Analysis
- 11.2.9.4. Recent Developments
- 11.2.9.5. Financials (Based on Availability)
- 11.2.10 ZeOmega Inc
- 11.2.10.1. Overview
- 11.2.10.2. Products
- 11.2.10.3. SWOT Analysis
- 11.2.10.4. Recent Developments
- 11.2.10.5. Financials (Based on Availability)
- 11.2.11 Aetna Inc
- 11.2.11.1. Overview
- 11.2.11.2. Products
- 11.2.11.3. SWOT Analysis
- 11.2.11.4. Recent Developments
- 11.2.11.5. Financials (Based on Availability)
- 11.2.12 Athenahealth Inc
- 11.2.12.1. Overview
- 11.2.12.2. Products
- 11.2.12.3. SWOT Analysis
- 11.2.12.4. Recent Developments
- 11.2.12.5. Financials (Based on Availability)
- 11.2.1 Mckesson Corporation
List of Figures
- Figure 1: Global Accountable Care Solutions Market Revenue Breakdown (Million, %) by Region 2025 & 2033
- Figure 2: Global Accountable Care Solutions Market Volume Breakdown (K Unit, %) by Region 2025 & 2033
- Figure 3: North America Accountable Care Solutions Market Revenue (Million), by Product & Services 2025 & 2033
- Figure 4: North America Accountable Care Solutions Market Volume (K Unit), by Product & Services 2025 & 2033
- Figure 5: North America Accountable Care Solutions Market Revenue Share (%), by Product & Services 2025 & 2033
- Figure 6: North America Accountable Care Solutions Market Volume Share (%), by Product & Services 2025 & 2033
- Figure 7: North America Accountable Care Solutions Market Revenue (Million), by Deployment 2025 & 2033
- Figure 8: North America Accountable Care Solutions Market Volume (K Unit), by Deployment 2025 & 2033
- Figure 9: North America Accountable Care Solutions Market Revenue Share (%), by Deployment 2025 & 2033
- Figure 10: North America Accountable Care Solutions Market Volume Share (%), by Deployment 2025 & 2033
- Figure 11: North America Accountable Care Solutions Market Revenue (Million), by End User 2025 & 2033
- Figure 12: North America Accountable Care Solutions Market Volume (K Unit), by End User 2025 & 2033
- Figure 13: North America Accountable Care Solutions Market Revenue Share (%), by End User 2025 & 2033
- Figure 14: North America Accountable Care Solutions Market Volume Share (%), by End User 2025 & 2033
- Figure 15: North America Accountable Care Solutions Market Revenue (Million), by Country 2025 & 2033
- Figure 16: North America Accountable Care Solutions Market Volume (K Unit), by Country 2025 & 2033
- Figure 17: North America Accountable Care Solutions Market Revenue Share (%), by Country 2025 & 2033
- Figure 18: North America Accountable Care Solutions Market Volume Share (%), by Country 2025 & 2033
- Figure 19: Europe Accountable Care Solutions Market Revenue (Million), by Product & Services 2025 & 2033
- Figure 20: Europe Accountable Care Solutions Market Volume (K Unit), by Product & Services 2025 & 2033
- Figure 21: Europe Accountable Care Solutions Market Revenue Share (%), by Product & Services 2025 & 2033
- Figure 22: Europe Accountable Care Solutions Market Volume Share (%), by Product & Services 2025 & 2033
- Figure 23: Europe Accountable Care Solutions Market Revenue (Million), by Deployment 2025 & 2033
- Figure 24: Europe Accountable Care Solutions Market Volume (K Unit), by Deployment 2025 & 2033
- Figure 25: Europe Accountable Care Solutions Market Revenue Share (%), by Deployment 2025 & 2033
- Figure 26: Europe Accountable Care Solutions Market Volume Share (%), by Deployment 2025 & 2033
- Figure 27: Europe Accountable Care Solutions Market Revenue (Million), by End User 2025 & 2033
- Figure 28: Europe Accountable Care Solutions Market Volume (K Unit), by End User 2025 & 2033
- Figure 29: Europe Accountable Care Solutions Market Revenue Share (%), by End User 2025 & 2033
- Figure 30: Europe Accountable Care Solutions Market Volume Share (%), by End User 2025 & 2033
- Figure 31: Europe Accountable Care Solutions Market Revenue (Million), by Country 2025 & 2033
- Figure 32: Europe Accountable Care Solutions Market Volume (K Unit), by Country 2025 & 2033
- Figure 33: Europe Accountable Care Solutions Market Revenue Share (%), by Country 2025 & 2033
- Figure 34: Europe Accountable Care Solutions Market Volume Share (%), by Country 2025 & 2033
- Figure 35: Asia Pacific Accountable Care Solutions Market Revenue (Million), by Product & Services 2025 & 2033
- Figure 36: Asia Pacific Accountable Care Solutions Market Volume (K Unit), by Product & Services 2025 & 2033
- Figure 37: Asia Pacific Accountable Care Solutions Market Revenue Share (%), by Product & Services 2025 & 2033
- Figure 38: Asia Pacific Accountable Care Solutions Market Volume Share (%), by Product & Services 2025 & 2033
- Figure 39: Asia Pacific Accountable Care Solutions Market Revenue (Million), by Deployment 2025 & 2033
- Figure 40: Asia Pacific Accountable Care Solutions Market Volume (K Unit), by Deployment 2025 & 2033
- Figure 41: Asia Pacific Accountable Care Solutions Market Revenue Share (%), by Deployment 2025 & 2033
- Figure 42: Asia Pacific Accountable Care Solutions Market Volume Share (%), by Deployment 2025 & 2033
- Figure 43: Asia Pacific Accountable Care Solutions Market Revenue (Million), by End User 2025 & 2033
- Figure 44: Asia Pacific Accountable Care Solutions Market Volume (K Unit), by End User 2025 & 2033
- Figure 45: Asia Pacific Accountable Care Solutions Market Revenue Share (%), by End User 2025 & 2033
- Figure 46: Asia Pacific Accountable Care Solutions Market Volume Share (%), by End User 2025 & 2033
- Figure 47: Asia Pacific Accountable Care Solutions Market Revenue (Million), by Country 2025 & 2033
- Figure 48: Asia Pacific Accountable Care Solutions Market Volume (K Unit), by Country 2025 & 2033
- Figure 49: Asia Pacific Accountable Care Solutions Market Revenue Share (%), by Country 2025 & 2033
- Figure 50: Asia Pacific Accountable Care Solutions Market Volume Share (%), by Country 2025 & 2033
- Figure 51: Middle East and Africa Accountable Care Solutions Market Revenue (Million), by Product & Services 2025 & 2033
- Figure 52: Middle East and Africa Accountable Care Solutions Market Volume (K Unit), by Product & Services 2025 & 2033
- Figure 53: Middle East and Africa Accountable Care Solutions Market Revenue Share (%), by Product & Services 2025 & 2033
- Figure 54: Middle East and Africa Accountable Care Solutions Market Volume Share (%), by Product & Services 2025 & 2033
- Figure 55: Middle East and Africa Accountable Care Solutions Market Revenue (Million), by Deployment 2025 & 2033
- Figure 56: Middle East and Africa Accountable Care Solutions Market Volume (K Unit), by Deployment 2025 & 2033
- Figure 57: Middle East and Africa Accountable Care Solutions Market Revenue Share (%), by Deployment 2025 & 2033
- Figure 58: Middle East and Africa Accountable Care Solutions Market Volume Share (%), by Deployment 2025 & 2033
- Figure 59: Middle East and Africa Accountable Care Solutions Market Revenue (Million), by End User 2025 & 2033
- Figure 60: Middle East and Africa Accountable Care Solutions Market Volume (K Unit), by End User 2025 & 2033
- Figure 61: Middle East and Africa Accountable Care Solutions Market Revenue Share (%), by End User 2025 & 2033
- Figure 62: Middle East and Africa Accountable Care Solutions Market Volume Share (%), by End User 2025 & 2033
- Figure 63: Middle East and Africa Accountable Care Solutions Market Revenue (Million), by Country 2025 & 2033
- Figure 64: Middle East and Africa Accountable Care Solutions Market Volume (K Unit), by Country 2025 & 2033
- Figure 65: Middle East and Africa Accountable Care Solutions Market Revenue Share (%), by Country 2025 & 2033
- Figure 66: Middle East and Africa Accountable Care Solutions Market Volume Share (%), by Country 2025 & 2033
- Figure 67: South America Accountable Care Solutions Market Revenue (Million), by Product & Services 2025 & 2033
- Figure 68: South America Accountable Care Solutions Market Volume (K Unit), by Product & Services 2025 & 2033
- Figure 69: South America Accountable Care Solutions Market Revenue Share (%), by Product & Services 2025 & 2033
- Figure 70: South America Accountable Care Solutions Market Volume Share (%), by Product & Services 2025 & 2033
- Figure 71: South America Accountable Care Solutions Market Revenue (Million), by Deployment 2025 & 2033
- Figure 72: South America Accountable Care Solutions Market Volume (K Unit), by Deployment 2025 & 2033
- Figure 73: South America Accountable Care Solutions Market Revenue Share (%), by Deployment 2025 & 2033
- Figure 74: South America Accountable Care Solutions Market Volume Share (%), by Deployment 2025 & 2033
- Figure 75: South America Accountable Care Solutions Market Revenue (Million), by End User 2025 & 2033
- Figure 76: South America Accountable Care Solutions Market Volume (K Unit), by End User 2025 & 2033
- Figure 77: South America Accountable Care Solutions Market Revenue Share (%), by End User 2025 & 2033
- Figure 78: South America Accountable Care Solutions Market Volume Share (%), by End User 2025 & 2033
- Figure 79: South America Accountable Care Solutions Market Revenue (Million), by Country 2025 & 2033
- Figure 80: South America Accountable Care Solutions Market Volume (K Unit), by Country 2025 & 2033
- Figure 81: South America Accountable Care Solutions Market Revenue Share (%), by Country 2025 & 2033
- Figure 82: South America Accountable Care Solutions Market Volume Share (%), by Country 2025 & 2033
List of Tables
- Table 1: Global Accountable Care Solutions Market Revenue Million Forecast, by Product & Services 2020 & 2033
- Table 2: Global Accountable Care Solutions Market Volume K Unit Forecast, by Product & Services 2020 & 2033
- Table 3: Global Accountable Care Solutions Market Revenue Million Forecast, by Deployment 2020 & 2033
- Table 4: Global Accountable Care Solutions Market Volume K Unit Forecast, by Deployment 2020 & 2033
- Table 5: Global Accountable Care Solutions Market Revenue Million Forecast, by End User 2020 & 2033
- Table 6: Global Accountable Care Solutions Market Volume K Unit Forecast, by End User 2020 & 2033
- Table 7: Global Accountable Care Solutions Market Revenue Million Forecast, by Region 2020 & 2033
- Table 8: Global Accountable Care Solutions Market Volume K Unit Forecast, by Region 2020 & 2033
- Table 9: Global Accountable Care Solutions Market Revenue Million Forecast, by Product & Services 2020 & 2033
- Table 10: Global Accountable Care Solutions Market Volume K Unit Forecast, by Product & Services 2020 & 2033
- Table 11: Global Accountable Care Solutions Market Revenue Million Forecast, by Deployment 2020 & 2033
- Table 12: Global Accountable Care Solutions Market Volume K Unit Forecast, by Deployment 2020 & 2033
- Table 13: Global Accountable Care Solutions Market Revenue Million Forecast, by End User 2020 & 2033
- Table 14: Global Accountable Care Solutions Market Volume K Unit Forecast, by End User 2020 & 2033
- Table 15: Global Accountable Care Solutions Market Revenue Million Forecast, by Country 2020 & 2033
- Table 16: Global Accountable Care Solutions Market Volume K Unit Forecast, by Country 2020 & 2033
- Table 17: United States Accountable Care Solutions Market Revenue (Million) Forecast, by Application 2020 & 2033
- Table 18: United States Accountable Care Solutions Market Volume (K Unit) Forecast, by Application 2020 & 2033
- Table 19: Canada Accountable Care Solutions Market Revenue (Million) Forecast, by Application 2020 & 2033
- Table 20: Canada Accountable Care Solutions Market Volume (K Unit) Forecast, by Application 2020 & 2033
- Table 21: Mexico Accountable Care Solutions Market Revenue (Million) Forecast, by Application 2020 & 2033
- Table 22: Mexico Accountable Care Solutions Market Volume (K Unit) Forecast, by Application 2020 & 2033
- Table 23: Global Accountable Care Solutions Market Revenue Million Forecast, by Product & Services 2020 & 2033
- Table 24: Global Accountable Care Solutions Market Volume K Unit Forecast, by Product & Services 2020 & 2033
- Table 25: Global Accountable Care Solutions Market Revenue Million Forecast, by Deployment 2020 & 2033
- Table 26: Global Accountable Care Solutions Market Volume K Unit Forecast, by Deployment 2020 & 2033
- Table 27: Global Accountable Care Solutions Market Revenue Million Forecast, by End User 2020 & 2033
- Table 28: Global Accountable Care Solutions Market Volume K Unit Forecast, by End User 2020 & 2033
- Table 29: Global Accountable Care Solutions Market Revenue Million Forecast, by Country 2020 & 2033
- Table 30: Global Accountable Care Solutions Market Volume K Unit Forecast, by Country 2020 & 2033
- Table 31: Germany Accountable Care Solutions Market Revenue (Million) Forecast, by Application 2020 & 2033
- Table 32: Germany Accountable Care Solutions Market Volume (K Unit) Forecast, by Application 2020 & 2033
- Table 33: United Kingdom Accountable Care Solutions Market Revenue (Million) Forecast, by Application 2020 & 2033
- Table 34: United Kingdom Accountable Care Solutions Market Volume (K Unit) Forecast, by Application 2020 & 2033
- Table 35: France Accountable Care Solutions Market Revenue (Million) Forecast, by Application 2020 & 2033
- Table 36: France Accountable Care Solutions Market Volume (K Unit) Forecast, by Application 2020 & 2033
- Table 37: Italy Accountable Care Solutions Market Revenue (Million) Forecast, by Application 2020 & 2033
- Table 38: Italy Accountable Care Solutions Market Volume (K Unit) Forecast, by Application 2020 & 2033
- Table 39: Spain Accountable Care Solutions Market Revenue (Million) Forecast, by Application 2020 & 2033
- Table 40: Spain Accountable Care Solutions Market Volume (K Unit) Forecast, by Application 2020 & 2033
- Table 41: Rest of Europe Accountable Care Solutions Market Revenue (Million) Forecast, by Application 2020 & 2033
- Table 42: Rest of Europe Accountable Care Solutions Market Volume (K Unit) Forecast, by Application 2020 & 2033
- Table 43: Global Accountable Care Solutions Market Revenue Million Forecast, by Product & Services 2020 & 2033
- Table 44: Global Accountable Care Solutions Market Volume K Unit Forecast, by Product & Services 2020 & 2033
- Table 45: Global Accountable Care Solutions Market Revenue Million Forecast, by Deployment 2020 & 2033
- Table 46: Global Accountable Care Solutions Market Volume K Unit Forecast, by Deployment 2020 & 2033
- Table 47: Global Accountable Care Solutions Market Revenue Million Forecast, by End User 2020 & 2033
- Table 48: Global Accountable Care Solutions Market Volume K Unit Forecast, by End User 2020 & 2033
- Table 49: Global Accountable Care Solutions Market Revenue Million Forecast, by Country 2020 & 2033
- Table 50: Global Accountable Care Solutions Market Volume K Unit Forecast, by Country 2020 & 2033
- Table 51: China Accountable Care Solutions Market Revenue (Million) Forecast, by Application 2020 & 2033
- Table 52: China Accountable Care Solutions Market Volume (K Unit) Forecast, by Application 2020 & 2033
- Table 53: Japan Accountable Care Solutions Market Revenue (Million) Forecast, by Application 2020 & 2033
- Table 54: Japan Accountable Care Solutions Market Volume (K Unit) Forecast, by Application 2020 & 2033
- Table 55: India Accountable Care Solutions Market Revenue (Million) Forecast, by Application 2020 & 2033
- Table 56: India Accountable Care Solutions Market Volume (K Unit) Forecast, by Application 2020 & 2033
- Table 57: Australia Accountable Care Solutions Market Revenue (Million) Forecast, by Application 2020 & 2033
- Table 58: Australia Accountable Care Solutions Market Volume (K Unit) Forecast, by Application 2020 & 2033
- Table 59: South Korea Accountable Care Solutions Market Revenue (Million) Forecast, by Application 2020 & 2033
- Table 60: South Korea Accountable Care Solutions Market Volume (K Unit) Forecast, by Application 2020 & 2033
- Table 61: Rest of Asia Pacific Accountable Care Solutions Market Revenue (Million) Forecast, by Application 2020 & 2033
- Table 62: Rest of Asia Pacific Accountable Care Solutions Market Volume (K Unit) Forecast, by Application 2020 & 2033
- Table 63: Global Accountable Care Solutions Market Revenue Million Forecast, by Product & Services 2020 & 2033
- Table 64: Global Accountable Care Solutions Market Volume K Unit Forecast, by Product & Services 2020 & 2033
- Table 65: Global Accountable Care Solutions Market Revenue Million Forecast, by Deployment 2020 & 2033
- Table 66: Global Accountable Care Solutions Market Volume K Unit Forecast, by Deployment 2020 & 2033
- Table 67: Global Accountable Care Solutions Market Revenue Million Forecast, by End User 2020 & 2033
- Table 68: Global Accountable Care Solutions Market Volume K Unit Forecast, by End User 2020 & 2033
- Table 69: Global Accountable Care Solutions Market Revenue Million Forecast, by Country 2020 & 2033
- Table 70: Global Accountable Care Solutions Market Volume K Unit Forecast, by Country 2020 & 2033
- Table 71: GCC Accountable Care Solutions Market Revenue (Million) Forecast, by Application 2020 & 2033
- Table 72: GCC Accountable Care Solutions Market Volume (K Unit) Forecast, by Application 2020 & 2033
- Table 73: South Africa Accountable Care Solutions Market Revenue (Million) Forecast, by Application 2020 & 2033
- Table 74: South Africa Accountable Care Solutions Market Volume (K Unit) Forecast, by Application 2020 & 2033
- Table 75: Rest of Middle East and Africa Accountable Care Solutions Market Revenue (Million) Forecast, by Application 2020 & 2033
- Table 76: Rest of Middle East and Africa Accountable Care Solutions Market Volume (K Unit) Forecast, by Application 2020 & 2033
- Table 77: Global Accountable Care Solutions Market Revenue Million Forecast, by Product & Services 2020 & 2033
- Table 78: Global Accountable Care Solutions Market Volume K Unit Forecast, by Product & Services 2020 & 2033
- Table 79: Global Accountable Care Solutions Market Revenue Million Forecast, by Deployment 2020 & 2033
- Table 80: Global Accountable Care Solutions Market Volume K Unit Forecast, by Deployment 2020 & 2033
- Table 81: Global Accountable Care Solutions Market Revenue Million Forecast, by End User 2020 & 2033
- Table 82: Global Accountable Care Solutions Market Volume K Unit Forecast, by End User 2020 & 2033
- Table 83: Global Accountable Care Solutions Market Revenue Million Forecast, by Country 2020 & 2033
- Table 84: Global Accountable Care Solutions Market Volume K Unit Forecast, by Country 2020 & 2033
- Table 85: Brazil Accountable Care Solutions Market Revenue (Million) Forecast, by Application 2020 & 2033
- Table 86: Brazil Accountable Care Solutions Market Volume (K Unit) Forecast, by Application 2020 & 2033
- Table 87: Argentina Accountable Care Solutions Market Revenue (Million) Forecast, by Application 2020 & 2033
- Table 88: Argentina Accountable Care Solutions Market Volume (K Unit) Forecast, by Application 2020 & 2033
- Table 89: Rest of South America Accountable Care Solutions Market Revenue (Million) Forecast, by Application 2020 & 2033
- Table 90: Rest of South America Accountable Care Solutions Market Volume (K Unit) Forecast, by Application 2020 & 2033
Frequently Asked Questions
1. What is the projected Compound Annual Growth Rate (CAGR) of the Accountable Care Solutions Market?
The projected CAGR is approximately 10.92%.
2. Which companies are prominent players in the Accountable Care Solutions Market?
Key companies in the market include Mckesson Corporation, Allscripts Healthcare Solutions, Epic Systems Corporation, Eclinicalworks LLC, UnitedHealth Group Incorporated, Verisk Analytics Inc, Constellation Software, IBM Healthcare, Cerner Corporation, ZeOmega Inc, Aetna Inc, Athenahealth Inc.
3. What are the main segments of the Accountable Care Solutions Market?
The market segments include Product & Services, Deployment, End User.
4. Can you provide details about the market size?
The market size is estimated to be USD 2.24 Million as of 2022.
5. What are some drivers contributing to market growth?
Emergence of Big Data in Healthcare; Government Regulations and Initiatives to Promote Patient-Centric Care; Increasing Demand to Curtail Healthcare Costs.
6. What are the notable trends driving market growth?
Electronic Health/Medical Records Segment is Expected to Hold a Significant Market Share Over the Forecast Period.
7. Are there any restraints impacting market growth?
Data Security and Privacy Concerns; High Investments Required for Supporting Infrastructure.
8. Can you provide examples of recent developments in the market?
In March 2022, Collaborative Health Systems, a population health management organization, and Community Care Alliance, an accountable care organization, entered into a venture.
9. What pricing options are available for accessing the report?
Pricing options include single-user, multi-user, and enterprise licenses priced at USD 4750, USD 5250, and USD 8750 respectively.
10. Is the market size provided in terms of value or volume?
The market size is provided in terms of value, measured in Million and volume, measured in K Unit.
11. Are there any specific market keywords associated with the report?
Yes, the market keyword associated with the report is "Accountable Care Solutions Market," which aids in identifying and referencing the specific market segment covered.
12. How do I determine which pricing option suits my needs best?
The pricing options vary based on user requirements and access needs. Individual users may opt for single-user licenses, while businesses requiring broader access may choose multi-user or enterprise licenses for cost-effective access to the report.
13. Are there any additional resources or data provided in the Accountable Care Solutions Market report?
While the report offers comprehensive insights, it's advisable to review the specific contents or supplementary materials provided to ascertain if additional resources or data are available.
14. How can I stay updated on further developments or reports in the Accountable Care Solutions Market?
To stay informed about further developments, trends, and reports in the Accountable Care Solutions Market, consider subscribing to industry newsletters, following relevant companies and organizations, or regularly checking reputable industry news sources and publications.
Methodology
Step 1 - Identification of Relevant Samples Size from Population Database


Step 2 - Approaches for Defining Global Market Size (Value, Volume* & Price*)

Note*: In applicable scenarios
Step 3 - Data Sources
Primary Research
- Web Analytics
- Survey Reports
- Research Institute
- Latest Research Reports
- Opinion Leaders
Secondary Research
- Annual Reports
- White Paper
- Latest Press Release
- Industry Association
- Paid Database
- Investor Presentations

Step 4 - Data Triangulation
Involves using different sources of information in order to increase the validity of a study
These sources are likely to be stakeholders in a program - participants, other researchers, program staff, other community members, and so on.
Then we put all data in single framework & apply various statistical tools to find out the dynamic on the market.
During the analysis stage, feedback from the stakeholder groups would be compared to determine areas of agreement as well as areas of divergence