

Key Insights
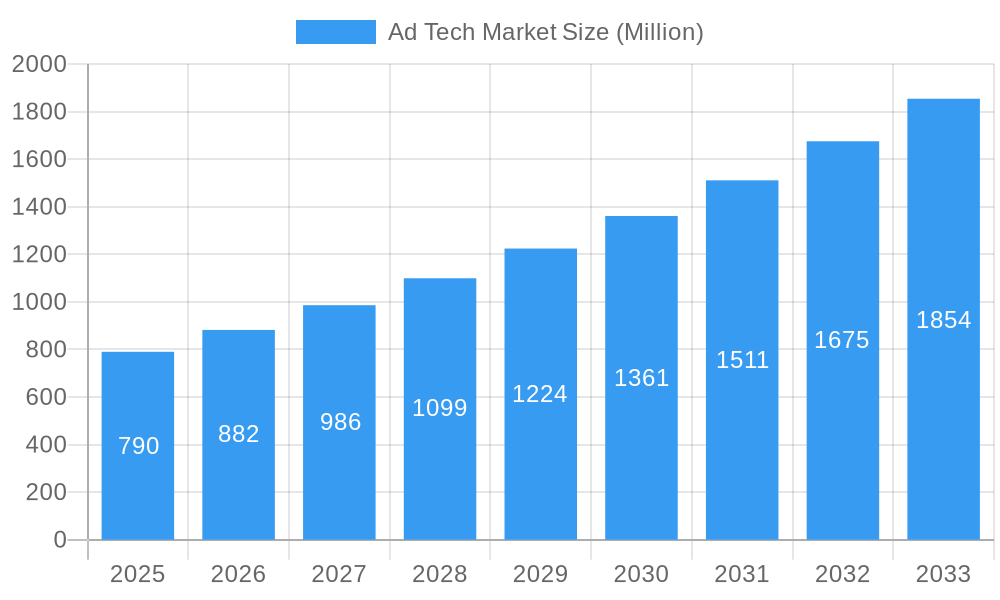
The Ad Tech market, valued at $0.79 billion in 2025, is projected to experience robust growth, driven by the increasing adoption of digital advertising across various industries. A Compound Annual Growth Rate (CAGR) of 11.54% from 2025 to 2033 indicates a significant expansion, fueled by several key factors. The rise of programmatic advertising, powered by Supply-Side Platforms (SSPs) and Demand-Side Platforms (DSPs), is automating ad buying and selling, leading to increased efficiency and targeting accuracy. The proliferation of mobile devices and smartphones is further expanding the addressable market, with video advertising and social media campaigns capturing significant market share due to their high engagement rates. Growth is also being spurred by the increasing sophistication of data management platforms, enabling more personalized and effective advertising strategies. While data privacy concerns and regulatory changes present potential restraints, the ongoing shift towards digital marketing and the continued development of innovative ad formats are expected to offset these challenges. The retail and e-commerce sector remains a dominant end-user industry, with significant opportunities also emerging in healthcare, BFSI (Banking, Financial Services, and Insurance), and telecommunications. Key players like Google, Meta, Amazon, and Adobe are leading the market innovation, driving competition and technological advancements.
Ad Tech Market Market Size (In Million)
Growth is expected to be particularly strong in regions with high internet penetration and expanding digital economies. North America currently holds a significant market share, but the Asia-Pacific region is poised for rapid expansion due to its burgeoning digital population and increasing adoption of online advertising. Europe will also maintain steady growth, driven by the increasing adoption of digital marketing strategies across various sectors. The competitive landscape is marked by a blend of established tech giants and specialized ad tech companies, fostering innovation and providing diverse solutions for advertisers and publishers. The continued evolution of ad formats, targeting technologies, and data analytics will further shape the market's trajectory in the coming years, creating both opportunities and challenges for market participants. Future growth will likely be influenced by factors such as evolving consumer preferences, the development of new advertising technologies (such as augmented reality advertising), and the effectiveness of regulatory frameworks designed to balance innovation with data privacy concerns.
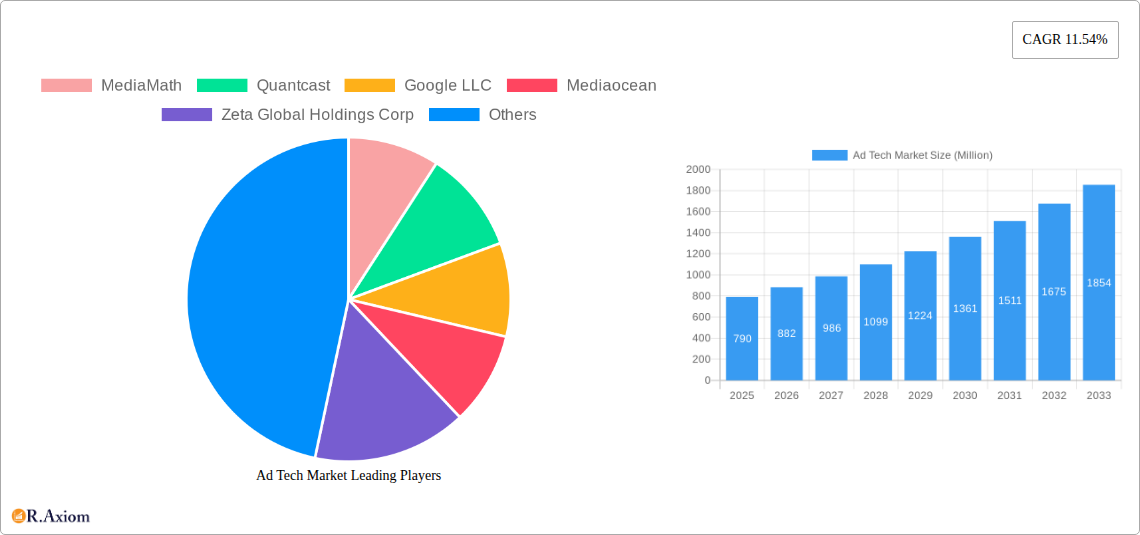
Ad Tech Market Company Market Share
Ad Tech Market: A Comprehensive Report (2019-2033)
This detailed report provides a comprehensive analysis of the Ad Tech market, covering its historical performance (2019-2024), current state (2025), and future projections (2025-2033). We delve into market segmentation, key players, technological advancements, and emerging trends, offering valuable insights for industry stakeholders. The report utilizes a robust methodology, incorporating extensive primary and secondary research to deliver accurate and actionable intelligence. The total market size in 2025 is estimated at $xx Million.
Ad Tech Market Market Concentration & Innovation
This section analyzes the competitive landscape of the Ad Tech market, examining market concentration, innovation drivers, regulatory influences, and market dynamics. We explore the impact of mergers and acquisitions (M&A) activities on market structure and identify key players shaping the industry. The market is characterized by a moderate level of concentration, with a few dominant players and a large number of smaller niche players.
Market Share: Google LLC and Meta Platform Inc. hold significant market share, estimated at xx% and xx% respectively in 2025. Other key players like Amazon com Inc, Adobe, and Microsoft Corporation collectively hold approximately xx%. The remaining market share is distributed among numerous smaller companies.
M&A Activity: The Ad Tech sector witnessed significant M&A activity between 2019 and 2024, with deal values exceeding $xx Million in total. These mergers and acquisitions often aimed to consolidate market share, expand product portfolios, or acquire specialized technologies. The frequency of such deals is expected to remain high in the coming years.
Innovation Drivers: Key innovation drivers include advancements in artificial intelligence (AI), machine learning (ML), and big data analytics. The increasing adoption of programmatic advertising, the evolution of ad formats, and the growing importance of data privacy regulations also fuel innovation.
Regulatory Frameworks: Government regulations concerning data privacy (GDPR, CCPA) and antitrust are significantly impacting the Ad Tech industry, forcing companies to adapt their data collection and targeting strategies.
Product Substitutes: The emergence of alternative advertising platforms and the increasing adoption of influencer marketing pose potential challenges to traditional Ad Tech solutions.
End-User Trends: The growing preference for personalized advertising experiences and the increasing demand for measurable advertising outcomes drive innovation within the Ad Tech sector.
Ad Tech Market Industry Trends & Insights
This section presents an in-depth analysis of current industry trends shaping the Ad Tech market. We examine market growth drivers, technological disruptions, evolving consumer preferences, and the competitive landscape. The market is experiencing strong growth, driven primarily by the increasing adoption of digital advertising across various sectors.
Market Growth Drivers: The rising penetration of the internet and mobile devices, coupled with the increasing adoption of e-commerce, fuels significant market growth. Consumer preference for personalized and targeted advertising experiences further strengthens this trend.
Technological Disruptions: The adoption of AI, ML, and blockchain technology is revolutionizing advertising targeting, optimization, and measurement. Programmatic advertising continues to gain traction, transforming the way ad space is bought and sold.
Consumer Preferences: The increasing demand for transparency, control, and accountability in advertising is leading to the development of more ethical and responsible advertising practices. Consumer demand for personalization is driving innovation in targeted advertising.
Competitive Dynamics: The Ad Tech market exhibits intense competition, with major players vying for market share through strategic partnerships, acquisitions, and product innovation. The market continues to evolve rapidly, with new technologies and business models emerging constantly. The Compound Annual Growth Rate (CAGR) during the forecast period is projected to be xx%. Market penetration is estimated to reach xx% by 2033.
Dominant Markets & Segments in Ad Tech Market
This section identifies the leading regions, countries, and market segments within the Ad Tech industry, focusing on Supply Side Platforms (SSPs), Demand Side Platforms (DSPs), Ad Exchanges, Data Management Platforms (DMPs), and various ad formats and device platforms.
By Platform:
- Demand-Side Platform (DSP): The DSP segment dominates the market, driven by the increasing demand for programmatic advertising solutions and real-time bidding (RTB). Major players in this space actively innovate and compete. The high growth is fuelled by increased marketing budgets and preference for data-driven campaigns.
- Supply-Side Platform (SSP): SSPs are another crucial segment, facilitating publishers' ad inventory management and monetization. This market segment is characterized by competition among existing players and the emergence of new SSPs focusing on specialized ad inventory.
- Ad Exchange: Ad exchanges are pivotal in connecting buyers and sellers of ad inventory. This segment is marked by high competition and continuous technological innovation, which allows for improved targeting and efficient bidding.
- Data Management Platform (DMP): The DMP market is crucial for marketers aiming to build robust customer profiles and manage customer data effectively. The growth is driven by the increasing need for personalized and targeted advertising.
By Ad Format:
- Video Advertising: Video advertising enjoys substantial market share due to its engagement and effectiveness. Growth drivers include increasing adoption of video content consumption and advancement of technologies like in-stream and out-stream advertising.
- Social Media Advertising: Social media platforms are significant advertising channels. The growth in this sector is fuelled by the expansion of active social media users and improvement of ad targeting based on social interactions.
- Search Advertising: Search engine marketing remains a major advertising channel, accounting for a significant market share. Growth is driven by the continued expansion of search engine usage and the implementation of advanced search algorithms.
By Device Platform:
- Mobile Devices and Smartphones: The mobile segment holds the dominant position due to increasing smartphone penetration and the convenience of mobile advertising. Continued advancement in mobile ad technology drives growth.
By End-user Industry:
- Retail and E-commerce: This sector accounts for the largest share, driven by the growth of online retail and the need for effective digital marketing strategies to reach target consumers.
- BFSI (Banking, Financial Services, and Insurance): BFSI represents a significant segment, with increased digital marketing investments by financial institutions to enhance customer engagement and acquisition.
Key Drivers (for dominant segments): Economic growth, increased digital adoption, and investment in digital marketing initiatives are significant drivers of growth across all dominant segments. Technological innovation (AI, ML) and improvement of ad targeting further contribute to dominance.
Ad Tech Market Product Developments
Recent product innovations focus on enhancing ad targeting, improving campaign performance measurement, and streamlining the ad buying process. AI-powered solutions are transforming campaign optimization and creative development. The focus remains on providing advertisers with more sophisticated tools to reach their target audiences effectively and efficiently. For example, Amazon Ads' image generation tool and Google's Video View Campaigns (VVC) represent notable advancements in AI-powered advertising solutions.
Report Scope & Segmentation Analysis
This report encompasses a comprehensive analysis of the Ad Tech market, segmented by platform (SSP, DSP, Ad Exchange, DMP), ad format (video, social media, search, email, others), device platform (desktop, mobile, others), and end-user industry (retail, healthcare, BFSI, services, telecommunications, others). Each segment’s market size, growth projections, and competitive dynamics are detailed within the full report. For example, the video advertising segment is projected to experience significant growth driven by the increased consumption of video content and advanced targeting capabilities. The mobile device segment will continue its dominance due to smartphone penetration.
Key Drivers of Ad Tech Market Growth
The Ad Tech market's growth is propelled by several key factors: the increasing adoption of digital advertising strategies across industries, the rising penetration of mobile and internet usage globally, the exponential growth of e-commerce and online retail, and the continuous innovation in advertising technologies (AI, ML, programmatic buying). These factors collectively fuel the demand for sophisticated Ad Tech solutions to optimize advertising campaigns and enhance ROI.
Challenges in the Ad Tech Market Sector
The Ad Tech industry faces challenges such as increasing regulatory scrutiny regarding data privacy and consumer data protection (GDPR, CCPA), evolving consumer preferences regarding data use, and the complexities of cross-platform ad measurement. The intense competition among major players also presents a significant challenge for smaller companies. These factors collectively introduce market uncertainty and potentially constrain market growth by xx% during the forecast period, compared to the initial growth projections.
Emerging Opportunities in Ad Tech Market
Emerging opportunities lie in the growing adoption of AI and ML for personalized advertising, the expansion of programmatic advertising across emerging markets, and the development of solutions that address increasing consumer concerns about data privacy. The integration of blockchain technology for transparent and secure ad transactions also presents significant opportunities. The increasing demand for measurable advertising outcomes also creates demand for more sophisticated analytics and reporting tools.
Leading Players in the Ad Tech Market Market
Key Developments in Ad Tech Market Industry
- September 2023: Google launched Video View Campaigns (VVC), leveraging AI to optimize video ad delivery for increased views and brand consideration.
- October 2023: Amazon Ads introduced beta image generation, an AI-powered tool enabling brands to create lifestyle imagery for improved ad performance.
Strategic Outlook for Ad Tech Market Market
The Ad Tech market is poised for continued growth, driven by the ongoing digital transformation across various industries and the increasing adoption of advanced advertising technologies. Future market potential lies in the development of AI-powered solutions, the expansion of programmatic advertising into new markets, and the addressing of growing consumer concerns around data privacy and transparency. The market will continue to evolve dynamically, with innovation playing a crucial role in shaping its future trajectory.
Ad Tech Market Segmentation
-
1. Platform
- 1.1. Supply Side Platform (SSP)
- 1.2. Demand Side Platform (DSP)
- 1.3. Ad Exchange
- 1.4. Data Management
-
2. Ad Format
- 2.1. Video Advertising
- 2.2. Social Media
- 2.3. Search Advertising
- 2.4. Email
- 2.5. Other Ad Formats
-
3. Device Platforms
- 3.1. Desktop
- 3.2. Mobile Devices and Smartphones
- 3.3. Other Device Platforms
-
4. End-user Industry
- 4.1. Retail and E-Commerce
- 4.2. Healthcare
- 4.3. BFSI
- 4.4. Services (Hospitality, Tourism, Legal Services)
- 4.5. Telecommunications
- 4.6. Other End-user Industries
Ad Tech Market Segmentation By Geography
-
1. North America
- 1.1. United States
- 1.2. Canada
-
2. Europe
- 2.1. United Kingdom
- 2.2. Germany
- 2.3. France
- 2.4. Spain
- 2.5. Italy
- 2.6. Rest of Europe
-
3. Asia Pacific
- 3.1. China
- 3.2. India
- 3.3. Japan
- 3.4. Australia
- 3.5. South Korea
- 3.6. New Zealand
- 3.7. Rest of Asia Pacific
-
4. Middle East and Africa
- 4.1. Saudi Arabia
- 4.2. United Arab Emirates
- 4.3. South Africa
- 4.4. Nigeria
- 4.5. Egypt
- 4.6. Rest of Middle East and Africa
-
5. Latin America
- 5.1. Brazil
- 5.2. Mexico
- 5.3. Argentina
- 5.4. Colombia
- 5.5. Rest of Latin America
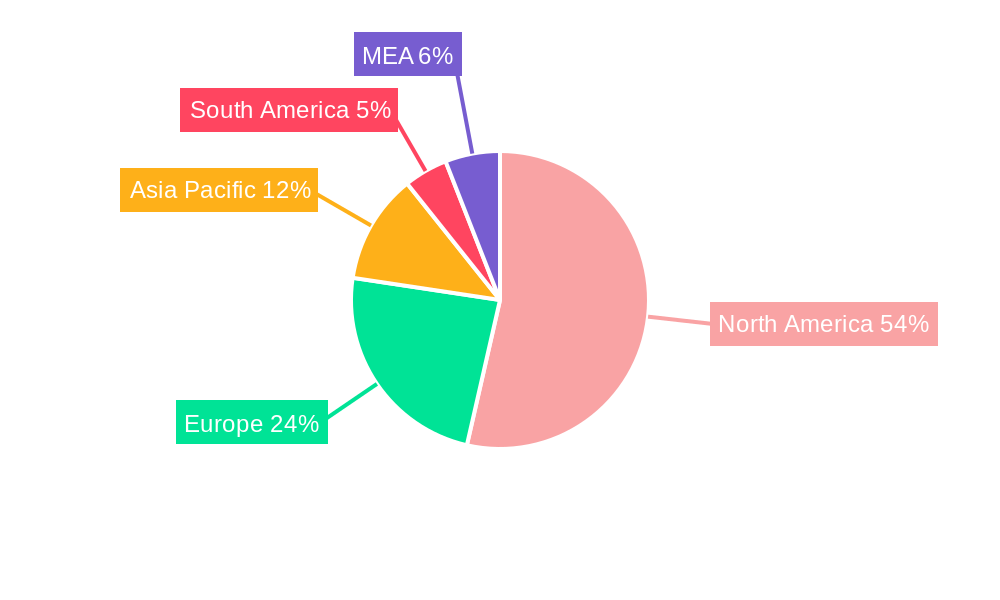
Ad Tech Market Regional Market Share
Geographic Coverage of Ad Tech Market
Ad Tech Market REPORT HIGHLIGHTS
| Aspects | Details |
|---|---|
| Study Period | 2020-2034 |
| Base Year | 2025 |
| Estimated Year | 2026 |
| Forecast Period | 2026-2034 |
| Historical Period | 2020-2025 |
| Growth Rate | CAGR of 11.54% from 2020-2034 |
| Segmentation |
|
Table of Contents
- 1. Introduction
- 1.1. Research Scope
- 1.2. Market Segmentation
- 1.3. Research Objective
- 1.4. Definitions and Assumptions
- 2. Executive Summary
- 2.1. Market Snapshot
- 3. Market Dynamics
- 3.1. Market Drivers
- 3.2. Market Restrains
- 3.3. Market Trends
- 3.4. Market Opportunities
- 4. Market Factor Analysis
- 4.1. Porters Five Forces
- 4.1.1. Bargaining Power of Suppliers
- 4.1.2. Bargaining Power of Buyers
- 4.1.3. Threat of New Entrants
- 4.1.4. Threat of Substitutes
- 4.1.5. Competitive Rivalry
- 4.2. PESTEL analysis
- 4.3. BCG Analysis
- 4.3.1. Stars (High Growth, High Market Share)
- 4.3.2. Cash Cows (Low Growth, High Market Share)
- 4.3.3. Question Mark (High Growth, Low Market Share)
- 4.3.4. Dogs (Low Growth, Low Market Share)
- 4.4. Ansoff Matrix Analysis
- 4.5. Supply Chain Analysis
- 4.6. Regulatory Landscape
- 4.7. Current Market Potential and Opportunity Assessment (TAM–SAM–SOM Framework)
- 4.8. RAX Analyst Note
- 4.1. Porters Five Forces
- 5. Market Analysis, Insights and Forecast 2021-2033
- 5.1. Market Analysis, Insights and Forecast - by Platform
- 5.1.1. Supply Side Platform (SSP)
- 5.1.2. Demand Side Platform (DSP)
- 5.1.3. Ad Exchange
- 5.1.4. Data Management
- 5.2. Market Analysis, Insights and Forecast - by Ad Format
- 5.2.1. Video Advertising
- 5.2.2. Social Media
- 5.2.3. Search Advertising
- 5.2.4. Email
- 5.2.5. Other Ad Formats
- 5.3. Market Analysis, Insights and Forecast - by Device Platforms
- 5.3.1. Desktop
- 5.3.2. Mobile Devices and Smartphones
- 5.3.3. Other Device Platforms
- 5.4. Market Analysis, Insights and Forecast - by End-user Industry
- 5.4.1. Retail and E-Commerce
- 5.4.2. Healthcare
- 5.4.3. BFSI
- 5.4.4. Services (Hospitality, Tourism, Legal Services)
- 5.4.5. Telecommunications
- 5.4.6. Other End-user Industries
- 5.5. Market Analysis, Insights and Forecast - by Region
- 5.5.1. North America
- 5.5.2. Europe
- 5.5.3. Asia Pacific
- 5.5.4. Middle East and Africa
- 5.5.5. Latin America
- 5.1. Market Analysis, Insights and Forecast - by Platform
- 6. Global Ad Tech Market Analysis, Insights and Forecast, 2021-2033
- 6.1. Market Analysis, Insights and Forecast - by Platform
- 6.1.1. Supply Side Platform (SSP)
- 6.1.2. Demand Side Platform (DSP)
- 6.1.3. Ad Exchange
- 6.1.4. Data Management
- 6.2. Market Analysis, Insights and Forecast - by Ad Format
- 6.2.1. Video Advertising
- 6.2.2. Social Media
- 6.2.3. Search Advertising
- 6.2.4. Email
- 6.2.5. Other Ad Formats
- 6.3. Market Analysis, Insights and Forecast - by Device Platforms
- 6.3.1. Desktop
- 6.3.2. Mobile Devices and Smartphones
- 6.3.3. Other Device Platforms
- 6.4. Market Analysis, Insights and Forecast - by End-user Industry
- 6.4.1. Retail and E-Commerce
- 6.4.2. Healthcare
- 6.4.3. BFSI
- 6.4.4. Services (Hospitality, Tourism, Legal Services)
- 6.4.5. Telecommunications
- 6.4.6. Other End-user Industries
- 6.1. Market Analysis, Insights and Forecast - by Platform
- 7. North America Ad Tech Market Analysis, Insights and Forecast, 2020-2032
- 7.1. Market Analysis, Insights and Forecast - by Platform
- 7.1.1. Supply Side Platform (SSP)
- 7.1.2. Demand Side Platform (DSP)
- 7.1.3. Ad Exchange
- 7.1.4. Data Management
- 7.2. Market Analysis, Insights and Forecast - by Ad Format
- 7.2.1. Video Advertising
- 7.2.2. Social Media
- 7.2.3. Search Advertising
- 7.2.4. Email
- 7.2.5. Other Ad Formats
- 7.3. Market Analysis, Insights and Forecast - by Device Platforms
- 7.3.1. Desktop
- 7.3.2. Mobile Devices and Smartphones
- 7.3.3. Other Device Platforms
- 7.4. Market Analysis, Insights and Forecast - by End-user Industry
- 7.4.1. Retail and E-Commerce
- 7.4.2. Healthcare
- 7.4.3. BFSI
- 7.4.4. Services (Hospitality, Tourism, Legal Services)
- 7.4.5. Telecommunications
- 7.4.6. Other End-user Industries
- 7.1. Market Analysis, Insights and Forecast - by Platform
- 8. Europe Ad Tech Market Analysis, Insights and Forecast, 2020-2032
- 8.1. Market Analysis, Insights and Forecast - by Platform
- 8.1.1. Supply Side Platform (SSP)
- 8.1.2. Demand Side Platform (DSP)
- 8.1.3. Ad Exchange
- 8.1.4. Data Management
- 8.2. Market Analysis, Insights and Forecast - by Ad Format
- 8.2.1. Video Advertising
- 8.2.2. Social Media
- 8.2.3. Search Advertising
- 8.2.4. Email
- 8.2.5. Other Ad Formats
- 8.3. Market Analysis, Insights and Forecast - by Device Platforms
- 8.3.1. Desktop
- 8.3.2. Mobile Devices and Smartphones
- 8.3.3. Other Device Platforms
- 8.4. Market Analysis, Insights and Forecast - by End-user Industry
- 8.4.1. Retail and E-Commerce
- 8.4.2. Healthcare
- 8.4.3. BFSI
- 8.4.4. Services (Hospitality, Tourism, Legal Services)
- 8.4.5. Telecommunications
- 8.4.6. Other End-user Industries
- 8.1. Market Analysis, Insights and Forecast - by Platform
- 9. Asia Pacific Ad Tech Market Analysis, Insights and Forecast, 2020-2032
- 9.1. Market Analysis, Insights and Forecast - by Platform
- 9.1.1. Supply Side Platform (SSP)
- 9.1.2. Demand Side Platform (DSP)
- 9.1.3. Ad Exchange
- 9.1.4. Data Management
- 9.2. Market Analysis, Insights and Forecast - by Ad Format
- 9.2.1. Video Advertising
- 9.2.2. Social Media
- 9.2.3. Search Advertising
- 9.2.4. Email
- 9.2.5. Other Ad Formats
- 9.3. Market Analysis, Insights and Forecast - by Device Platforms
- 9.3.1. Desktop
- 9.3.2. Mobile Devices and Smartphones
- 9.3.3. Other Device Platforms
- 9.4. Market Analysis, Insights and Forecast - by End-user Industry
- 9.4.1. Retail and E-Commerce
- 9.4.2. Healthcare
- 9.4.3. BFSI
- 9.4.4. Services (Hospitality, Tourism, Legal Services)
- 9.4.5. Telecommunications
- 9.4.6. Other End-user Industries
- 9.1. Market Analysis, Insights and Forecast - by Platform
- 10. Middle East and Africa Ad Tech Market Analysis, Insights and Forecast, 2020-2032
- 10.1. Market Analysis, Insights and Forecast - by Platform
- 10.1.1. Supply Side Platform (SSP)
- 10.1.2. Demand Side Platform (DSP)
- 10.1.3. Ad Exchange
- 10.1.4. Data Management
- 10.2. Market Analysis, Insights and Forecast - by Ad Format
- 10.2.1. Video Advertising
- 10.2.2. Social Media
- 10.2.3. Search Advertising
- 10.2.4. Email
- 10.2.5. Other Ad Formats
- 10.3. Market Analysis, Insights and Forecast - by Device Platforms
- 10.3.1. Desktop
- 10.3.2. Mobile Devices and Smartphones
- 10.3.3. Other Device Platforms
- 10.4. Market Analysis, Insights and Forecast - by End-user Industry
- 10.4.1. Retail and E-Commerce
- 10.4.2. Healthcare
- 10.4.3. BFSI
- 10.4.4. Services (Hospitality, Tourism, Legal Services)
- 10.4.5. Telecommunications
- 10.4.6. Other End-user Industries
- 10.1. Market Analysis, Insights and Forecast - by Platform
- 11. Latin America Ad Tech Market Analysis, Insights and Forecast, 2020-2032
- 11.1. Market Analysis, Insights and Forecast - by Platform
- 11.1.1. Supply Side Platform (SSP)
- 11.1.2. Demand Side Platform (DSP)
- 11.1.3. Ad Exchange
- 11.1.4. Data Management
- 11.2. Market Analysis, Insights and Forecast - by Ad Format
- 11.2.1. Video Advertising
- 11.2.2. Social Media
- 11.2.3. Search Advertising
- 11.2.4. Email
- 11.2.5. Other Ad Formats
- 11.3. Market Analysis, Insights and Forecast - by Device Platforms
- 11.3.1. Desktop
- 11.3.2. Mobile Devices and Smartphones
- 11.3.3. Other Device Platforms
- 11.4. Market Analysis, Insights and Forecast - by End-user Industry
- 11.4.1. Retail and E-Commerce
- 11.4.2. Healthcare
- 11.4.3. BFSI
- 11.4.4. Services (Hospitality, Tourism, Legal Services)
- 11.4.5. Telecommunications
- 11.4.6. Other End-user Industries
- 11.1. Market Analysis, Insights and Forecast - by Platform
- 12. Competitive Analysis
- 12.1. Company Profiles
- 12.1.1 MediaMath
- 12.1.1.1. Company Overview
- 12.1.1.2. Products
- 12.1.1.3. Company Financials
- 12.1.1.4. SWOT Analysis
- 12.1.2 Quantcast
- 12.1.2.1. Company Overview
- 12.1.2.2. Products
- 12.1.2.3. Company Financials
- 12.1.2.4. SWOT Analysis
- 12.1.3 Google LLC
- 12.1.3.1. Company Overview
- 12.1.3.2. Products
- 12.1.3.3. Company Financials
- 12.1.3.4. SWOT Analysis
- 12.1.4 Mediaocean
- 12.1.4.1. Company Overview
- 12.1.4.2. Products
- 12.1.4.3. Company Financials
- 12.1.4.4. SWOT Analysis
- 12.1.5 Zeta Global Holdings Corp
- 12.1.5.1. Company Overview
- 12.1.5.2. Products
- 12.1.5.3. Company Financials
- 12.1.5.4. SWOT Analysis
- 12.1.6 Adobe
- 12.1.6.1. Company Overview
- 12.1.6.2. Products
- 12.1.6.3. Company Financials
- 12.1.6.4. SWOT Analysis
- 12.1.7 Microsoft Corporation
- 12.1.7.1. Company Overview
- 12.1.7.2. Products
- 12.1.7.3. Company Financials
- 12.1.7.4. SWOT Analysis
- 12.1.8 Amazon com Inc
- 12.1.8.1. Company Overview
- 12.1.8.2. Products
- 12.1.8.3. Company Financials
- 12.1.8.4. SWOT Analysis
- 12.1.9 Meta Platform Inc
- 12.1.9.1. Company Overview
- 12.1.9.2. Products
- 12.1.9.3. Company Financials
- 12.1.9.4. SWOT Analysis
- 12.1.10 Adform A/S
- 12.1.10.1. Company Overview
- 12.1.10.2. Products
- 12.1.10.3. Company Financials
- 12.1.10.4. SWOT Analysis
- 12.1.1 MediaMath
- 12.2. Market Entropy
- 12.2.1 Company's Key Areas Served
- 12.2.2 Recent Developments
- 12.3. Company Market Share Analysis 2025
- 12.3.1 Top 5 Companies Market Share Analysis
- 12.3.2 Top 3 Companies Market Share Analysis
- 12.4. List of Potential Customers
- 13. Research Methodology
List of Figures
- Figure 1: Global Ad Tech Market Revenue Breakdown (Million, %) by Region 2025 & 2033
- Figure 2: Global Ad Tech Market Volume Breakdown (K Unit, %) by Region 2025 & 2033
- Figure 3: North America Ad Tech Market Revenue (Million), by Platform 2025 & 2033
- Figure 4: North America Ad Tech Market Volume (K Unit), by Platform 2025 & 2033
- Figure 5: North America Ad Tech Market Revenue Share (%), by Platform 2025 & 2033
- Figure 6: North America Ad Tech Market Volume Share (%), by Platform 2025 & 2033
- Figure 7: North America Ad Tech Market Revenue (Million), by Ad Format 2025 & 2033
- Figure 8: North America Ad Tech Market Volume (K Unit), by Ad Format 2025 & 2033
- Figure 9: North America Ad Tech Market Revenue Share (%), by Ad Format 2025 & 2033
- Figure 10: North America Ad Tech Market Volume Share (%), by Ad Format 2025 & 2033
- Figure 11: North America Ad Tech Market Revenue (Million), by Device Platforms 2025 & 2033
- Figure 12: North America Ad Tech Market Volume (K Unit), by Device Platforms 2025 & 2033
- Figure 13: North America Ad Tech Market Revenue Share (%), by Device Platforms 2025 & 2033
- Figure 14: North America Ad Tech Market Volume Share (%), by Device Platforms 2025 & 2033
- Figure 15: North America Ad Tech Market Revenue (Million), by End-user Industry 2025 & 2033
- Figure 16: North America Ad Tech Market Volume (K Unit), by End-user Industry 2025 & 2033
- Figure 17: North America Ad Tech Market Revenue Share (%), by End-user Industry 2025 & 2033
- Figure 18: North America Ad Tech Market Volume Share (%), by End-user Industry 2025 & 2033
- Figure 19: North America Ad Tech Market Revenue (Million), by Country 2025 & 2033
- Figure 20: North America Ad Tech Market Volume (K Unit), by Country 2025 & 2033
- Figure 21: North America Ad Tech Market Revenue Share (%), by Country 2025 & 2033
- Figure 22: North America Ad Tech Market Volume Share (%), by Country 2025 & 2033
- Figure 23: Europe Ad Tech Market Revenue (Million), by Platform 2025 & 2033
- Figure 24: Europe Ad Tech Market Volume (K Unit), by Platform 2025 & 2033
- Figure 25: Europe Ad Tech Market Revenue Share (%), by Platform 2025 & 2033
- Figure 26: Europe Ad Tech Market Volume Share (%), by Platform 2025 & 2033
- Figure 27: Europe Ad Tech Market Revenue (Million), by Ad Format 2025 & 2033
- Figure 28: Europe Ad Tech Market Volume (K Unit), by Ad Format 2025 & 2033
- Figure 29: Europe Ad Tech Market Revenue Share (%), by Ad Format 2025 & 2033
- Figure 30: Europe Ad Tech Market Volume Share (%), by Ad Format 2025 & 2033
- Figure 31: Europe Ad Tech Market Revenue (Million), by Device Platforms 2025 & 2033
- Figure 32: Europe Ad Tech Market Volume (K Unit), by Device Platforms 2025 & 2033
- Figure 33: Europe Ad Tech Market Revenue Share (%), by Device Platforms 2025 & 2033
- Figure 34: Europe Ad Tech Market Volume Share (%), by Device Platforms 2025 & 2033
- Figure 35: Europe Ad Tech Market Revenue (Million), by End-user Industry 2025 & 2033
- Figure 36: Europe Ad Tech Market Volume (K Unit), by End-user Industry 2025 & 2033
- Figure 37: Europe Ad Tech Market Revenue Share (%), by End-user Industry 2025 & 2033
- Figure 38: Europe Ad Tech Market Volume Share (%), by End-user Industry 2025 & 2033
- Figure 39: Europe Ad Tech Market Revenue (Million), by Country 2025 & 2033
- Figure 40: Europe Ad Tech Market Volume (K Unit), by Country 2025 & 2033
- Figure 41: Europe Ad Tech Market Revenue Share (%), by Country 2025 & 2033
- Figure 42: Europe Ad Tech Market Volume Share (%), by Country 2025 & 2033
- Figure 43: Asia Pacific Ad Tech Market Revenue (Million), by Platform 2025 & 2033
- Figure 44: Asia Pacific Ad Tech Market Volume (K Unit), by Platform 2025 & 2033
- Figure 45: Asia Pacific Ad Tech Market Revenue Share (%), by Platform 2025 & 2033
- Figure 46: Asia Pacific Ad Tech Market Volume Share (%), by Platform 2025 & 2033
- Figure 47: Asia Pacific Ad Tech Market Revenue (Million), by Ad Format 2025 & 2033
- Figure 48: Asia Pacific Ad Tech Market Volume (K Unit), by Ad Format 2025 & 2033
- Figure 49: Asia Pacific Ad Tech Market Revenue Share (%), by Ad Format 2025 & 2033
- Figure 50: Asia Pacific Ad Tech Market Volume Share (%), by Ad Format 2025 & 2033
- Figure 51: Asia Pacific Ad Tech Market Revenue (Million), by Device Platforms 2025 & 2033
- Figure 52: Asia Pacific Ad Tech Market Volume (K Unit), by Device Platforms 2025 & 2033
- Figure 53: Asia Pacific Ad Tech Market Revenue Share (%), by Device Platforms 2025 & 2033
- Figure 54: Asia Pacific Ad Tech Market Volume Share (%), by Device Platforms 2025 & 2033
- Figure 55: Asia Pacific Ad Tech Market Revenue (Million), by End-user Industry 2025 & 2033
- Figure 56: Asia Pacific Ad Tech Market Volume (K Unit), by End-user Industry 2025 & 2033
- Figure 57: Asia Pacific Ad Tech Market Revenue Share (%), by End-user Industry 2025 & 2033
- Figure 58: Asia Pacific Ad Tech Market Volume Share (%), by End-user Industry 2025 & 2033
- Figure 59: Asia Pacific Ad Tech Market Revenue (Million), by Country 2025 & 2033
- Figure 60: Asia Pacific Ad Tech Market Volume (K Unit), by Country 2025 & 2033
- Figure 61: Asia Pacific Ad Tech Market Revenue Share (%), by Country 2025 & 2033
- Figure 62: Asia Pacific Ad Tech Market Volume Share (%), by Country 2025 & 2033
- Figure 63: Middle East and Africa Ad Tech Market Revenue (Million), by Platform 2025 & 2033
- Figure 64: Middle East and Africa Ad Tech Market Volume (K Unit), by Platform 2025 & 2033
- Figure 65: Middle East and Africa Ad Tech Market Revenue Share (%), by Platform 2025 & 2033
- Figure 66: Middle East and Africa Ad Tech Market Volume Share (%), by Platform 2025 & 2033
- Figure 67: Middle East and Africa Ad Tech Market Revenue (Million), by Ad Format 2025 & 2033
- Figure 68: Middle East and Africa Ad Tech Market Volume (K Unit), by Ad Format 2025 & 2033
- Figure 69: Middle East and Africa Ad Tech Market Revenue Share (%), by Ad Format 2025 & 2033
- Figure 70: Middle East and Africa Ad Tech Market Volume Share (%), by Ad Format 2025 & 2033
- Figure 71: Middle East and Africa Ad Tech Market Revenue (Million), by Device Platforms 2025 & 2033
- Figure 72: Middle East and Africa Ad Tech Market Volume (K Unit), by Device Platforms 2025 & 2033
- Figure 73: Middle East and Africa Ad Tech Market Revenue Share (%), by Device Platforms 2025 & 2033
- Figure 74: Middle East and Africa Ad Tech Market Volume Share (%), by Device Platforms 2025 & 2033
- Figure 75: Middle East and Africa Ad Tech Market Revenue (Million), by End-user Industry 2025 & 2033
- Figure 76: Middle East and Africa Ad Tech Market Volume (K Unit), by End-user Industry 2025 & 2033
- Figure 77: Middle East and Africa Ad Tech Market Revenue Share (%), by End-user Industry 2025 & 2033
- Figure 78: Middle East and Africa Ad Tech Market Volume Share (%), by End-user Industry 2025 & 2033
- Figure 79: Middle East and Africa Ad Tech Market Revenue (Million), by Country 2025 & 2033
- Figure 80: Middle East and Africa Ad Tech Market Volume (K Unit), by Country 2025 & 2033
- Figure 81: Middle East and Africa Ad Tech Market Revenue Share (%), by Country 2025 & 2033
- Figure 82: Middle East and Africa Ad Tech Market Volume Share (%), by Country 2025 & 2033
- Figure 83: Latin America Ad Tech Market Revenue (Million), by Platform 2025 & 2033
- Figure 84: Latin America Ad Tech Market Volume (K Unit), by Platform 2025 & 2033
- Figure 85: Latin America Ad Tech Market Revenue Share (%), by Platform 2025 & 2033
- Figure 86: Latin America Ad Tech Market Volume Share (%), by Platform 2025 & 2033
- Figure 87: Latin America Ad Tech Market Revenue (Million), by Ad Format 2025 & 2033
- Figure 88: Latin America Ad Tech Market Volume (K Unit), by Ad Format 2025 & 2033
- Figure 89: Latin America Ad Tech Market Revenue Share (%), by Ad Format 2025 & 2033
- Figure 90: Latin America Ad Tech Market Volume Share (%), by Ad Format 2025 & 2033
- Figure 91: Latin America Ad Tech Market Revenue (Million), by Device Platforms 2025 & 2033
- Figure 92: Latin America Ad Tech Market Volume (K Unit), by Device Platforms 2025 & 2033
- Figure 93: Latin America Ad Tech Market Revenue Share (%), by Device Platforms 2025 & 2033
- Figure 94: Latin America Ad Tech Market Volume Share (%), by Device Platforms 2025 & 2033
- Figure 95: Latin America Ad Tech Market Revenue (Million), by End-user Industry 2025 & 2033
- Figure 96: Latin America Ad Tech Market Volume (K Unit), by End-user Industry 2025 & 2033
- Figure 97: Latin America Ad Tech Market Revenue Share (%), by End-user Industry 2025 & 2033
- Figure 98: Latin America Ad Tech Market Volume Share (%), by End-user Industry 2025 & 2033
- Figure 99: Latin America Ad Tech Market Revenue (Million), by Country 2025 & 2033
- Figure 100: Latin America Ad Tech Market Volume (K Unit), by Country 2025 & 2033
- Figure 101: Latin America Ad Tech Market Revenue Share (%), by Country 2025 & 2033
- Figure 102: Latin America Ad Tech Market Volume Share (%), by Country 2025 & 2033
List of Tables
- Table 1: Global Ad Tech Market Revenue Million Forecast, by Platform 2020 & 2033
- Table 2: Global Ad Tech Market Volume K Unit Forecast, by Platform 2020 & 2033
- Table 3: Global Ad Tech Market Revenue Million Forecast, by Ad Format 2020 & 2033
- Table 4: Global Ad Tech Market Volume K Unit Forecast, by Ad Format 2020 & 2033
- Table 5: Global Ad Tech Market Revenue Million Forecast, by Device Platforms 2020 & 2033
- Table 6: Global Ad Tech Market Volume K Unit Forecast, by Device Platforms 2020 & 2033
- Table 7: Global Ad Tech Market Revenue Million Forecast, by End-user Industry 2020 & 2033
- Table 8: Global Ad Tech Market Volume K Unit Forecast, by End-user Industry 2020 & 2033
- Table 9: Global Ad Tech Market Revenue Million Forecast, by Region 2020 & 2033
- Table 10: Global Ad Tech Market Volume K Unit Forecast, by Region 2020 & 2033
- Table 11: Global Ad Tech Market Revenue Million Forecast, by Platform 2020 & 2033
- Table 12: Global Ad Tech Market Volume K Unit Forecast, by Platform 2020 & 2033
- Table 13: Global Ad Tech Market Revenue Million Forecast, by Ad Format 2020 & 2033
- Table 14: Global Ad Tech Market Volume K Unit Forecast, by Ad Format 2020 & 2033
- Table 15: Global Ad Tech Market Revenue Million Forecast, by Device Platforms 2020 & 2033
- Table 16: Global Ad Tech Market Volume K Unit Forecast, by Device Platforms 2020 & 2033
- Table 17: Global Ad Tech Market Revenue Million Forecast, by End-user Industry 2020 & 2033
- Table 18: Global Ad Tech Market Volume K Unit Forecast, by End-user Industry 2020 & 2033
- Table 19: Global Ad Tech Market Revenue Million Forecast, by Country 2020 & 2033
- Table 20: Global Ad Tech Market Volume K Unit Forecast, by Country 2020 & 2033
- Table 21: United States Ad Tech Market Revenue (Million) Forecast, by Application 2020 & 2033
- Table 22: United States Ad Tech Market Volume (K Unit) Forecast, by Application 2020 & 2033
- Table 23: Canada Ad Tech Market Revenue (Million) Forecast, by Application 2020 & 2033
- Table 24: Canada Ad Tech Market Volume (K Unit) Forecast, by Application 2020 & 2033
- Table 25: Global Ad Tech Market Revenue Million Forecast, by Platform 2020 & 2033
- Table 26: Global Ad Tech Market Volume K Unit Forecast, by Platform 2020 & 2033
- Table 27: Global Ad Tech Market Revenue Million Forecast, by Ad Format 2020 & 2033
- Table 28: Global Ad Tech Market Volume K Unit Forecast, by Ad Format 2020 & 2033
- Table 29: Global Ad Tech Market Revenue Million Forecast, by Device Platforms 2020 & 2033
- Table 30: Global Ad Tech Market Volume K Unit Forecast, by Device Platforms 2020 & 2033
- Table 31: Global Ad Tech Market Revenue Million Forecast, by End-user Industry 2020 & 2033
- Table 32: Global Ad Tech Market Volume K Unit Forecast, by End-user Industry 2020 & 2033
- Table 33: Global Ad Tech Market Revenue Million Forecast, by Country 2020 & 2033
- Table 34: Global Ad Tech Market Volume K Unit Forecast, by Country 2020 & 2033
- Table 35: United Kingdom Ad Tech Market Revenue (Million) Forecast, by Application 2020 & 2033
- Table 36: United Kingdom Ad Tech Market Volume (K Unit) Forecast, by Application 2020 & 2033
- Table 37: Germany Ad Tech Market Revenue (Million) Forecast, by Application 2020 & 2033
- Table 38: Germany Ad Tech Market Volume (K Unit) Forecast, by Application 2020 & 2033
- Table 39: France Ad Tech Market Revenue (Million) Forecast, by Application 2020 & 2033
- Table 40: France Ad Tech Market Volume (K Unit) Forecast, by Application 2020 & 2033
- Table 41: Spain Ad Tech Market Revenue (Million) Forecast, by Application 2020 & 2033
- Table 42: Spain Ad Tech Market Volume (K Unit) Forecast, by Application 2020 & 2033
- Table 43: Italy Ad Tech Market Revenue (Million) Forecast, by Application 2020 & 2033
- Table 44: Italy Ad Tech Market Volume (K Unit) Forecast, by Application 2020 & 2033
- Table 45: Rest of Europe Ad Tech Market Revenue (Million) Forecast, by Application 2020 & 2033
- Table 46: Rest of Europe Ad Tech Market Volume (K Unit) Forecast, by Application 2020 & 2033
- Table 47: Global Ad Tech Market Revenue Million Forecast, by Platform 2020 & 2033
- Table 48: Global Ad Tech Market Volume K Unit Forecast, by Platform 2020 & 2033
- Table 49: Global Ad Tech Market Revenue Million Forecast, by Ad Format 2020 & 2033
- Table 50: Global Ad Tech Market Volume K Unit Forecast, by Ad Format 2020 & 2033
- Table 51: Global Ad Tech Market Revenue Million Forecast, by Device Platforms 2020 & 2033
- Table 52: Global Ad Tech Market Volume K Unit Forecast, by Device Platforms 2020 & 2033
- Table 53: Global Ad Tech Market Revenue Million Forecast, by End-user Industry 2020 & 2033
- Table 54: Global Ad Tech Market Volume K Unit Forecast, by End-user Industry 2020 & 2033
- Table 55: Global Ad Tech Market Revenue Million Forecast, by Country 2020 & 2033
- Table 56: Global Ad Tech Market Volume K Unit Forecast, by Country 2020 & 2033
- Table 57: China Ad Tech Market Revenue (Million) Forecast, by Application 2020 & 2033
- Table 58: China Ad Tech Market Volume (K Unit) Forecast, by Application 2020 & 2033
- Table 59: India Ad Tech Market Revenue (Million) Forecast, by Application 2020 & 2033
- Table 60: India Ad Tech Market Volume (K Unit) Forecast, by Application 2020 & 2033
- Table 61: Japan Ad Tech Market Revenue (Million) Forecast, by Application 2020 & 2033
- Table 62: Japan Ad Tech Market Volume (K Unit) Forecast, by Application 2020 & 2033
- Table 63: Australia Ad Tech Market Revenue (Million) Forecast, by Application 2020 & 2033
- Table 64: Australia Ad Tech Market Volume (K Unit) Forecast, by Application 2020 & 2033
- Table 65: South Korea Ad Tech Market Revenue (Million) Forecast, by Application 2020 & 2033
- Table 66: South Korea Ad Tech Market Volume (K Unit) Forecast, by Application 2020 & 2033
- Table 67: New Zealand Ad Tech Market Revenue (Million) Forecast, by Application 2020 & 2033
- Table 68: New Zealand Ad Tech Market Volume (K Unit) Forecast, by Application 2020 & 2033
- Table 69: Rest of Asia Pacific Ad Tech Market Revenue (Million) Forecast, by Application 2020 & 2033
- Table 70: Rest of Asia Pacific Ad Tech Market Volume (K Unit) Forecast, by Application 2020 & 2033
- Table 71: Global Ad Tech Market Revenue Million Forecast, by Platform 2020 & 2033
- Table 72: Global Ad Tech Market Volume K Unit Forecast, by Platform 2020 & 2033
- Table 73: Global Ad Tech Market Revenue Million Forecast, by Ad Format 2020 & 2033
- Table 74: Global Ad Tech Market Volume K Unit Forecast, by Ad Format 2020 & 2033
- Table 75: Global Ad Tech Market Revenue Million Forecast, by Device Platforms 2020 & 2033
- Table 76: Global Ad Tech Market Volume K Unit Forecast, by Device Platforms 2020 & 2033
- Table 77: Global Ad Tech Market Revenue Million Forecast, by End-user Industry 2020 & 2033
- Table 78: Global Ad Tech Market Volume K Unit Forecast, by End-user Industry 2020 & 2033
- Table 79: Global Ad Tech Market Revenue Million Forecast, by Country 2020 & 2033
- Table 80: Global Ad Tech Market Volume K Unit Forecast, by Country 2020 & 2033
- Table 81: Saudi Arabia Ad Tech Market Revenue (Million) Forecast, by Application 2020 & 2033
- Table 82: Saudi Arabia Ad Tech Market Volume (K Unit) Forecast, by Application 2020 & 2033
- Table 83: United Arab Emirates Ad Tech Market Revenue (Million) Forecast, by Application 2020 & 2033
- Table 84: United Arab Emirates Ad Tech Market Volume (K Unit) Forecast, by Application 2020 & 2033
- Table 85: South Africa Ad Tech Market Revenue (Million) Forecast, by Application 2020 & 2033
- Table 86: South Africa Ad Tech Market Volume (K Unit) Forecast, by Application 2020 & 2033
- Table 87: Nigeria Ad Tech Market Revenue (Million) Forecast, by Application 2020 & 2033
- Table 88: Nigeria Ad Tech Market Volume (K Unit) Forecast, by Application 2020 & 2033
- Table 89: Egypt Ad Tech Market Revenue (Million) Forecast, by Application 2020 & 2033
- Table 90: Egypt Ad Tech Market Volume (K Unit) Forecast, by Application 2020 & 2033
- Table 91: Rest of Middle East and Africa Ad Tech Market Revenue (Million) Forecast, by Application 2020 & 2033
- Table 92: Rest of Middle East and Africa Ad Tech Market Volume (K Unit) Forecast, by Application 2020 & 2033
- Table 93: Global Ad Tech Market Revenue Million Forecast, by Platform 2020 & 2033
- Table 94: Global Ad Tech Market Volume K Unit Forecast, by Platform 2020 & 2033
- Table 95: Global Ad Tech Market Revenue Million Forecast, by Ad Format 2020 & 2033
- Table 96: Global Ad Tech Market Volume K Unit Forecast, by Ad Format 2020 & 2033
- Table 97: Global Ad Tech Market Revenue Million Forecast, by Device Platforms 2020 & 2033
- Table 98: Global Ad Tech Market Volume K Unit Forecast, by Device Platforms 2020 & 2033
- Table 99: Global Ad Tech Market Revenue Million Forecast, by End-user Industry 2020 & 2033
- Table 100: Global Ad Tech Market Volume K Unit Forecast, by End-user Industry 2020 & 2033
- Table 101: Global Ad Tech Market Revenue Million Forecast, by Country 2020 & 2033
- Table 102: Global Ad Tech Market Volume K Unit Forecast, by Country 2020 & 2033
- Table 103: Brazil Ad Tech Market Revenue (Million) Forecast, by Application 2020 & 2033
- Table 104: Brazil Ad Tech Market Volume (K Unit) Forecast, by Application 2020 & 2033
- Table 105: Mexico Ad Tech Market Revenue (Million) Forecast, by Application 2020 & 2033
- Table 106: Mexico Ad Tech Market Volume (K Unit) Forecast, by Application 2020 & 2033
- Table 107: Argentina Ad Tech Market Revenue (Million) Forecast, by Application 2020 & 2033
- Table 108: Argentina Ad Tech Market Volume (K Unit) Forecast, by Application 2020 & 2033
- Table 109: Colombia Ad Tech Market Revenue (Million) Forecast, by Application 2020 & 2033
- Table 110: Colombia Ad Tech Market Volume (K Unit) Forecast, by Application 2020 & 2033
- Table 111: Rest of Latin America Ad Tech Market Revenue (Million) Forecast, by Application 2020 & 2033
- Table 112: Rest of Latin America Ad Tech Market Volume (K Unit) Forecast, by Application 2020 & 2033
Frequently Asked Questions
1. What is the projected Compound Annual Growth Rate (CAGR) of the Ad Tech Market?
The projected CAGR is approximately 11.54%.
2. Which companies are prominent players in the Ad Tech Market?
Key companies in the market include MediaMath, Quantcast, Google LLC, Mediaocean, Zeta Global Holdings Corp, Adobe, Microsoft Corporation, Amazon com Inc, Meta Platform Inc, Adform A/S.
3. What are the main segments of the Ad Tech Market?
The market segments include Platform, Ad Format, Device Platforms, End-user Industry.
4. Can you provide details about the market size?
The market size is estimated to be USD 0.79 Million as of 2022.
5. What are some drivers contributing to market growth?
Rise in the Adoption of Smartphones and Social Media; High Precision. Effectiveness. and Cost Efficiency of Digital Advertising.
6. What are the notable trends driving market growth?
Mobile Devices and Smartphones to Witness Significant Growth.
7. Are there any restraints impacting market growth?
High Dependence on External Sources to Balance the Skill Deficit; Vendor Lock In; Compliance Issues. Migration Complexity. And Security Risks.
8. Can you provide examples of recent developments in the market?
October 2023 - Amazon Ads launched image generation in beta, a generative AI solution designed to remove creative barriers and enable brands to produce lifestyle imagery that helps improve their ads’ performance. This solution is helpful for advertisers of all sizes, allowing those that do not have in-house capabilities or agency support to more easily create brand-themed imagery,
9. What pricing options are available for accessing the report?
Pricing options include single-user, multi-user, and enterprise licenses priced at USD 4750, USD 5250, and USD 8750 respectively.
10. Is the market size provided in terms of value or volume?
The market size is provided in terms of value, measured in Million and volume, measured in K Unit.
11. Are there any specific market keywords associated with the report?
Yes, the market keyword associated with the report is "Ad Tech Market," which aids in identifying and referencing the specific market segment covered.
12. How do I determine which pricing option suits my needs best?
The pricing options vary based on user requirements and access needs. Individual users may opt for single-user licenses, while businesses requiring broader access may choose multi-user or enterprise licenses for cost-effective access to the report.
13. Are there any additional resources or data provided in the Ad Tech Market report?
While the report offers comprehensive insights, it's advisable to review the specific contents or supplementary materials provided to ascertain if additional resources or data are available.
14. How can I stay updated on further developments or reports in the Ad Tech Market?
To stay informed about further developments, trends, and reports in the Ad Tech Market, consider subscribing to industry newsletters, following relevant companies and organizations, or regularly checking reputable industry news sources and publications.
Methodology
Step 1 - Identification of Relevant Samples Size from Population Database


Step 2 - Approaches for Defining Global Market Size (Value, Volume* & Price*)

Note*: In applicable scenarios
Step 3 - Data Sources
Primary Research
- Web Analytics
- Survey Reports
- Research Institute
- Latest Research Reports
- Opinion Leaders
Secondary Research
- Annual Reports
- White Paper
- Latest Press Release
- Industry Association
- Paid Database
- Investor Presentations

Step 4 - Data Triangulation
Involves using different sources of information in order to increase the validity of a study
These sources are likely to be stakeholders in a program - participants, other researchers, program staff, other community members, and so on.
Then we put all data in single framework & apply various statistical tools to find out the dynamic on the market.
During the analysis stage, feedback from the stakeholder groups would be compared to determine areas of agreement as well as areas of divergence