
Key Insights
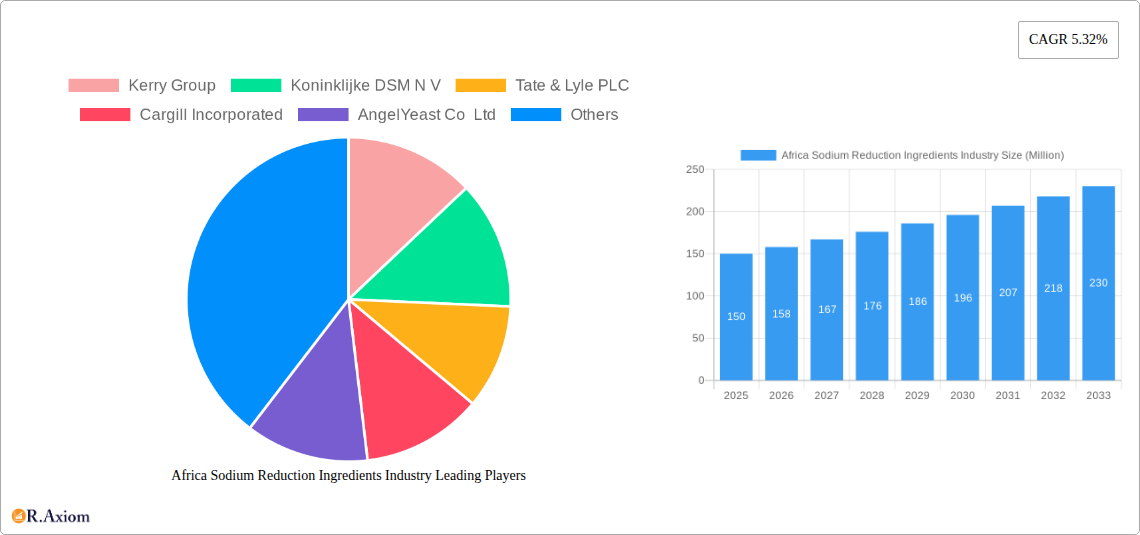
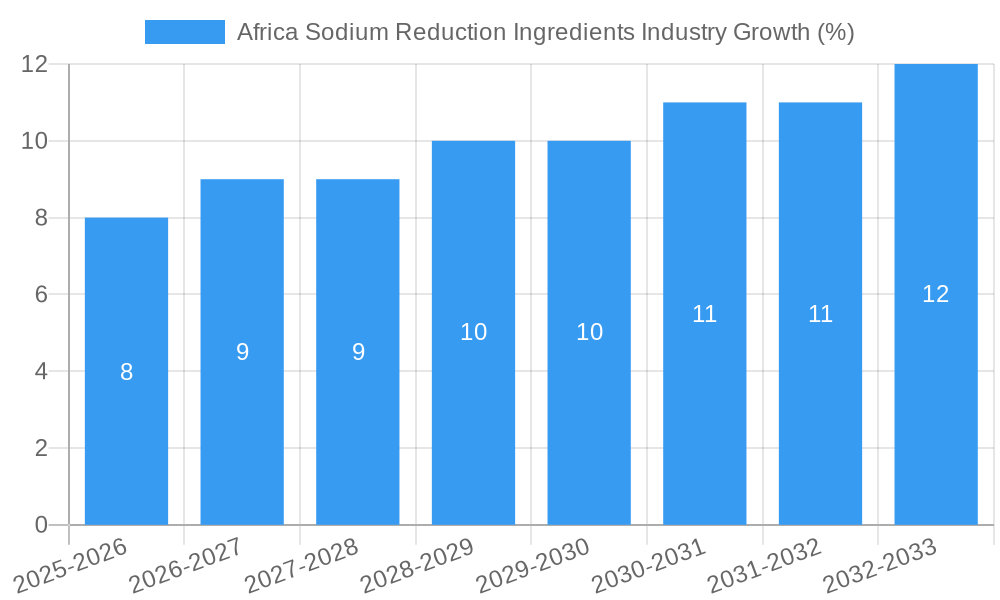
The Africa Sodium Reduction Ingredients market, valued at approximately $150 million in 2025, is projected to experience robust growth, driven by increasing health consciousness among consumers and escalating government regulations aimed at curbing sodium intake. A compound annual growth rate (CAGR) of 5.32% from 2025 to 2033 indicates a significant market expansion, reaching an estimated $250 million by 2033. Key drivers include rising prevalence of hypertension and cardiovascular diseases across Africa, coupled with growing awareness regarding the link between high sodium consumption and these health issues. Furthermore, the burgeoning food processing industry in the region is fueling demand for sodium reduction ingredients as manufacturers seek healthier product formulations to meet evolving consumer preferences. Major players like Kerry Group, DSM, Tate & Lyle, Cargill, Angel Yeast, and Givaudan are actively involved, offering a diverse range of solutions, including salt substitutes, flavor enhancers, and other functional ingredients. While challenges such as fluctuating raw material prices and varying levels of consumer awareness across different African nations exist, the overall outlook remains optimistic due to the increasing emphasis on preventative healthcare and healthier lifestyles.
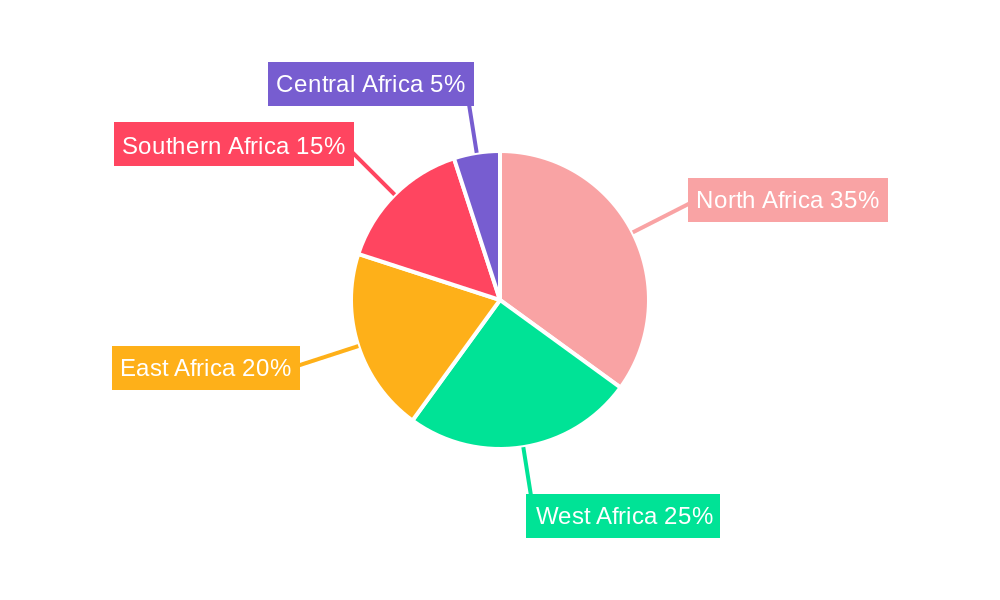
The market segmentation reveals a dynamic landscape, with significant opportunities in both the food and beverage sectors. Demand is expected to be particularly strong in rapidly urbanizing areas, where consumer access to processed foods is higher. Regional variations in market penetration are anticipated, with countries implementing stricter sodium reduction policies likely to witness faster growth. The continued investment in research and development by leading companies, focusing on innovative and effective sodium reduction solutions, is poised to shape the market's trajectory. The focus will increasingly be on solutions that maintain palatability while reducing sodium content, addressing a key consumer concern. The long-term growth trajectory hinges on the successful adoption of these advanced technologies and continued collaboration between industry stakeholders, policymakers, and public health organizations.
This comprehensive report provides an in-depth analysis of the Africa Sodium Reduction Ingredients industry, offering valuable insights for stakeholders seeking to understand market dynamics, growth opportunities, and competitive landscapes. The study period covers 2019-2033, with 2025 as the base and estimated year. The forecast period spans 2025-2033, and the historical period encompasses 2019-2024.
Africa Sodium Reduction Ingredients Industry Market Concentration & Innovation
This section analyzes the market concentration, innovation drivers, regulatory frameworks, product substitutes, end-user trends, and mergers & acquisitions (M&A) activities within the African sodium reduction ingredients market. The market is characterized by a moderately concentrated structure, with key players such as Kerry Group, Koninklijke DSM N.V., Tate & Lyle PLC, Cargill Incorporated, Angel Yeast Co Ltd, and Givaudan holding significant market share. However, the presence of numerous smaller regional players prevents a highly concentrated oligopoly.
- Market Share: Kerry Group and DSM hold approximately xx% and xx% of the market share, respectively (2025 estimates). Other players contribute to the remaining share.
- Innovation Drivers: Growing consumer awareness of health concerns related to high sodium intake, stringent government regulations promoting sodium reduction, and the rise of functional food and beverage products are major innovation drivers.
- Regulatory Frameworks: The varying regulatory landscapes across African nations significantly impact market dynamics. Some countries have implemented strict sodium reduction targets, while others are still developing relevant regulations.
- Product Substitutes: Potassium chloride, natural flavor enhancers, and other salt substitutes are emerging as competitive alternatives to traditional sodium-based ingredients. Their market penetration is currently estimated at xx% in 2025 and is projected to increase significantly.
- End-User Trends: The increasing demand for healthier processed foods, ready-to-eat meals, and convenience foods is driving the demand for sodium reduction ingredients. The shift towards healthier lifestyles is further accelerating this trend.
- M&A Activities: The market has witnessed xx M&A deals in the historical period (2019-2024), with a total estimated value of $xx Million. These activities are primarily driven by the need for companies to expand their product portfolios and market reach.
Africa Sodium Reduction Ingredients Industry Industry Trends & Insights
This section delves into the market growth drivers, technological disruptions, consumer preferences, and competitive dynamics influencing the African sodium reduction ingredients industry. The market is projected to exhibit a Compound Annual Growth Rate (CAGR) of xx% during the forecast period (2025-2033), driven primarily by increasing health consciousness, changing dietary habits, and supportive government initiatives. Market penetration of sodium reduction ingredients in processed foods is currently at xx% in 2025 and is expected to reach xx% by 2033.
The industry is witnessing a surge in the development of innovative sodium reduction technologies, including the utilization of natural flavors and masking agents. Consumer preferences are shifting towards clean label products with reduced sodium content, creating opportunities for manufacturers that can meet these demands. The competitive landscape is dynamic, with both established multinational corporations and regional players vying for market share. The competitive dynamics are further shaped by pricing strategies, product differentiation, and branding.
Dominant Markets & Segments in Africa Sodium Reduction Ingredients Industry
This section identifies the leading regions, countries, and segments within the African sodium reduction ingredients market. While data for precise market dominance is unavailable, it’s expected that South Africa, Nigeria, and Kenya, due to their larger populations and relatively developed food processing industries, will be the dominant markets.
- Key Drivers in Dominant Markets:
- South Africa: Well-established food processing sector, higher consumer awareness of health issues, and existing regulatory frameworks.
- Nigeria: Large population, burgeoning food processing industry, and increasing consumer demand for convenience foods.
- Kenya: Growing middle class, increased urbanization, and rising demand for processed foods.
Dominance analysis shows that the processed food segment is currently the largest consumer of sodium reduction ingredients, followed by the beverage industry. This is driven by the significant volume of processed foods consumed and regulatory pressure on the industry to reduce sodium levels. The economic policies supporting food processing sectors also play a significant role in regional dominance.
Africa Sodium Reduction Ingredients Industry Product Developments
Recent product innovations include the development of novel salt substitutes with improved taste profiles and functionalities. Companies are focused on creating clean-label, natural alternatives to sodium chloride, meeting increasing consumer demands for healthier ingredients. These innovations have improved the market fit by delivering better taste and texture to food products, thus overcoming a common hurdle for sodium reduction. Technological trends such as fermentation technologies are being employed to produce novel, sustainable sodium-reduction solutions.
Report Scope & Segmentation Analysis
This report segments the Africa sodium reduction ingredients market by ingredient type (e.g., potassium chloride, salt substitutes, natural flavor enhancers), application (e.g., processed foods, bakery, beverages, meat products), and region (e.g., North Africa, Sub-Saharan Africa). Growth projections vary across segments, with the processed foods segment projected to grow at a faster rate compared to others. Market sizes for each segment in 2025 and their growth estimations for the forecast period are included in the full report. Competitive dynamics differ across segments, with varying degrees of concentration and competition.
Key Drivers of Africa Sodium Reduction Ingredients Industry Growth
Key drivers include: increasing consumer health awareness leading to a demand for lower sodium options; government regulations and public health initiatives promoting sodium reduction; the rising popularity of processed and convenience foods, demanding healthier options; the expanding food processing industry in Africa; and technological advancements providing improved taste profiles in reduced sodium products.
Challenges in the Africa Sodium Reduction Ingredients Industry Sector
Challenges include: the relatively high cost of sodium reduction ingredients compared to traditional salt; inconsistent regulatory frameworks across different African countries; lack of awareness about sodium's health effects in some regions; underdeveloped supply chains leading to logistical challenges; and intense competition from established and emerging players. These challenges hinder market growth, especially in smaller countries with less developed food processing sectors.
Emerging Opportunities in Africa Sodium Reduction Ingredients Industry
Emerging opportunities include: tapping into the growing demand for clean-label, natural sodium reduction ingredients; catering to the rising popularity of functional foods and beverages; exploring new markets in underserved regions of Africa; and leveraging technological advancements to improve the taste and functionality of salt substitutes. These opportunities can provide high-growth avenues for businesses that proactively respond to these trends.
Leading Players in the Africa Sodium Reduction Ingredients Industry Market
- Kerry Group
- Koninklijke DSM N.V.
- Tate & Lyle PLC
- Cargill Incorporated
- Angel Yeast Co Ltd
- Givaudan *List Not Exhaustive
Key Developments in Africa Sodium Reduction Ingredients Industry Industry
- Jan 2023: X Company launched a new range of low-sodium seasonings.
- May 2022: Y Company invested $xx Million in expanding its production facility in [Country].
- Oct 2021: New regulations on maximum sodium content in processed foods were implemented in [Country]. (Further details of specific developments with dates and their market impact are contained within the full report.)
Strategic Outlook for Africa Sodium Reduction Ingredients Industry Market
The African sodium reduction ingredients market presents significant growth potential in the coming years. Driven by increasing health consciousness, evolving consumer preferences, and supportive government regulations, the market is poised for expansion. Companies that invest in research and development, product innovation, and effective marketing strategies will be well-positioned to capitalize on emerging opportunities. The focus on natural and clean-label ingredients will continue to shape the market, necessitating investments in sustainable and innovative solutions.
Africa Sodium Reduction Ingredients Industry Segmentation
-
1. Product Type
- 1.1. Amino Acids and Glutamates
- 1.2. Mineral Salts
- 1.3. Yeast Extracts
- 1.4. Other Product Types
-
2. Application
- 2.1. Bakery and Confectionery
- 2.2. Condiments, Seasonings and Sauces
- 2.3. Dairy and Frozen Foods
- 2.4. Meat and Meat Products
- 2.5. Snacks
- 2.6. Others
-
3. Geography
- 3.1. South Africa
- 3.2. Nigeria
- 3.3. Algeria
- 3.4. Rest of Africa
Africa Sodium Reduction Ingredients Industry Segmentation By Geography
- 1. South Africa
- 2. Nigeria
- 3. Algeria
- 4. Rest of Africa
Africa Sodium Reduction Ingredients Industry REPORT HIGHLIGHTS
| Aspects | Details |
|---|---|
| Study Period | 2019-2033 |
| Base Year | 2024 |
| Estimated Year | 2025 |
| Forecast Period | 2025-2033 |
| Historical Period | 2019-2024 |
| Growth Rate | CAGR of 5.32% from 2019-2033 |
| Segmentation |
|
Table of Contents
- 1. Introduction
- 1.1. Research Scope
- 1.2. Market Segmentation
- 1.3. Research Methodology
- 1.4. Definitions and Assumptions
- 2. Executive Summary
- 2.1. Introduction
- 3. Market Dynamics
- 3.1. Introduction
- 3.2. Market Drivers
- 3.3. Market Restrains
- 3.4. Market Trends
- 3.4.1. Increased Utilization of Mineral Salts as Sodium Reduction Ingredients
- 4. Market Factor Analysis
- 4.1. Porters Five Forces
- 4.2. Supply/Value Chain
- 4.3. PESTEL analysis
- 4.4. Market Entropy
- 4.5. Patent/Trademark Analysis
- 5. Global Africa Sodium Reduction Ingredients Industry Analysis, Insights and Forecast, 2019-2031
- 5.1. Market Analysis, Insights and Forecast - by Product Type
- 5.1.1. Amino Acids and Glutamates
- 5.1.2. Mineral Salts
- 5.1.3. Yeast Extracts
- 5.1.4. Other Product Types
- 5.2. Market Analysis, Insights and Forecast - by Application
- 5.2.1. Bakery and Confectionery
- 5.2.2. Condiments, Seasonings and Sauces
- 5.2.3. Dairy and Frozen Foods
- 5.2.4. Meat and Meat Products
- 5.2.5. Snacks
- 5.2.6. Others
- 5.3. Market Analysis, Insights and Forecast - by Geography
- 5.3.1. South Africa
- 5.3.2. Nigeria
- 5.3.3. Algeria
- 5.3.4. Rest of Africa
- 5.4. Market Analysis, Insights and Forecast - by Region
- 5.4.1. South Africa
- 5.4.2. Nigeria
- 5.4.3. Algeria
- 5.4.4. Rest of Africa
- 5.1. Market Analysis, Insights and Forecast - by Product Type
- 6. South Africa Africa Sodium Reduction Ingredients Industry Analysis, Insights and Forecast, 2019-2031
- 6.1. Market Analysis, Insights and Forecast - by Product Type
- 6.1.1. Amino Acids and Glutamates
- 6.1.2. Mineral Salts
- 6.1.3. Yeast Extracts
- 6.1.4. Other Product Types
- 6.2. Market Analysis, Insights and Forecast - by Application
- 6.2.1. Bakery and Confectionery
- 6.2.2. Condiments, Seasonings and Sauces
- 6.2.3. Dairy and Frozen Foods
- 6.2.4. Meat and Meat Products
- 6.2.5. Snacks
- 6.2.6. Others
- 6.3. Market Analysis, Insights and Forecast - by Geography
- 6.3.1. South Africa
- 6.3.2. Nigeria
- 6.3.3. Algeria
- 6.3.4. Rest of Africa
- 6.1. Market Analysis, Insights and Forecast - by Product Type
- 7. Nigeria Africa Sodium Reduction Ingredients Industry Analysis, Insights and Forecast, 2019-2031
- 7.1. Market Analysis, Insights and Forecast - by Product Type
- 7.1.1. Amino Acids and Glutamates
- 7.1.2. Mineral Salts
- 7.1.3. Yeast Extracts
- 7.1.4. Other Product Types
- 7.2. Market Analysis, Insights and Forecast - by Application
- 7.2.1. Bakery and Confectionery
- 7.2.2. Condiments, Seasonings and Sauces
- 7.2.3. Dairy and Frozen Foods
- 7.2.4. Meat and Meat Products
- 7.2.5. Snacks
- 7.2.6. Others
- 7.3. Market Analysis, Insights and Forecast - by Geography
- 7.3.1. South Africa
- 7.3.2. Nigeria
- 7.3.3. Algeria
- 7.3.4. Rest of Africa
- 7.1. Market Analysis, Insights and Forecast - by Product Type
- 8. Algeria Africa Sodium Reduction Ingredients Industry Analysis, Insights and Forecast, 2019-2031
- 8.1. Market Analysis, Insights and Forecast - by Product Type
- 8.1.1. Amino Acids and Glutamates
- 8.1.2. Mineral Salts
- 8.1.3. Yeast Extracts
- 8.1.4. Other Product Types
- 8.2. Market Analysis, Insights and Forecast - by Application
- 8.2.1. Bakery and Confectionery
- 8.2.2. Condiments, Seasonings and Sauces
- 8.2.3. Dairy and Frozen Foods
- 8.2.4. Meat and Meat Products
- 8.2.5. Snacks
- 8.2.6. Others
- 8.3. Market Analysis, Insights and Forecast - by Geography
- 8.3.1. South Africa
- 8.3.2. Nigeria
- 8.3.3. Algeria
- 8.3.4. Rest of Africa
- 8.1. Market Analysis, Insights and Forecast - by Product Type
- 9. Rest of Africa Africa Sodium Reduction Ingredients Industry Analysis, Insights and Forecast, 2019-2031
- 9.1. Market Analysis, Insights and Forecast - by Product Type
- 9.1.1. Amino Acids and Glutamates
- 9.1.2. Mineral Salts
- 9.1.3. Yeast Extracts
- 9.1.4. Other Product Types
- 9.2. Market Analysis, Insights and Forecast - by Application
- 9.2.1. Bakery and Confectionery
- 9.2.2. Condiments, Seasonings and Sauces
- 9.2.3. Dairy and Frozen Foods
- 9.2.4. Meat and Meat Products
- 9.2.5. Snacks
- 9.2.6. Others
- 9.3. Market Analysis, Insights and Forecast - by Geography
- 9.3.1. South Africa
- 9.3.2. Nigeria
- 9.3.3. Algeria
- 9.3.4. Rest of Africa
- 9.1. Market Analysis, Insights and Forecast - by Product Type
- 10. Competitive Analysis
- 10.1. Global Market Share Analysis 2024
- 10.2. Company Profiles
- 10.2.1 Kerry Group
- 10.2.1.1. Overview
- 10.2.1.2. Products
- 10.2.1.3. SWOT Analysis
- 10.2.1.4. Recent Developments
- 10.2.1.5. Financials (Based on Availability)
- 10.2.2 Koninklijke DSM N V
- 10.2.2.1. Overview
- 10.2.2.2. Products
- 10.2.2.3. SWOT Analysis
- 10.2.2.4. Recent Developments
- 10.2.2.5. Financials (Based on Availability)
- 10.2.3 Tate & Lyle PLC
- 10.2.3.1. Overview
- 10.2.3.2. Products
- 10.2.3.3. SWOT Analysis
- 10.2.3.4. Recent Developments
- 10.2.3.5. Financials (Based on Availability)
- 10.2.4 Cargill Incorporated
- 10.2.4.1. Overview
- 10.2.4.2. Products
- 10.2.4.3. SWOT Analysis
- 10.2.4.4. Recent Developments
- 10.2.4.5. Financials (Based on Availability)
- 10.2.5 AngelYeast Co Ltd
- 10.2.5.1. Overview
- 10.2.5.2. Products
- 10.2.5.3. SWOT Analysis
- 10.2.5.4. Recent Developments
- 10.2.5.5. Financials (Based on Availability)
- 10.2.6 Givaudan*List Not Exhaustive
- 10.2.6.1. Overview
- 10.2.6.2. Products
- 10.2.6.3. SWOT Analysis
- 10.2.6.4. Recent Developments
- 10.2.6.5. Financials (Based on Availability)
- 10.2.1 Kerry Group
List of Figures
- Figure 1: Global Africa Sodium Reduction Ingredients Industry Revenue Breakdown (Million, %) by Region 2024 & 2032
- Figure 2: South Africa Africa Sodium Reduction Ingredients Industry Revenue (Million), by Product Type 2024 & 2032
- Figure 3: South Africa Africa Sodium Reduction Ingredients Industry Revenue Share (%), by Product Type 2024 & 2032
- Figure 4: South Africa Africa Sodium Reduction Ingredients Industry Revenue (Million), by Application 2024 & 2032
- Figure 5: South Africa Africa Sodium Reduction Ingredients Industry Revenue Share (%), by Application 2024 & 2032
- Figure 6: South Africa Africa Sodium Reduction Ingredients Industry Revenue (Million), by Geography 2024 & 2032
- Figure 7: South Africa Africa Sodium Reduction Ingredients Industry Revenue Share (%), by Geography 2024 & 2032
- Figure 8: South Africa Africa Sodium Reduction Ingredients Industry Revenue (Million), by Country 2024 & 2032
- Figure 9: South Africa Africa Sodium Reduction Ingredients Industry Revenue Share (%), by Country 2024 & 2032
- Figure 10: Nigeria Africa Sodium Reduction Ingredients Industry Revenue (Million), by Product Type 2024 & 2032
- Figure 11: Nigeria Africa Sodium Reduction Ingredients Industry Revenue Share (%), by Product Type 2024 & 2032
- Figure 12: Nigeria Africa Sodium Reduction Ingredients Industry Revenue (Million), by Application 2024 & 2032
- Figure 13: Nigeria Africa Sodium Reduction Ingredients Industry Revenue Share (%), by Application 2024 & 2032
- Figure 14: Nigeria Africa Sodium Reduction Ingredients Industry Revenue (Million), by Geography 2024 & 2032
- Figure 15: Nigeria Africa Sodium Reduction Ingredients Industry Revenue Share (%), by Geography 2024 & 2032
- Figure 16: Nigeria Africa Sodium Reduction Ingredients Industry Revenue (Million), by Country 2024 & 2032
- Figure 17: Nigeria Africa Sodium Reduction Ingredients Industry Revenue Share (%), by Country 2024 & 2032
- Figure 18: Algeria Africa Sodium Reduction Ingredients Industry Revenue (Million), by Product Type 2024 & 2032
- Figure 19: Algeria Africa Sodium Reduction Ingredients Industry Revenue Share (%), by Product Type 2024 & 2032
- Figure 20: Algeria Africa Sodium Reduction Ingredients Industry Revenue (Million), by Application 2024 & 2032
- Figure 21: Algeria Africa Sodium Reduction Ingredients Industry Revenue Share (%), by Application 2024 & 2032
- Figure 22: Algeria Africa Sodium Reduction Ingredients Industry Revenue (Million), by Geography 2024 & 2032
- Figure 23: Algeria Africa Sodium Reduction Ingredients Industry Revenue Share (%), by Geography 2024 & 2032
- Figure 24: Algeria Africa Sodium Reduction Ingredients Industry Revenue (Million), by Country 2024 & 2032
- Figure 25: Algeria Africa Sodium Reduction Ingredients Industry Revenue Share (%), by Country 2024 & 2032
- Figure 26: Rest of Africa Africa Sodium Reduction Ingredients Industry Revenue (Million), by Product Type 2024 & 2032
- Figure 27: Rest of Africa Africa Sodium Reduction Ingredients Industry Revenue Share (%), by Product Type 2024 & 2032
- Figure 28: Rest of Africa Africa Sodium Reduction Ingredients Industry Revenue (Million), by Application 2024 & 2032
- Figure 29: Rest of Africa Africa Sodium Reduction Ingredients Industry Revenue Share (%), by Application 2024 & 2032
- Figure 30: Rest of Africa Africa Sodium Reduction Ingredients Industry Revenue (Million), by Geography 2024 & 2032
- Figure 31: Rest of Africa Africa Sodium Reduction Ingredients Industry Revenue Share (%), by Geography 2024 & 2032
- Figure 32: Rest of Africa Africa Sodium Reduction Ingredients Industry Revenue (Million), by Country 2024 & 2032
- Figure 33: Rest of Africa Africa Sodium Reduction Ingredients Industry Revenue Share (%), by Country 2024 & 2032
List of Tables
- Table 1: Global Africa Sodium Reduction Ingredients Industry Revenue Million Forecast, by Region 2019 & 2032
- Table 2: Global Africa Sodium Reduction Ingredients Industry Revenue Million Forecast, by Product Type 2019 & 2032
- Table 3: Global Africa Sodium Reduction Ingredients Industry Revenue Million Forecast, by Application 2019 & 2032
- Table 4: Global Africa Sodium Reduction Ingredients Industry Revenue Million Forecast, by Geography 2019 & 2032
- Table 5: Global Africa Sodium Reduction Ingredients Industry Revenue Million Forecast, by Region 2019 & 2032
- Table 6: Global Africa Sodium Reduction Ingredients Industry Revenue Million Forecast, by Product Type 2019 & 2032
- Table 7: Global Africa Sodium Reduction Ingredients Industry Revenue Million Forecast, by Application 2019 & 2032
- Table 8: Global Africa Sodium Reduction Ingredients Industry Revenue Million Forecast, by Geography 2019 & 2032
- Table 9: Global Africa Sodium Reduction Ingredients Industry Revenue Million Forecast, by Country 2019 & 2032
- Table 10: Global Africa Sodium Reduction Ingredients Industry Revenue Million Forecast, by Product Type 2019 & 2032
- Table 11: Global Africa Sodium Reduction Ingredients Industry Revenue Million Forecast, by Application 2019 & 2032
- Table 12: Global Africa Sodium Reduction Ingredients Industry Revenue Million Forecast, by Geography 2019 & 2032
- Table 13: Global Africa Sodium Reduction Ingredients Industry Revenue Million Forecast, by Country 2019 & 2032
- Table 14: Global Africa Sodium Reduction Ingredients Industry Revenue Million Forecast, by Product Type 2019 & 2032
- Table 15: Global Africa Sodium Reduction Ingredients Industry Revenue Million Forecast, by Application 2019 & 2032
- Table 16: Global Africa Sodium Reduction Ingredients Industry Revenue Million Forecast, by Geography 2019 & 2032
- Table 17: Global Africa Sodium Reduction Ingredients Industry Revenue Million Forecast, by Country 2019 & 2032
- Table 18: Global Africa Sodium Reduction Ingredients Industry Revenue Million Forecast, by Product Type 2019 & 2032
- Table 19: Global Africa Sodium Reduction Ingredients Industry Revenue Million Forecast, by Application 2019 & 2032
- Table 20: Global Africa Sodium Reduction Ingredients Industry Revenue Million Forecast, by Geography 2019 & 2032
- Table 21: Global Africa Sodium Reduction Ingredients Industry Revenue Million Forecast, by Country 2019 & 2032
Frequently Asked Questions
1. What is the projected Compound Annual Growth Rate (CAGR) of the Africa Sodium Reduction Ingredients Industry?
The projected CAGR is approximately 5.32%.
2. Which companies are prominent players in the Africa Sodium Reduction Ingredients Industry?
Key companies in the market include Kerry Group, Koninklijke DSM N V, Tate & Lyle PLC, Cargill Incorporated, AngelYeast Co Ltd, Givaudan*List Not Exhaustive.
3. What are the main segments of the Africa Sodium Reduction Ingredients Industry?
The market segments include Product Type, Application, Geography.
4. Can you provide details about the market size?
The market size is estimated to be USD XX Million as of 2022.
5. What are some drivers contributing to market growth?
N/A
6. What are the notable trends driving market growth?
Increased Utilization of Mineral Salts as Sodium Reduction Ingredients.
7. Are there any restraints impacting market growth?
N/A
8. Can you provide examples of recent developments in the market?
N/A
9. What pricing options are available for accessing the report?
Pricing options include single-user, multi-user, and enterprise licenses priced at USD 4750, USD 5250, and USD 8750 respectively.
10. Is the market size provided in terms of value or volume?
The market size is provided in terms of value, measured in Million.
11. Are there any specific market keywords associated with the report?
Yes, the market keyword associated with the report is "Africa Sodium Reduction Ingredients Industry," which aids in identifying and referencing the specific market segment covered.
12. How do I determine which pricing option suits my needs best?
The pricing options vary based on user requirements and access needs. Individual users may opt for single-user licenses, while businesses requiring broader access may choose multi-user or enterprise licenses for cost-effective access to the report.
13. Are there any additional resources or data provided in the Africa Sodium Reduction Ingredients Industry report?
While the report offers comprehensive insights, it's advisable to review the specific contents or supplementary materials provided to ascertain if additional resources or data are available.
14. How can I stay updated on further developments or reports in the Africa Sodium Reduction Ingredients Industry?
To stay informed about further developments, trends, and reports in the Africa Sodium Reduction Ingredients Industry, consider subscribing to industry newsletters, following relevant companies and organizations, or regularly checking reputable industry news sources and publications.
Methodology
Step 1 - Identification of Relevant Samples Size from Population Database


Step 2 - Approaches for Defining Global Market Size (Value, Volume* & Price*)

Note*: In applicable scenarios
Step 3 - Data Sources
Primary Research
- Web Analytics
- Survey Reports
- Research Institute
- Latest Research Reports
- Opinion Leaders
Secondary Research
- Annual Reports
- White Paper
- Latest Press Release
- Industry Association
- Paid Database
- Investor Presentations

Step 4 - Data Triangulation
Involves using different sources of information in order to increase the validity of a study
These sources are likely to be stakeholders in a program - participants, other researchers, program staff, other community members, and so on.
Then we put all data in single framework & apply various statistical tools to find out the dynamic on the market.
During the analysis stage, feedback from the stakeholder groups would be compared to determine areas of agreement as well as areas of divergence


