

Key Insights
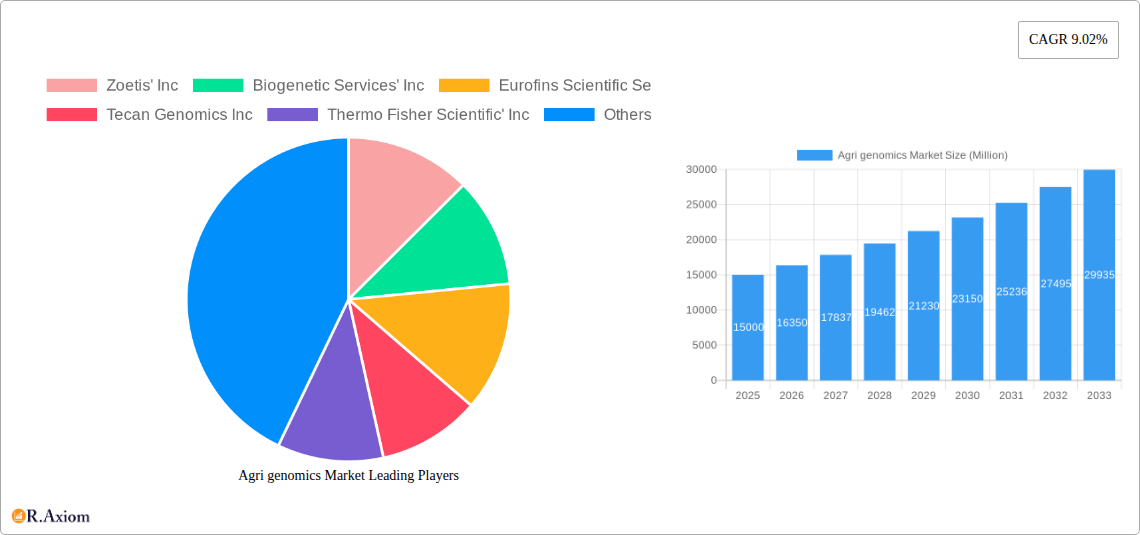
The Agri-genomics market is experiencing robust growth, driven by the increasing demand for higher crop yields and improved livestock productivity in a world facing challenges of food security and climate change. The market's Compound Annual Growth Rate (CAGR) of 9.02% from 2019-2024 suggests a significant expansion, projected to continue into the forecast period (2025-2033). Key drivers include advancements in genomic technologies such as Next Generation Sequencing (NGS), enabling cost-effective and high-throughput genetic analysis. The rising adoption of precision agriculture techniques, which leverage genomic data for optimized crop management and breeding programs, further fuels market growth. Technological advancements in areas like Real-Time PCR (qPCR) and microarrays provide efficient tools for genotyping, DNA fingerprinting, and gene expression analysis, contributing significantly to market expansion. Furthermore, increasing government investments in agricultural research and development globally are bolstering the adoption of agri-genomics solutions. Segmentation reveals a strong emphasis on crops and livestock applications, with genotyping and DNA fingerprinting being prominent service offerings.
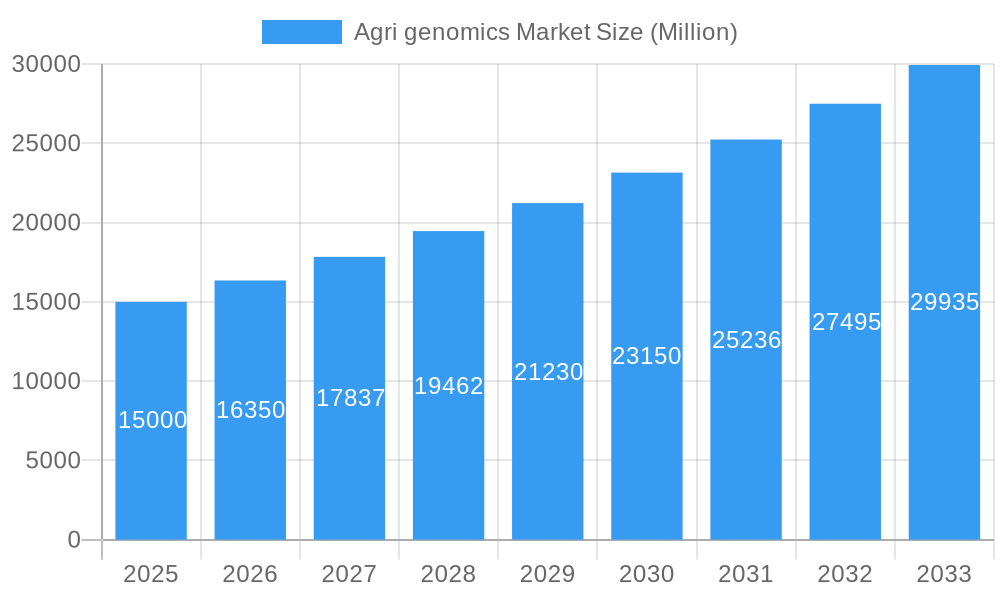
Agri genomics Market Market Size (In Billion)
While the market presents considerable opportunities, challenges remain. The high cost of advanced genomic technologies, particularly NGS, can limit accessibility for smaller agricultural businesses. The complexity of genomic data analysis and the need for specialized expertise represent further hurdles. However, ongoing technological advancements, decreasing sequencing costs, and the increasing availability of user-friendly analytical tools are expected to mitigate these restraints. The competitive landscape is dynamic, with key players like Illumina, Thermo Fisher Scientific, and Zoetis contributing to innovation and market expansion through their offerings of advanced technologies, comprehensive services, and extensive research capabilities. Regional analysis indicates that North America and Europe currently dominate the market, but the Asia-Pacific region is poised for significant growth due to its expanding agricultural sector and increasing adoption of advanced technologies. Future market expansion will depend upon continued technological advancements, regulatory support, and increasing awareness of the benefits of agri-genomics among stakeholders across the globe.
Agri genomics Market Company Market Share
This detailed report provides a comprehensive analysis of the AgriGenomics market, covering market size, segmentation, growth drivers, challenges, opportunities, and key players. The study period spans from 2019 to 2033, with 2025 serving as the base and estimated year. The report utilizes data from the historical period (2019-2024) to forecast market trends from 2025 to 2033. This report is essential for industry stakeholders, investors, and anyone seeking a deep understanding of this rapidly evolving sector. The market is expected to reach xx Million by 2033, exhibiting a CAGR of xx% during the forecast period.
AgriGenomics Market Market Concentration & Innovation
The AgriGenomics market exhibits a moderately concentrated landscape, with several key players holding significant market share. Illumina, Inc., Thermo Fisher Scientific Inc., and Zoetis Inc. are among the leading companies, commanding a combined market share of approximately xx%. However, the market also features several smaller, specialized companies, fostering competition and innovation.
Market Concentration Metrics:
- Herfindahl-Hirschman Index (HHI): xx (indicating a moderately concentrated market)
- Top 3 Players Market Share: xx%
- Top 5 Players Market Share: xx%
Innovation Drivers:
- Advancements in Next-Generation Sequencing (NGS) technologies are significantly driving market growth.
- The increasing demand for high-throughput screening and cost-effective solutions is fueling innovation.
- Development of sophisticated bioinformatics tools for data analysis and interpretation is crucial.
Regulatory Frameworks & M&A Activities:
Regulatory frameworks related to GMOs and data privacy significantly influence market dynamics. The increasing adoption of precision agriculture technologies is encouraging M&A activity. Over the period 2019-2024, the total value of M&A deals within the AgriGenomics market was estimated to be xx Million. Key transactions included:
- Thermo Fisher Scientific Inc.'s acquisition of cell sorting technology in February 2021, significantly enhancing its capabilities in flow cytometry.
Product Substitutes & End-User Trends:
Traditional breeding methods pose a competitive threat. However, the growing demand for enhanced crop yields, disease resistance, and improved livestock productivity drives adoption of AgriGenomics solutions.
AgriGenomics Market Industry Trends & Insights
The AgriGenomics market is experiencing substantial growth fueled by several key factors. The increasing global population and the resulting demand for enhanced food production are primary drivers. Technological advancements, particularly in NGS and bioinformatics, are enabling more efficient and cost-effective genomic analysis. Furthermore, government initiatives promoting the adoption of precision agriculture techniques contribute to market expansion.
The market's CAGR during the forecast period (2025-2033) is projected to be xx%. Market penetration for NGS technology in the AgriGenomics sector is expected to increase from xx% in 2025 to xx% by 2033, driven by the technology's higher throughput and reduced cost per sample.
Consumer preferences are shifting towards sustainably produced and high-quality food, creating a strong demand for genetically improved crops and livestock. Competitive dynamics are characterized by both established players and emerging companies striving to innovate and capture market share. This leads to increased investment in R&D and strategic partnerships.
Dominant Markets & Segments in AgriGenomics Market
The North American region currently holds the largest market share in AgriGenomics, driven by significant investments in agricultural biotechnology and the availability of advanced technologies. Within the segments, Next-Generation Sequencing (NGS) technology dominates the market due to its superior capabilities in high-throughput screening and data generation.
Dominant Segments & Key Drivers:
- Technology: Next-Generation Sequencing (NGS) – driven by its high throughput and detailed data.
- Application: Crops – high demand for enhanced yield, disease resistance, and improved nutritional value.
- Service Offerings: Genotyping – widespread use for various applications in breeding programs and trait selection.
Regional Dominance Analysis:
North America's dominance is attributed to:
- High government funding for agricultural research.
- Presence of major AgriGenomics companies.
- Strong private sector investment.
- Adoption of advanced technologies.
Europe and Asia-Pacific are also showing robust growth, propelled by increasing agricultural investments and technological advancements.
AgriGenomics Market Product Developments
Recent product innovations focus on developing more cost-effective and user-friendly platforms for NGS data analysis. Several companies are integrating AI and machine learning into their AgriGenomics solutions to enhance data interpretation and decision-making. These advancements improve efficiency and effectiveness in breeding programs, leading to superior products in the agriculture industry. The focus is on creating platforms compatible with diverse applications and easy integration within existing workflows.
Report Scope & Segmentation Analysis
This comprehensive AgriGenomics Market report offers an in-depth analysis of the market landscape, meticulously segmenting it across three pivotal dimensions: Technology, Application, and Service Offerings. Our analysis provides granular insights into each segment's current standing and projected trajectory, empowering stakeholders with strategic foresight.
Technology: The report meticulously examines key technologies driving the AgriGenomics market, including Real-Time PCR (qPCR), Microarrays, Next-Generation Sequencing (NGS), Capillary Electrophoresis, and a category for Other Technologies. The NGS segment is anticipated to experience the most robust expansion. This accelerated growth is attributed to its unparalleled throughput capabilities, cost-effectiveness, and its crucial role in unlocking complex genomic information essential for advanced agricultural applications.
Application: The market is bifurcated into two primary application areas: Crops and Livestock. Currently, the Crops segment commands a significant market share. This dominance is fueled by the widespread and ever-increasing adoption of AgriGenomics in optimizing crop breeding, developing resilient crop varieties against environmental stressors and diseases, and ultimately enhancing overall crop yield and quality. While the livestock segment is also showing promising growth, the extensive research and development in crop improvement continue to solidify its leading position.
Service Offerings: A detailed breakdown of AgriGenomics service offerings is provided, encompassing: Genotyping, DNA Fingerprinting, Assessment of Genetic Purity, Trait Purity Assessment, Gene Expression Analysis, and a consolidated category for Other Service Offerings. At present, Genotyping stands as the most dominant service offering. This is driven by its fundamental importance in identifying genetic variations, facilitating marker-assisted selection, and underpinning many other advanced genomic analyses critical for both crop and livestock improvement.
Within the full report, you will find detailed growth projections for each of these segments, supported by robust market size estimations and an in-depth analysis of the competitive dynamics shaping the AgriGenomics landscape. These insights are crucial for understanding market trends and identifying future opportunities.
Key Drivers of AgriGenomics Market Growth
Several factors contribute to the AgriGenomics market's substantial growth:
- Technological advancements: NGS, microarrays, and bioinformatics tools enhance data analysis and precision breeding.
- Economic factors: Growing demand for food security and increased crop yields fuels investments.
- Regulatory support: Government initiatives promoting precision agriculture accelerate market expansion.
Challenges in the AgriGenomics Market Sector
The AgriGenomics sector faces significant challenges:
- High costs: NGS and related technologies can be expensive, limiting adoption, especially in developing countries.
- Data interpretation: The vast amount of genomic data needs sophisticated bioinformatics tools and expertise for analysis.
- Regulatory hurdles: Stringent regulations surrounding GMOs can restrict innovation and product development. The associated compliance costs also add to the overall cost.
Emerging Opportunities in AgriGenomics Market
Several opportunities are emerging for AgriGenomics:
- Personalized agriculture: Tailoring crop and livestock management to specific genetic needs.
- Disease resistance: Developing crops and livestock resistant to pathogens through genomics.
- Climate-resilient crops: Developing crops that thrive under various climate change scenarios.
Leading Players in the Agri Genomics Market Market
- Zoetis' Inc
- Biogenetic Services' Inc
- Eurofins Scientific Se
- Tecan Genomics Inc
- Thermo Fisher Scientific' Inc
- Galseq Srl Via Italia
- Arbor Biosciences
- Agrigenomics' Inc
- Neogen Corporation
- Illumina' Inc
Key Developments in AgriGenomics Market Industry
- February 2023: Tecan Genomics collaborated with Singular Genomics, combining automation expertise with advanced sequencing technology. This development streamlines NGS workflows and increases accessibility.
- February 2021: Thermo Fisher Scientific Inc. acquired cell sorting technology, enhancing its flow cytometry capabilities and strengthening its position in cell analysis.
Strategic Outlook for AgriGenomics Market Market
The AgriGenomics market exhibits robust growth potential, driven by ongoing technological advancements, increasing demand for sustainable agricultural practices, and supportive government policies. Future opportunities lie in the development of personalized agricultural solutions and climate-resilient crops. Continued investment in R&D and strategic partnerships will be crucial for companies seeking to succeed in this rapidly evolving sector.
Agri genomics Market Segmentation
- 1. Production Analysis
- 2. Consumption Analysis
- 3. Import Market Analysis (Value & Volume)
- 4. Export Market Analysis (Value & Volume)
- 5. Price Trend Analysis
Agri genomics Market Segmentation By Geography
-
1. North America
- 1.1. United States
- 1.2. Canada
- 1.3. Mexico
-
2. South America
- 2.1. Brazil
- 2.2. Argentina
- 2.3. Rest of South America
-
3. Europe
- 3.1. United Kingdom
- 3.2. Germany
- 3.3. France
- 3.4. Italy
- 3.5. Spain
- 3.6. Russia
- 3.7. Benelux
- 3.8. Nordics
- 3.9. Rest of Europe
-
4. Middle East & Africa
- 4.1. Turkey
- 4.2. Israel
- 4.3. GCC
- 4.4. North Africa
- 4.5. South Africa
- 4.6. Rest of Middle East & Africa
-
5. Asia Pacific
- 5.1. China
- 5.2. India
- 5.3. Japan
- 5.4. South Korea
- 5.5. ASEAN
- 5.6. Oceania
- 5.7. Rest of Asia Pacific
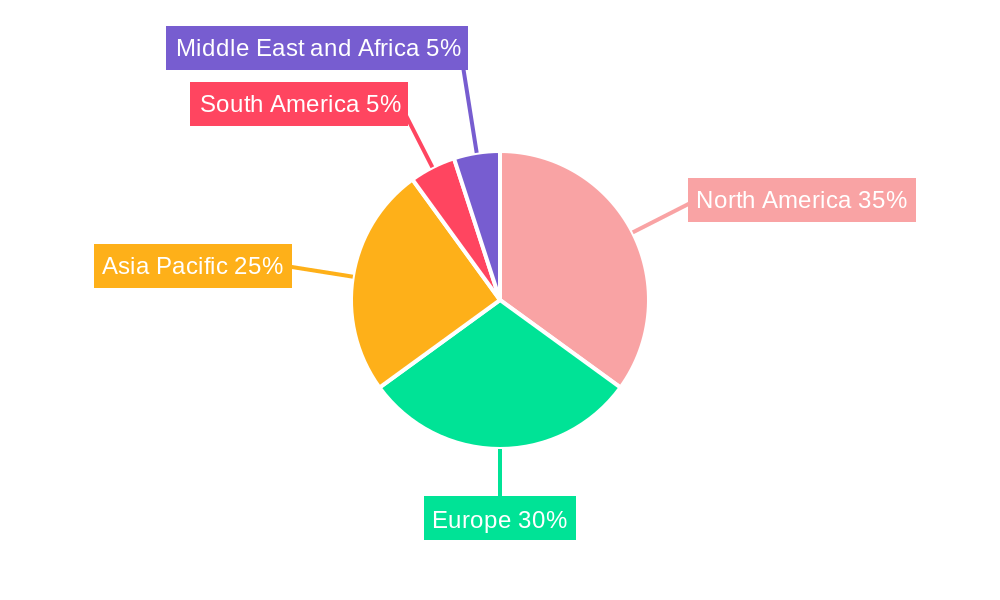
Agri genomics Market Regional Market Share
Geographic Coverage of Agri genomics Market
Agri genomics Market REPORT HIGHLIGHTS
| Aspects | Details |
|---|---|
| Study Period | 2020-2034 |
| Base Year | 2025 |
| Estimated Year | 2026 |
| Forecast Period | 2026-2034 |
| Historical Period | 2020-2025 |
| Growth Rate | CAGR of 9.7% from 2020-2034 |
| Segmentation |
|
Table of Contents
- 1. Introduction
- 1.1. Research Scope
- 1.2. Market Segmentation
- 1.3. Research Objective
- 1.4. Definitions and Assumptions
- 2. Executive Summary
- 2.1. Market Snapshot
- 3. Market Dynamics
- 3.1. Market Drivers
- 3.2. Market Restrains
- 3.3. Market Trends
- 3.4. Market Opportunities
- 4. Market Factor Analysis
- 4.1. Porters Five Forces
- 4.1.1. Bargaining Power of Suppliers
- 4.1.2. Bargaining Power of Buyers
- 4.1.3. Threat of New Entrants
- 4.1.4. Threat of Substitutes
- 4.1.5. Competitive Rivalry
- 4.2. PESTEL analysis
- 4.3. BCG Analysis
- 4.3.1. Stars (High Growth, High Market Share)
- 4.3.2. Cash Cows (Low Growth, High Market Share)
- 4.3.3. Question Mark (High Growth, Low Market Share)
- 4.3.4. Dogs (Low Growth, Low Market Share)
- 4.4. Ansoff Matrix Analysis
- 4.5. Supply Chain Analysis
- 4.6. Regulatory Landscape
- 4.7. Current Market Potential and Opportunity Assessment (TAM–SAM–SOM Framework)
- 4.8. RAX Analyst Note
- 4.1. Porters Five Forces
- 5. Market Analysis, Insights and Forecast 2021-2033
- 5.1. Market Analysis, Insights and Forecast - by Production Analysis
- 5.2. Market Analysis, Insights and Forecast - by Consumption Analysis
- 5.3. Market Analysis, Insights and Forecast - by Import Market Analysis (Value & Volume)
- 5.4. Market Analysis, Insights and Forecast - by Export Market Analysis (Value & Volume)
- 5.5. Market Analysis, Insights and Forecast - by Price Trend Analysis
- 5.6. Market Analysis, Insights and Forecast - by Region
- 5.6.1. North America
- 5.6.2. South America
- 5.6.3. Europe
- 5.6.4. Middle East & Africa
- 5.6.5. Asia Pacific
- 6. Global Agri genomics Market Analysis, Insights and Forecast, 2021-2033
- 6.1. Market Analysis, Insights and Forecast - by Production Analysis
- 6.2. Market Analysis, Insights and Forecast - by Consumption Analysis
- 6.3. Market Analysis, Insights and Forecast - by Import Market Analysis (Value & Volume)
- 6.4. Market Analysis, Insights and Forecast - by Export Market Analysis (Value & Volume)
- 6.5. Market Analysis, Insights and Forecast - by Price Trend Analysis
- 7. North America Agri genomics Market Analysis, Insights and Forecast, 2020-2032
- 7.1. Market Analysis, Insights and Forecast - by Production Analysis
- 7.2. Market Analysis, Insights and Forecast - by Consumption Analysis
- 7.3. Market Analysis, Insights and Forecast - by Import Market Analysis (Value & Volume)
- 7.4. Market Analysis, Insights and Forecast - by Export Market Analysis (Value & Volume)
- 7.5. Market Analysis, Insights and Forecast - by Price Trend Analysis
- 8. South America Agri genomics Market Analysis, Insights and Forecast, 2020-2032
- 8.1. Market Analysis, Insights and Forecast - by Production Analysis
- 8.2. Market Analysis, Insights and Forecast - by Consumption Analysis
- 8.3. Market Analysis, Insights and Forecast - by Import Market Analysis (Value & Volume)
- 8.4. Market Analysis, Insights and Forecast - by Export Market Analysis (Value & Volume)
- 8.5. Market Analysis, Insights and Forecast - by Price Trend Analysis
- 9. Europe Agri genomics Market Analysis, Insights and Forecast, 2020-2032
- 9.1. Market Analysis, Insights and Forecast - by Production Analysis
- 9.2. Market Analysis, Insights and Forecast - by Consumption Analysis
- 9.3. Market Analysis, Insights and Forecast - by Import Market Analysis (Value & Volume)
- 9.4. Market Analysis, Insights and Forecast - by Export Market Analysis (Value & Volume)
- 9.5. Market Analysis, Insights and Forecast - by Price Trend Analysis
- 10. Middle East & Africa Agri genomics Market Analysis, Insights and Forecast, 2020-2032
- 10.1. Market Analysis, Insights and Forecast - by Production Analysis
- 10.2. Market Analysis, Insights and Forecast - by Consumption Analysis
- 10.3. Market Analysis, Insights and Forecast - by Import Market Analysis (Value & Volume)
- 10.4. Market Analysis, Insights and Forecast - by Export Market Analysis (Value & Volume)
- 10.5. Market Analysis, Insights and Forecast - by Price Trend Analysis
- 11. Asia Pacific Agri genomics Market Analysis, Insights and Forecast, 2020-2032
- 11.1. Market Analysis, Insights and Forecast - by Production Analysis
- 11.2. Market Analysis, Insights and Forecast - by Consumption Analysis
- 11.3. Market Analysis, Insights and Forecast - by Import Market Analysis (Value & Volume)
- 11.4. Market Analysis, Insights and Forecast - by Export Market Analysis (Value & Volume)
- 11.5. Market Analysis, Insights and Forecast - by Price Trend Analysis
- 12. Competitive Analysis
- 12.1. Company Profiles
- 12.1.1 Zoetis' Inc
- 12.1.1.1. Company Overview
- 12.1.1.2. Products
- 12.1.1.3. Company Financials
- 12.1.1.4. SWOT Analysis
- 12.1.2 Biogenetic Services' Inc
- 12.1.2.1. Company Overview
- 12.1.2.2. Products
- 12.1.2.3. Company Financials
- 12.1.2.4. SWOT Analysis
- 12.1.3 Eurofins Scientific Se
- 12.1.3.1. Company Overview
- 12.1.3.2. Products
- 12.1.3.3. Company Financials
- 12.1.3.4. SWOT Analysis
- 12.1.4 Tecan Genomics Inc
- 12.1.4.1. Company Overview
- 12.1.4.2. Products
- 12.1.4.3. Company Financials
- 12.1.4.4. SWOT Analysis
- 12.1.5 Thermo Fisher Scientific' Inc
- 12.1.5.1. Company Overview
- 12.1.5.2. Products
- 12.1.5.3. Company Financials
- 12.1.5.4. SWOT Analysis
- 12.1.6 Galseq Srl Via Italia
- 12.1.6.1. Company Overview
- 12.1.6.2. Products
- 12.1.6.3. Company Financials
- 12.1.6.4. SWOT Analysis
- 12.1.7 Arbor Biosciences
- 12.1.7.1. Company Overview
- 12.1.7.2. Products
- 12.1.7.3. Company Financials
- 12.1.7.4. SWOT Analysis
- 12.1.8 Agrigenomics' Inc
- 12.1.8.1. Company Overview
- 12.1.8.2. Products
- 12.1.8.3. Company Financials
- 12.1.8.4. SWOT Analysis
- 12.1.9 Neogen Corporation
- 12.1.9.1. Company Overview
- 12.1.9.2. Products
- 12.1.9.3. Company Financials
- 12.1.9.4. SWOT Analysis
- 12.1.10 Illumina' Inc
- 12.1.10.1. Company Overview
- 12.1.10.2. Products
- 12.1.10.3. Company Financials
- 12.1.10.4. SWOT Analysis
- 12.1.1 Zoetis' Inc
- 12.2. Market Entropy
- 12.2.1 Company's Key Areas Served
- 12.2.2 Recent Developments
- 12.3. Company Market Share Analysis 2025
- 12.3.1 Top 5 Companies Market Share Analysis
- 12.3.2 Top 3 Companies Market Share Analysis
- 12.4. List of Potential Customers
- 13. Research Methodology
List of Figures
- Figure 1: Global Agri genomics Market Revenue Breakdown (billion, %) by Region 2025 & 2033
- Figure 2: North America Agri genomics Market Revenue (billion), by Production Analysis 2025 & 2033
- Figure 3: North America Agri genomics Market Revenue Share (%), by Production Analysis 2025 & 2033
- Figure 4: North America Agri genomics Market Revenue (billion), by Consumption Analysis 2025 & 2033
- Figure 5: North America Agri genomics Market Revenue Share (%), by Consumption Analysis 2025 & 2033
- Figure 6: North America Agri genomics Market Revenue (billion), by Import Market Analysis (Value & Volume) 2025 & 2033
- Figure 7: North America Agri genomics Market Revenue Share (%), by Import Market Analysis (Value & Volume) 2025 & 2033
- Figure 8: North America Agri genomics Market Revenue (billion), by Export Market Analysis (Value & Volume) 2025 & 2033
- Figure 9: North America Agri genomics Market Revenue Share (%), by Export Market Analysis (Value & Volume) 2025 & 2033
- Figure 10: North America Agri genomics Market Revenue (billion), by Price Trend Analysis 2025 & 2033
- Figure 11: North America Agri genomics Market Revenue Share (%), by Price Trend Analysis 2025 & 2033
- Figure 12: North America Agri genomics Market Revenue (billion), by Country 2025 & 2033
- Figure 13: North America Agri genomics Market Revenue Share (%), by Country 2025 & 2033
- Figure 14: South America Agri genomics Market Revenue (billion), by Production Analysis 2025 & 2033
- Figure 15: South America Agri genomics Market Revenue Share (%), by Production Analysis 2025 & 2033
- Figure 16: South America Agri genomics Market Revenue (billion), by Consumption Analysis 2025 & 2033
- Figure 17: South America Agri genomics Market Revenue Share (%), by Consumption Analysis 2025 & 2033
- Figure 18: South America Agri genomics Market Revenue (billion), by Import Market Analysis (Value & Volume) 2025 & 2033
- Figure 19: South America Agri genomics Market Revenue Share (%), by Import Market Analysis (Value & Volume) 2025 & 2033
- Figure 20: South America Agri genomics Market Revenue (billion), by Export Market Analysis (Value & Volume) 2025 & 2033
- Figure 21: South America Agri genomics Market Revenue Share (%), by Export Market Analysis (Value & Volume) 2025 & 2033
- Figure 22: South America Agri genomics Market Revenue (billion), by Price Trend Analysis 2025 & 2033
- Figure 23: South America Agri genomics Market Revenue Share (%), by Price Trend Analysis 2025 & 2033
- Figure 24: South America Agri genomics Market Revenue (billion), by Country 2025 & 2033
- Figure 25: South America Agri genomics Market Revenue Share (%), by Country 2025 & 2033
- Figure 26: Europe Agri genomics Market Revenue (billion), by Production Analysis 2025 & 2033
- Figure 27: Europe Agri genomics Market Revenue Share (%), by Production Analysis 2025 & 2033
- Figure 28: Europe Agri genomics Market Revenue (billion), by Consumption Analysis 2025 & 2033
- Figure 29: Europe Agri genomics Market Revenue Share (%), by Consumption Analysis 2025 & 2033
- Figure 30: Europe Agri genomics Market Revenue (billion), by Import Market Analysis (Value & Volume) 2025 & 2033
- Figure 31: Europe Agri genomics Market Revenue Share (%), by Import Market Analysis (Value & Volume) 2025 & 2033
- Figure 32: Europe Agri genomics Market Revenue (billion), by Export Market Analysis (Value & Volume) 2025 & 2033
- Figure 33: Europe Agri genomics Market Revenue Share (%), by Export Market Analysis (Value & Volume) 2025 & 2033
- Figure 34: Europe Agri genomics Market Revenue (billion), by Price Trend Analysis 2025 & 2033
- Figure 35: Europe Agri genomics Market Revenue Share (%), by Price Trend Analysis 2025 & 2033
- Figure 36: Europe Agri genomics Market Revenue (billion), by Country 2025 & 2033
- Figure 37: Europe Agri genomics Market Revenue Share (%), by Country 2025 & 2033
- Figure 38: Middle East & Africa Agri genomics Market Revenue (billion), by Production Analysis 2025 & 2033
- Figure 39: Middle East & Africa Agri genomics Market Revenue Share (%), by Production Analysis 2025 & 2033
- Figure 40: Middle East & Africa Agri genomics Market Revenue (billion), by Consumption Analysis 2025 & 2033
- Figure 41: Middle East & Africa Agri genomics Market Revenue Share (%), by Consumption Analysis 2025 & 2033
- Figure 42: Middle East & Africa Agri genomics Market Revenue (billion), by Import Market Analysis (Value & Volume) 2025 & 2033
- Figure 43: Middle East & Africa Agri genomics Market Revenue Share (%), by Import Market Analysis (Value & Volume) 2025 & 2033
- Figure 44: Middle East & Africa Agri genomics Market Revenue (billion), by Export Market Analysis (Value & Volume) 2025 & 2033
- Figure 45: Middle East & Africa Agri genomics Market Revenue Share (%), by Export Market Analysis (Value & Volume) 2025 & 2033
- Figure 46: Middle East & Africa Agri genomics Market Revenue (billion), by Price Trend Analysis 2025 & 2033
- Figure 47: Middle East & Africa Agri genomics Market Revenue Share (%), by Price Trend Analysis 2025 & 2033
- Figure 48: Middle East & Africa Agri genomics Market Revenue (billion), by Country 2025 & 2033
- Figure 49: Middle East & Africa Agri genomics Market Revenue Share (%), by Country 2025 & 2033
- Figure 50: Asia Pacific Agri genomics Market Revenue (billion), by Production Analysis 2025 & 2033
- Figure 51: Asia Pacific Agri genomics Market Revenue Share (%), by Production Analysis 2025 & 2033
- Figure 52: Asia Pacific Agri genomics Market Revenue (billion), by Consumption Analysis 2025 & 2033
- Figure 53: Asia Pacific Agri genomics Market Revenue Share (%), by Consumption Analysis 2025 & 2033
- Figure 54: Asia Pacific Agri genomics Market Revenue (billion), by Import Market Analysis (Value & Volume) 2025 & 2033
- Figure 55: Asia Pacific Agri genomics Market Revenue Share (%), by Import Market Analysis (Value & Volume) 2025 & 2033
- Figure 56: Asia Pacific Agri genomics Market Revenue (billion), by Export Market Analysis (Value & Volume) 2025 & 2033
- Figure 57: Asia Pacific Agri genomics Market Revenue Share (%), by Export Market Analysis (Value & Volume) 2025 & 2033
- Figure 58: Asia Pacific Agri genomics Market Revenue (billion), by Price Trend Analysis 2025 & 2033
- Figure 59: Asia Pacific Agri genomics Market Revenue Share (%), by Price Trend Analysis 2025 & 2033
- Figure 60: Asia Pacific Agri genomics Market Revenue (billion), by Country 2025 & 2033
- Figure 61: Asia Pacific Agri genomics Market Revenue Share (%), by Country 2025 & 2033
List of Tables
- Table 1: Global Agri genomics Market Revenue billion Forecast, by Production Analysis 2020 & 2033
- Table 2: Global Agri genomics Market Revenue billion Forecast, by Consumption Analysis 2020 & 2033
- Table 3: Global Agri genomics Market Revenue billion Forecast, by Import Market Analysis (Value & Volume) 2020 & 2033
- Table 4: Global Agri genomics Market Revenue billion Forecast, by Export Market Analysis (Value & Volume) 2020 & 2033
- Table 5: Global Agri genomics Market Revenue billion Forecast, by Price Trend Analysis 2020 & 2033
- Table 6: Global Agri genomics Market Revenue billion Forecast, by Region 2020 & 2033
- Table 7: Global Agri genomics Market Revenue billion Forecast, by Production Analysis 2020 & 2033
- Table 8: Global Agri genomics Market Revenue billion Forecast, by Consumption Analysis 2020 & 2033
- Table 9: Global Agri genomics Market Revenue billion Forecast, by Import Market Analysis (Value & Volume) 2020 & 2033
- Table 10: Global Agri genomics Market Revenue billion Forecast, by Export Market Analysis (Value & Volume) 2020 & 2033
- Table 11: Global Agri genomics Market Revenue billion Forecast, by Price Trend Analysis 2020 & 2033
- Table 12: Global Agri genomics Market Revenue billion Forecast, by Country 2020 & 2033
- Table 13: United States Agri genomics Market Revenue (billion) Forecast, by Application 2020 & 2033
- Table 14: Canada Agri genomics Market Revenue (billion) Forecast, by Application 2020 & 2033
- Table 15: Mexico Agri genomics Market Revenue (billion) Forecast, by Application 2020 & 2033
- Table 16: Global Agri genomics Market Revenue billion Forecast, by Production Analysis 2020 & 2033
- Table 17: Global Agri genomics Market Revenue billion Forecast, by Consumption Analysis 2020 & 2033
- Table 18: Global Agri genomics Market Revenue billion Forecast, by Import Market Analysis (Value & Volume) 2020 & 2033
- Table 19: Global Agri genomics Market Revenue billion Forecast, by Export Market Analysis (Value & Volume) 2020 & 2033
- Table 20: Global Agri genomics Market Revenue billion Forecast, by Price Trend Analysis 2020 & 2033
- Table 21: Global Agri genomics Market Revenue billion Forecast, by Country 2020 & 2033
- Table 22: Brazil Agri genomics Market Revenue (billion) Forecast, by Application 2020 & 2033
- Table 23: Argentina Agri genomics Market Revenue (billion) Forecast, by Application 2020 & 2033
- Table 24: Rest of South America Agri genomics Market Revenue (billion) Forecast, by Application 2020 & 2033
- Table 25: Global Agri genomics Market Revenue billion Forecast, by Production Analysis 2020 & 2033
- Table 26: Global Agri genomics Market Revenue billion Forecast, by Consumption Analysis 2020 & 2033
- Table 27: Global Agri genomics Market Revenue billion Forecast, by Import Market Analysis (Value & Volume) 2020 & 2033
- Table 28: Global Agri genomics Market Revenue billion Forecast, by Export Market Analysis (Value & Volume) 2020 & 2033
- Table 29: Global Agri genomics Market Revenue billion Forecast, by Price Trend Analysis 2020 & 2033
- Table 30: Global Agri genomics Market Revenue billion Forecast, by Country 2020 & 2033
- Table 31: United Kingdom Agri genomics Market Revenue (billion) Forecast, by Application 2020 & 2033
- Table 32: Germany Agri genomics Market Revenue (billion) Forecast, by Application 2020 & 2033
- Table 33: France Agri genomics Market Revenue (billion) Forecast, by Application 2020 & 2033
- Table 34: Italy Agri genomics Market Revenue (billion) Forecast, by Application 2020 & 2033
- Table 35: Spain Agri genomics Market Revenue (billion) Forecast, by Application 2020 & 2033
- Table 36: Russia Agri genomics Market Revenue (billion) Forecast, by Application 2020 & 2033
- Table 37: Benelux Agri genomics Market Revenue (billion) Forecast, by Application 2020 & 2033
- Table 38: Nordics Agri genomics Market Revenue (billion) Forecast, by Application 2020 & 2033
- Table 39: Rest of Europe Agri genomics Market Revenue (billion) Forecast, by Application 2020 & 2033
- Table 40: Global Agri genomics Market Revenue billion Forecast, by Production Analysis 2020 & 2033
- Table 41: Global Agri genomics Market Revenue billion Forecast, by Consumption Analysis 2020 & 2033
- Table 42: Global Agri genomics Market Revenue billion Forecast, by Import Market Analysis (Value & Volume) 2020 & 2033
- Table 43: Global Agri genomics Market Revenue billion Forecast, by Export Market Analysis (Value & Volume) 2020 & 2033
- Table 44: Global Agri genomics Market Revenue billion Forecast, by Price Trend Analysis 2020 & 2033
- Table 45: Global Agri genomics Market Revenue billion Forecast, by Country 2020 & 2033
- Table 46: Turkey Agri genomics Market Revenue (billion) Forecast, by Application 2020 & 2033
- Table 47: Israel Agri genomics Market Revenue (billion) Forecast, by Application 2020 & 2033
- Table 48: GCC Agri genomics Market Revenue (billion) Forecast, by Application 2020 & 2033
- Table 49: North Africa Agri genomics Market Revenue (billion) Forecast, by Application 2020 & 2033
- Table 50: South Africa Agri genomics Market Revenue (billion) Forecast, by Application 2020 & 2033
- Table 51: Rest of Middle East & Africa Agri genomics Market Revenue (billion) Forecast, by Application 2020 & 2033
- Table 52: Global Agri genomics Market Revenue billion Forecast, by Production Analysis 2020 & 2033
- Table 53: Global Agri genomics Market Revenue billion Forecast, by Consumption Analysis 2020 & 2033
- Table 54: Global Agri genomics Market Revenue billion Forecast, by Import Market Analysis (Value & Volume) 2020 & 2033
- Table 55: Global Agri genomics Market Revenue billion Forecast, by Export Market Analysis (Value & Volume) 2020 & 2033
- Table 56: Global Agri genomics Market Revenue billion Forecast, by Price Trend Analysis 2020 & 2033
- Table 57: Global Agri genomics Market Revenue billion Forecast, by Country 2020 & 2033
- Table 58: China Agri genomics Market Revenue (billion) Forecast, by Application 2020 & 2033
- Table 59: India Agri genomics Market Revenue (billion) Forecast, by Application 2020 & 2033
- Table 60: Japan Agri genomics Market Revenue (billion) Forecast, by Application 2020 & 2033
- Table 61: South Korea Agri genomics Market Revenue (billion) Forecast, by Application 2020 & 2033
- Table 62: ASEAN Agri genomics Market Revenue (billion) Forecast, by Application 2020 & 2033
- Table 63: Oceania Agri genomics Market Revenue (billion) Forecast, by Application 2020 & 2033
- Table 64: Rest of Asia Pacific Agri genomics Market Revenue (billion) Forecast, by Application 2020 & 2033
Frequently Asked Questions
1. What is the projected Compound Annual Growth Rate (CAGR) of the Agri genomics Market?
The projected CAGR is approximately 9.7%.
2. Which companies are prominent players in the Agri genomics Market?
Key companies in the market include Zoetis' Inc, Biogenetic Services' Inc, Eurofins Scientific Se, Tecan Genomics Inc, Thermo Fisher Scientific' Inc, Galseq Srl Via Italia, Arbor Biosciences, Agrigenomics' Inc, Neogen Corporation, Illumina' Inc.
3. What are the main segments of the Agri genomics Market?
The market segments include Production Analysis, Consumption Analysis, Import Market Analysis (Value & Volume), Export Market Analysis (Value & Volume), Price Trend Analysis.
4. Can you provide details about the market size?
The market size is estimated to be USD 5.24 billion as of 2022.
5. What are some drivers contributing to market growth?
Need for Custom Product Development; Use of CROs for Regulatory Services.
6. What are the notable trends driving market growth?
Growing Food Demand and Shrinking Land.
7. Are there any restraints impacting market growth?
Data and Cyber Security Concerns; Lack of Experts and Professionals in this Industry.
8. Can you provide examples of recent developments in the market?
February 2023: Tecan collaborated with Singular Genomics to use the turnkey MagicPrep NGS system to create sequencing-ready libraries for the G4 sequencing platform. The agreement will combine Tecan's expertise in laboratory automation, genomics, and bioinformatics with Singular Genomics' fast, flexible, and highly accurate sequencing technology to simplify life in the lab.
9. What pricing options are available for accessing the report?
Pricing options include single-user, multi-user, and enterprise licenses priced at USD 4750, USD 5250, and USD 8750 respectively.
10. Is the market size provided in terms of value or volume?
The market size is provided in terms of value, measured in billion.
11. Are there any specific market keywords associated with the report?
Yes, the market keyword associated with the report is "Agri genomics Market," which aids in identifying and referencing the specific market segment covered.
12. How do I determine which pricing option suits my needs best?
The pricing options vary based on user requirements and access needs. Individual users may opt for single-user licenses, while businesses requiring broader access may choose multi-user or enterprise licenses for cost-effective access to the report.
13. Are there any additional resources or data provided in the Agri genomics Market report?
While the report offers comprehensive insights, it's advisable to review the specific contents or supplementary materials provided to ascertain if additional resources or data are available.
14. How can I stay updated on further developments or reports in the Agri genomics Market?
To stay informed about further developments, trends, and reports in the Agri genomics Market, consider subscribing to industry newsletters, following relevant companies and organizations, or regularly checking reputable industry news sources and publications.
Methodology
Step 1 - Identification of Relevant Samples Size from Population Database


Step 2 - Approaches for Defining Global Market Size (Value, Volume* & Price*)

Note*: In applicable scenarios
Step 3 - Data Sources
Primary Research
- Web Analytics
- Survey Reports
- Research Institute
- Latest Research Reports
- Opinion Leaders
Secondary Research
- Annual Reports
- White Paper
- Latest Press Release
- Industry Association
- Paid Database
- Investor Presentations

Step 4 - Data Triangulation
Involves using different sources of information in order to increase the validity of a study
These sources are likely to be stakeholders in a program - participants, other researchers, program staff, other community members, and so on.
Then we put all data in single framework & apply various statistical tools to find out the dynamic on the market.
During the analysis stage, feedback from the stakeholder groups would be compared to determine areas of agreement as well as areas of divergence