

Key Insights
The U.S. Crop Protection Chemicals Industry is poised for steady expansion, driven by the critical need to enhance agricultural productivity and safeguard crops against a growing array of pests and diseases. With an estimated market size of $83.32 billion in 2025, the sector is projected to experience a CAGR of 5% through 2033. This growth is primarily fueled by increasing global food demand, necessitating advanced crop protection solutions to maximize yields and minimize losses. Key drivers include the adoption of integrated pest management (IPM) strategies, which often incorporate chemical interventions, alongside the development of more targeted and environmentally conscious formulations. Furthermore, government initiatives aimed at boosting agricultural output and ensuring food security contribute significantly to market momentum. Emerging trends such as the rise of biological pesticides, precision agriculture, and smart farming technologies are reshaping the competitive landscape, pushing for innovation and more sustainable practices.
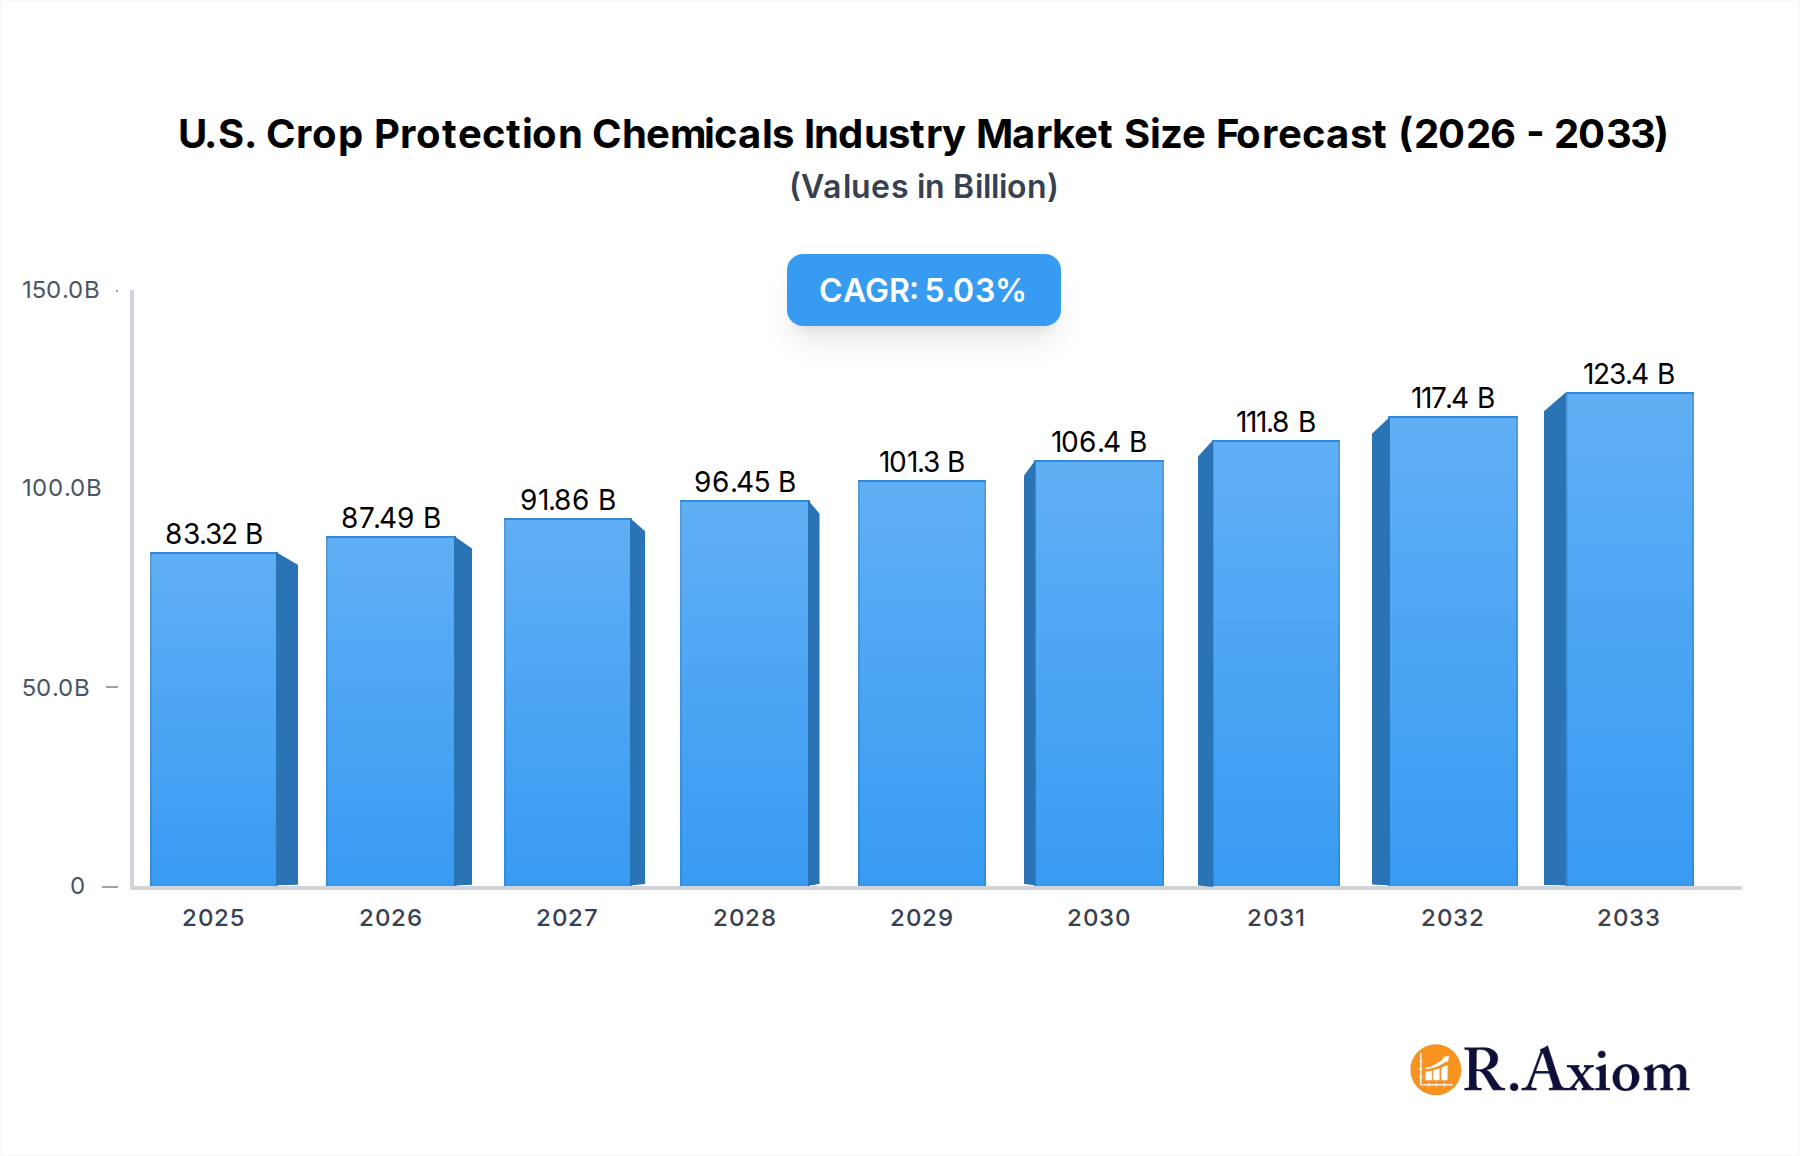
U.S. Crop Protection Chemicals Industry Market Size (In Billion)
Despite the positive outlook, the industry faces certain restraints that warrant strategic attention. Stringent regulatory frameworks governing the approval and use of agrochemicals, coupled with growing consumer concerns regarding pesticide residues and their environmental impact, present significant challenges. However, the industry is actively responding to these concerns by investing in research and development for safer, more effective, and residue-minimized products. The segment analysis reveals a robust demand across various functions, including fungicides, herbicides, and insecticides, vital for protecting staple crops like grains and cereals, as well as fruits and vegetables. Application modes such as foliar application and seed treatments are expected to remain dominant, while chemigation and soil treatment are gaining traction due to their efficiency. The dominance of major players like Bayer AG, Syngenta Group, and BASF SE underscores the competitive nature of the market, with ongoing consolidation and strategic partnerships shaping its future trajectory.

U.S. Crop Protection Chemicals Industry Company Market Share
This comprehensive report delves into the dynamic U.S. Crop Protection Chemicals Industry, providing in-depth analysis and forecasts from the historical period of 2019-2024 through to 2033. With a base year of 2025, the study offers critical insights into market concentration, innovation drivers, regulatory landscapes, and evolving end-user trends. We meticulously examine product substitutes, mergers and acquisitions (M&A) activities, and the competitive environment, supported by market share data and M&A deal values. The report also explores dominant market segments, including fungicides, herbicides, insecticides, molluscicides, nematicides, and their application modes like chemigation, foliar, fumigation, seed treatment, and soil treatment across commercial crops, fruits & vegetables, grains & cereals, pulses & oilseeds, and turf & ornamental sectors. Furthermore, we analyze industry trends, technological disruptions, consumer preferences, and competitive dynamics, projecting a Compound Annual Growth Rate (CAGR) and market penetration figures. Discover product developments, detailed segmentation analysis with growth projections, key growth drivers, prevailing challenges, emerging opportunities, and a strategic outlook for the U.S. Crop Protection Chemicals Industry.
U.S. Crop Protection Chemicals Industry Market Concentration & Innovation
The U.S. Crop Protection Chemicals Industry exhibits a moderate to high degree of market concentration, with a few key players holding significant market share. These include global giants like Bayer AG, Syngenta Group, BASF SE, and Corteva Agriscience, alongside specialized companies such as FMC Corporation, UPL Limited, Sumitomo Chemical Co Ltd, American Vanguard Corporation, ADAMA Agricultural Solutions Ltd, and Nufarm Ltd. Innovation serves as a primary driver, fueled by the constant need to address pest resistance, enhance crop yields, and meet increasingly stringent environmental regulations. Significant R&D investments are directed towards developing targeted, environmentally friendly, and residue-limited crop protection solutions. Regulatory frameworks, overseen by agencies like the EPA, play a crucial role in shaping market dynamics, influencing product approvals and the phasing out of older chemistries. The threat of product substitutes, including biological control agents and genetically modified crops, is also a growing consideration. End-user trends, driven by demand for sustainable agriculture and increased food production, necessitate continuous innovation. M&A activities, such as strategic partnerships and acquisitions, are prevalent, with estimated deal values in the billions of dollars, aimed at consolidating market positions, expanding product portfolios, and acquiring cutting-edge technologies.
U.S. Crop Protection Chemicals Industry Industry Trends & Insights
The U.S. Crop Protection Chemicals Industry is experiencing robust growth, driven by several interconnected factors. A primary growth catalyst is the escalating global demand for food security, necessitating higher agricultural productivity and reduced crop losses. This, in turn, fuels the demand for effective crop protection solutions. Technological disruptions are at the forefront, with advancements in precision agriculture, biotechnology, and digital farming enabling more targeted and efficient application of chemicals. The development of smart farming technologies, including drone application and AI-powered monitoring, is revolutionizing how crop protection products are used, leading to reduced environmental impact and improved efficacy. Consumer preferences are increasingly shifting towards sustainably produced food, pushing manufacturers to develop and promote eco-friendlier crop protection formulations and integrated pest management (IPM) strategies. This trend encourages the adoption of biologicals and lower-impact synthetic chemistries. Competitive dynamics are intense, characterized by ongoing product innovation, strategic collaborations, and market consolidation. Companies are investing heavily in R&D to develop novel active ingredients, resistant management strategies, and formulations that meet regulatory demands and consumer expectations. The increasing prevalence of weed and pest resistance to existing chemistries necessitates a continuous pipeline of new solutions, contributing to market expansion. The CAGR for the U.S. Crop Protection Chemicals Industry is projected to be approximately xx%, with market penetration expected to reach xx% by 2033. The industry is also seeing a rise in demand for specialized solutions catering to niche markets and specific crop types, further diversifying market opportunities. The focus on sustainable agriculture practices is indirectly driving the market by highlighting the need for advanced crop protection tools that minimize environmental footprints.
Dominant Markets & Segments in U.S. Crop Protection Chemicals Industry
The U.S. Crop Protection Chemicals Industry is characterized by dominance across several key segments, driven by distinct agricultural practices, crop types, and application methods.
Dominant Function: Herbicides represent the largest segment within the U.S. Crop Protection Chemicals Industry.
- Key Drivers: The widespread cultivation of major row crops like corn, soybeans, and wheat, which are highly susceptible to weed competition, significantly contributes to herbicide dominance.
- Detailed Dominance Analysis: The relentless challenge of weed resistance necessitates the continuous development and application of novel herbicide formulations. Government policies supporting crop insurance and farm subsidies indirectly bolster the economic viability of using herbicides to protect yield potential.
Dominant Application Mode: Foliar application remains the most prevalent application mode.
- Key Drivers: Its versatility, effectiveness in delivering active ingredients directly to plant surfaces for rapid action, and compatibility with a wide range of crop types make it a preferred choice for farmers.
- Detailed Dominance Analysis: While newer methods like chemigation and seed treatments are gaining traction, foliar sprays continue to be the backbone of many pest and disease management programs due to their established efficacy and broad applicability across various crops and growth stages.
Dominant Crop Type: Commercial Crops, primarily grains and cereals like corn and soybeans, constitute the largest crop type segment.
- Key Drivers: The vast acreage dedicated to these crops in the U.S., coupled with their significant contribution to the national agricultural output and export market, drives substantial demand for crop protection chemicals.
- Detailed Dominance Analysis: The economic importance of these crops, coupled with their susceptibility to a wide array of pests, diseases, and weeds, makes them a focal point for crop protection research, development, and market penetration. Investment in these sectors directly translates to higher spending on crop protection solutions.
U.S. Crop Protection Chemicals Industry Product Developments
Recent product developments in the U.S. Crop Protection Chemicals Industry highlight a strategic focus on sustainability, efficacy, and addressing evolving market needs. Nufarm's April 2023 launch of Tourney EZ, a liquid formulation fungicide exclusively for turf and ornamental crops, exemplifies a targeted approach to meet specific customer demands and strengthen its market presence in specialized segments. Concurrently, American Vanguard Corporation (AMVAC) responded to the critical issue of weed resistance in maize with its March 2023 introduction of a portfolio of herbicides, including Impact Core and Sinate, offering farmers new tools to combat recalcitrant weeds. These innovations underscore a commitment to providing effective solutions for prevalent agricultural challenges, enhancing crop yields and farm profitability.
Report Scope & Segmentation Analysis
This report provides a comprehensive analysis of the U.S. Crop Protection Chemicals Industry segmented by Function, Application Mode, and Crop Type. The Function segmentation includes Fungicides, Herbicides, Insecticides, Molluscicides, and Nematicides, each with distinct market dynamics driven by pest prevalence and crop susceptibility. The Application Mode segmentation covers Chemigation, Foliar, Fumigation, Seed Treatment, and Soil Treatment, reflecting varying application technologies and their adoption rates. Finally, the Crop Type segmentation analyzes Commercial Crops, Fruits & Vegetables, Grains & Cereals, Pulses & Oilseeds, and Turf & Ornamental, detailing the unique crop protection needs and market sizes for each. Growth projections for these segments are meticulously analyzed, considering market sizes and competitive landscapes to offer a granular understanding of the industry's trajectory.
Key Drivers of U.S. Crop Protection Chemicals Industry Growth
Several key factors are driving the growth of the U.S. Crop Protection Chemicals Industry.
- Technological Advancements: Innovations in precision agriculture, including drone application and AI-driven pest identification, enable more targeted and efficient use of crop protection chemicals, leading to better outcomes and reduced waste.
- Increasing Food Demand: The growing global population and rising demand for food products necessitate increased agricultural output, which in turn drives the need for effective crop protection to minimize yield losses.
- Regulatory Evolution: While stringent, evolving regulations also create opportunities for companies developing compliant, advanced, and environmentally friendly crop protection solutions.
- Pest and Disease Resistance: The continuous evolution of pest and disease resistance to existing chemicals mandates ongoing research and development of new, more potent solutions.
Challenges in the U.S. Crop Protection Chemicals Industry Sector
The U.S. Crop Protection Chemicals Industry faces several significant challenges.
- Stringent Regulatory Hurdles: The complex and time-consuming regulatory approval process for new crop protection chemicals can significantly delay market entry and increase development costs, with stringent efficacy and safety standards often proving difficult to meet.
- Public Perception and Environmental Concerns: Growing public awareness and concern regarding the environmental impact and potential health risks associated with synthetic pesticides create pressure for reduced usage and the development of alternatives.
- Supply Chain Volatility: Global disruptions, geopolitical events, and raw material availability can impact the production and distribution of crop protection chemicals, leading to price fluctuations and potential shortages.
- Resistance Development: The increasing resistance of pests and weeds to existing chemical treatments requires continuous innovation, a costly and time-consuming endeavor, and can diminish the effectiveness of established products.
Emerging Opportunities in U.S. Crop Protection Chemicals Industry
The U.S. Crop Protection Chemicals Industry is ripe with emerging opportunities.
- Biopesticides and Biological Solutions: The growing consumer and regulatory preference for sustainable agriculture is fueling demand for biopesticides, microbial agents, and other biological crop protection products.
- Precision Agriculture Integration: The integration of crop protection chemicals with advanced precision agriculture technologies, such as sensor-based application and AI-driven diagnostics, offers opportunities for more targeted and efficient solutions.
- Specialty Crop Markets: The increasing demand for fruits, vegetables, and specialty crops presents opportunities for tailored crop protection solutions that address specific pest and disease challenges in these high-value segments.
- Sustainable Formulations and Delivery Systems: Development of novel formulations that reduce environmental impact, improve efficacy, and enhance farmer safety, alongside innovative delivery systems like encapsulation and controlled-release technologies, represents a significant growth area.
Leading Players in the U.S. Crop Protection Chemicals Industry Market
- Sumitomo Chemical Co Ltd
- American Vanguard Corporation
- ADAMA Agricultural Solutions Ltd
- Bayer AG
- Syngenta Group
- BASF SE
- FMC Corporation
- UPL Limited
- Corteva Agriscience
- Nufarm Ltd
Key Developments in U.S. Crop Protection Chemicals Industry Industry
- April 2023: Nufarm launched a new liquid formulation fungicide, Tourney EZ, exclusively for turf and ornamental crops based on customer demand, which further strengthens the company's role in turf and ornamental crop protection.
- March 2023: AMVAC launched a portfolio of herbicides, including Impact Core and Sinate, to combat weed resistance in maize.
- January 2023: Bayer formed a new partnership with Oerth Bio to enhance crop protection technology and create more eco-friendly crop protection solutions.
Strategic Outlook for U.S. Crop Protection Chemicals Industry Market
The strategic outlook for the U.S. Crop Protection Chemicals Industry is characterized by innovation, sustainability, and market consolidation. Companies are increasingly focusing on developing integrated pest management (IPM) solutions that combine synthetic chemistry with biologicals and digital tools. The drive towards precision agriculture will continue to shape product development, emphasizing targeted application and reduced environmental impact. Strategic partnerships and acquisitions are expected to intensify as companies seek to expand their product portfolios, gain access to new technologies, and strengthen their market positions in an effort to meet the evolving demands of modern agriculture and ensure global food security. The industry is poised for continued growth, driven by the persistent need for effective crop protection solutions in a dynamic agricultural landscape.
U.S. Crop Protection Chemicals Industry Segmentation
-
1. Function
- 1.1. Fungicide
- 1.2. Herbicide
- 1.3. Insecticide
- 1.4. Molluscicide
- 1.5. Nematicide
-
2. Application Mode
- 2.1. Chemigation
- 2.2. Foliar
- 2.3. Fumigation
- 2.4. Seed Treatment
- 2.5. Soil Treatment
-
3. Crop Type
- 3.1. Commercial Crops
- 3.2. Fruits & Vegetables
- 3.3. Grains & Cereals
- 3.4. Pulses & Oilseeds
- 3.5. Turf & Ornamental
-
4. Function
- 4.1. Fungicide
- 4.2. Herbicide
- 4.3. Insecticide
- 4.4. Molluscicide
- 4.5. Nematicide
-
5. Application Mode
- 5.1. Chemigation
- 5.2. Foliar
- 5.3. Fumigation
- 5.4. Seed Treatment
- 5.5. Soil Treatment
-
6. Crop Type
- 6.1. Commercial Crops
- 6.2. Fruits & Vegetables
- 6.3. Grains & Cereals
- 6.4. Pulses & Oilseeds
- 6.5. Turf & Ornamental
U.S. Crop Protection Chemicals Industry Segmentation By Geography
- 1. U.S.
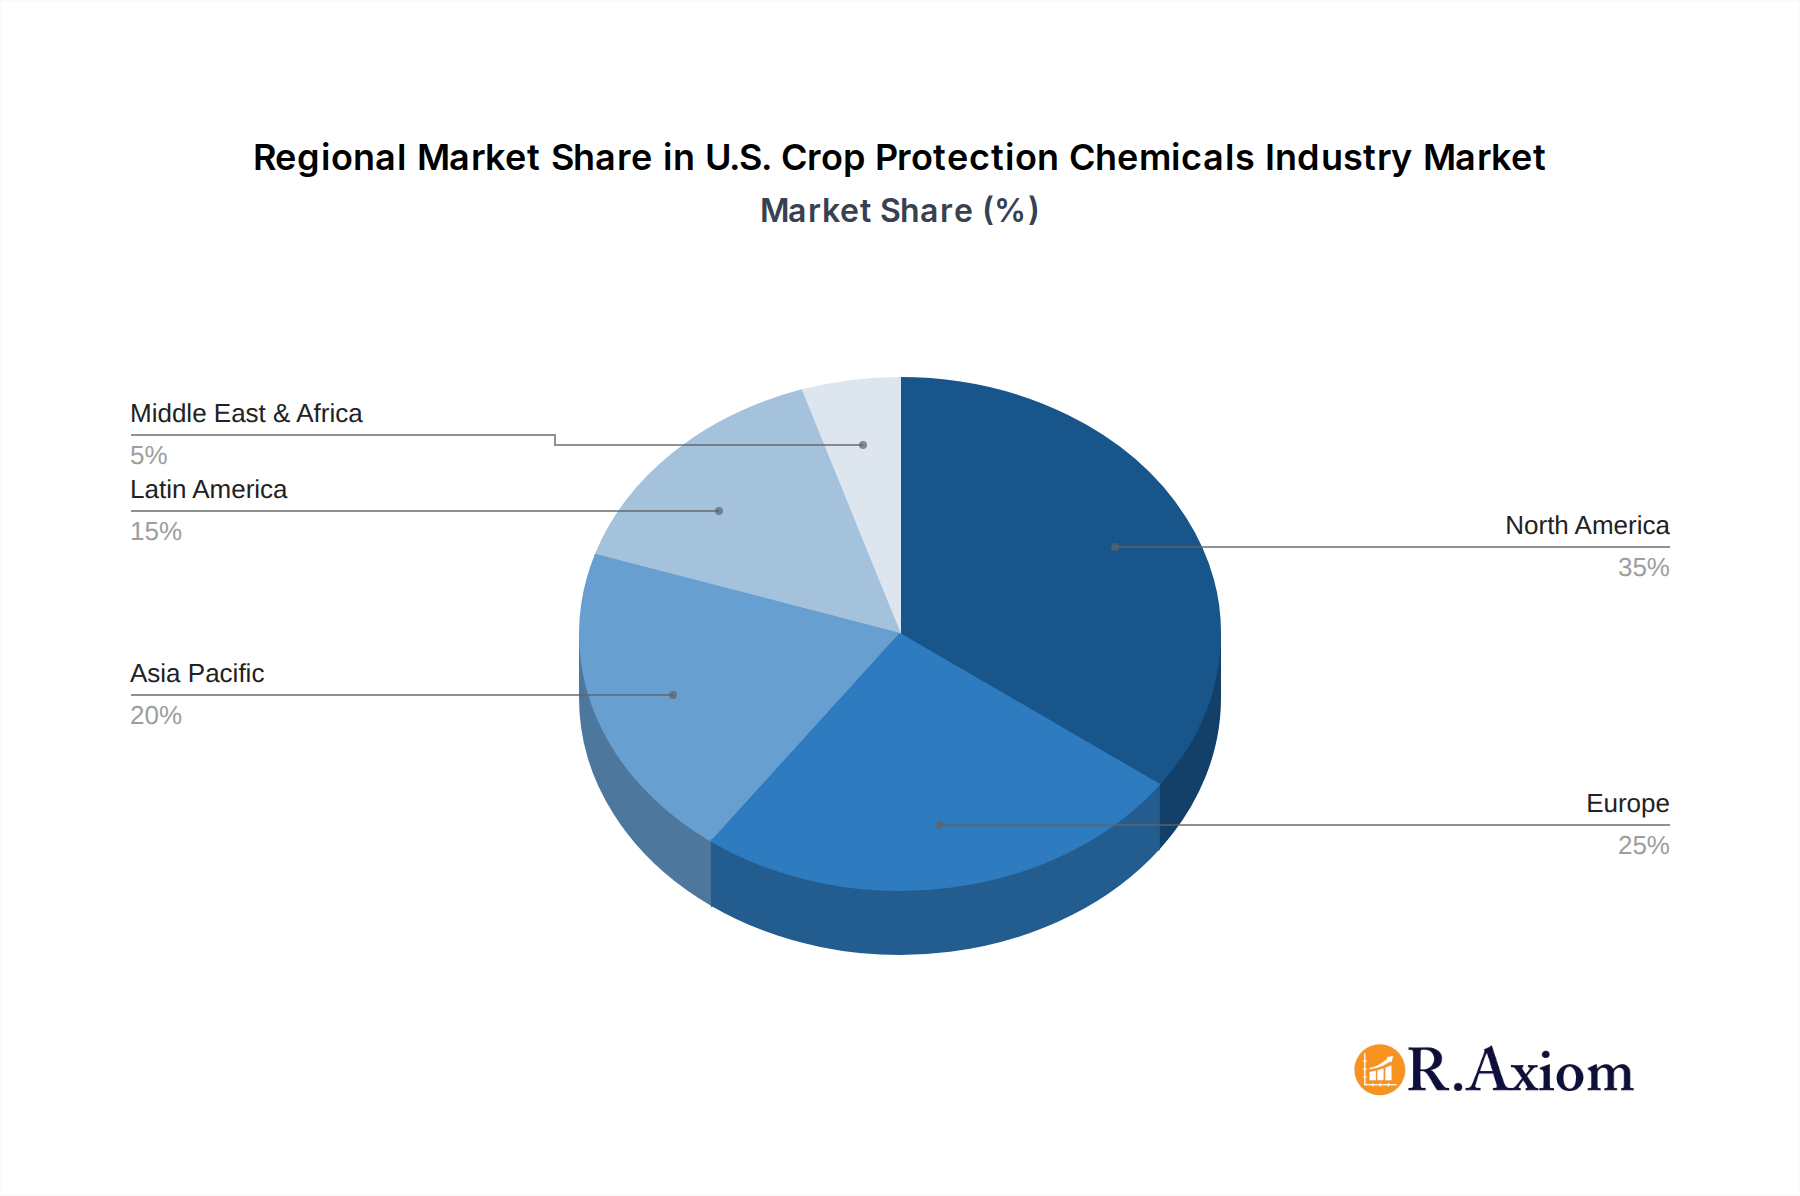
U.S. Crop Protection Chemicals Industry Regional Market Share
Geographic Coverage of U.S. Crop Protection Chemicals Industry
U.S. Crop Protection Chemicals Industry REPORT HIGHLIGHTS
| Aspects | Details |
|---|---|
| Study Period | 2020-2034 |
| Base Year | 2025 |
| Estimated Year | 2026 |
| Forecast Period | 2026-2034 |
| Historical Period | 2020-2025 |
| Growth Rate | CAGR of 5% from 2020-2034 |
| Segmentation |
|
Table of Contents
- 1. Introduction
- 1.1. Research Scope
- 1.2. Market Segmentation
- 1.3. Research Objective
- 1.4. Definitions and Assumptions
- 2. Executive Summary
- 2.1. Market Snapshot
- 3. Market Dynamics
- 3.1. Market Drivers
- 3.2. Market Restrains
- 3.3. Market Trends
- 3.4. Market Opportunities
- 4. Market Factor Analysis
- 4.1. Porters Five Forces
- 4.1.1. Bargaining Power of Suppliers
- 4.1.2. Bargaining Power of Buyers
- 4.1.3. Threat of New Entrants
- 4.1.4. Threat of Substitutes
- 4.1.5. Competitive Rivalry
- 4.2. PESTEL analysis
- 4.3. BCG Analysis
- 4.3.1. Stars (High Growth, High Market Share)
- 4.3.2. Cash Cows (Low Growth, High Market Share)
- 4.3.3. Question Mark (High Growth, Low Market Share)
- 4.3.4. Dogs (Low Growth, Low Market Share)
- 4.4. Ansoff Matrix Analysis
- 4.5. Supply Chain Analysis
- 4.6. Regulatory Landscape
- 4.7. Current Market Potential and Opportunity Assessment (TAM–SAM–SOM Framework)
- 4.8. RAX Analyst Note
- 4.1. Porters Five Forces
- 5. Market Analysis, Insights and Forecast 2021-2033
- 5.1. Market Analysis, Insights and Forecast - by Function
- 5.1.1. Fungicide
- 5.1.2. Herbicide
- 5.1.3. Insecticide
- 5.1.4. Molluscicide
- 5.1.5. Nematicide
- 5.2. Market Analysis, Insights and Forecast - by Application Mode
- 5.2.1. Chemigation
- 5.2.2. Foliar
- 5.2.3. Fumigation
- 5.2.4. Seed Treatment
- 5.2.5. Soil Treatment
- 5.3. Market Analysis, Insights and Forecast - by Crop Type
- 5.3.1. Commercial Crops
- 5.3.2. Fruits & Vegetables
- 5.3.3. Grains & Cereals
- 5.3.4. Pulses & Oilseeds
- 5.3.5. Turf & Ornamental
- 5.4. Market Analysis, Insights and Forecast - by Function
- 5.4.1. Fungicide
- 5.4.2. Herbicide
- 5.4.3. Insecticide
- 5.4.4. Molluscicide
- 5.4.5. Nematicide
- 5.5. Market Analysis, Insights and Forecast - by Application Mode
- 5.5.1. Chemigation
- 5.5.2. Foliar
- 5.5.3. Fumigation
- 5.5.4. Seed Treatment
- 5.5.5. Soil Treatment
- 5.6. Market Analysis, Insights and Forecast - by Crop Type
- 5.6.1. Commercial Crops
- 5.6.2. Fruits & Vegetables
- 5.6.3. Grains & Cereals
- 5.6.4. Pulses & Oilseeds
- 5.6.5. Turf & Ornamental
- 5.7. Market Analysis, Insights and Forecast - by Region
- 5.7.1. U.S.
- 5.1. Market Analysis, Insights and Forecast - by Function
- 6. U.S. Crop Protection Chemicals Industry Analysis, Insights and Forecast, 2021-2033
- 6.1. Market Analysis, Insights and Forecast - by Function
- 6.1.1. Fungicide
- 6.1.2. Herbicide
- 6.1.3. Insecticide
- 6.1.4. Molluscicide
- 6.1.5. Nematicide
- 6.2. Market Analysis, Insights and Forecast - by Application Mode
- 6.2.1. Chemigation
- 6.2.2. Foliar
- 6.2.3. Fumigation
- 6.2.4. Seed Treatment
- 6.2.5. Soil Treatment
- 6.3. Market Analysis, Insights and Forecast - by Crop Type
- 6.3.1. Commercial Crops
- 6.3.2. Fruits & Vegetables
- 6.3.3. Grains & Cereals
- 6.3.4. Pulses & Oilseeds
- 6.3.5. Turf & Ornamental
- 6.4. Market Analysis, Insights and Forecast - by Function
- 6.4.1. Fungicide
- 6.4.2. Herbicide
- 6.4.3. Insecticide
- 6.4.4. Molluscicide
- 6.4.5. Nematicide
- 6.5. Market Analysis, Insights and Forecast - by Application Mode
- 6.5.1. Chemigation
- 6.5.2. Foliar
- 6.5.3. Fumigation
- 6.5.4. Seed Treatment
- 6.5.5. Soil Treatment
- 6.6. Market Analysis, Insights and Forecast - by Crop Type
- 6.6.1. Commercial Crops
- 6.6.2. Fruits & Vegetables
- 6.6.3. Grains & Cereals
- 6.6.4. Pulses & Oilseeds
- 6.6.5. Turf & Ornamental
- 6.1. Market Analysis, Insights and Forecast - by Function
- 7. Competitive Analysis
- 7.1. Company Profiles
- 7.1.1 Sumitomo Chemical Co Ltd
- 7.1.1.1. Company Overview
- 7.1.1.2. Products
- 7.1.1.3. Company Financials
- 7.1.1.4. SWOT Analysis
- 7.1.2 American Vanguard Corporation
- 7.1.2.1. Company Overview
- 7.1.2.2. Products
- 7.1.2.3. Company Financials
- 7.1.2.4. SWOT Analysis
- 7.1.3 ADAMA Agricultural Solutions Ltd
- 7.1.3.1. Company Overview
- 7.1.3.2. Products
- 7.1.3.3. Company Financials
- 7.1.3.4. SWOT Analysis
- 7.1.4 Bayer AG
- 7.1.4.1. Company Overview
- 7.1.4.2. Products
- 7.1.4.3. Company Financials
- 7.1.4.4. SWOT Analysis
- 7.1.5 Syngenta Group
- 7.1.5.1. Company Overview
- 7.1.5.2. Products
- 7.1.5.3. Company Financials
- 7.1.5.4. SWOT Analysis
- 7.1.6 BASF SE
- 7.1.6.1. Company Overview
- 7.1.6.2. Products
- 7.1.6.3. Company Financials
- 7.1.6.4. SWOT Analysis
- 7.1.7 FMC Corporation
- 7.1.7.1. Company Overview
- 7.1.7.2. Products
- 7.1.7.3. Company Financials
- 7.1.7.4. SWOT Analysis
- 7.1.8 UPL Limite
- 7.1.8.1. Company Overview
- 7.1.8.2. Products
- 7.1.8.3. Company Financials
- 7.1.8.4. SWOT Analysis
- 7.1.9 Corteva Agriscience
- 7.1.9.1. Company Overview
- 7.1.9.2. Products
- 7.1.9.3. Company Financials
- 7.1.9.4. SWOT Analysis
- 7.1.10 Nufarm Ltd
- 7.1.10.1. Company Overview
- 7.1.10.2. Products
- 7.1.10.3. Company Financials
- 7.1.10.4. SWOT Analysis
- 7.1.1 Sumitomo Chemical Co Ltd
- 7.2. Market Entropy
- 7.2.1 Company's Key Areas Served
- 7.2.2 Recent Developments
- 7.3. Company Market Share Analysis 2025
- 7.3.1 Top 5 Companies Market Share Analysis
- 7.3.2 Top 3 Companies Market Share Analysis
- 7.4. List of Potential Customers
- 8. Research Methodology
List of Figures
- Figure 1: U.S. Crop Protection Chemicals Industry Revenue Breakdown (billion, %) by Product 2025 & 2033
- Figure 2: U.S. Crop Protection Chemicals Industry Share (%) by Company 2025
List of Tables
- Table 1: U.S. Crop Protection Chemicals Industry Revenue billion Forecast, by Function 2020 & 2033
- Table 2: U.S. Crop Protection Chemicals Industry Volume Kiloton Forecast, by Function 2020 & 2033
- Table 3: U.S. Crop Protection Chemicals Industry Revenue billion Forecast, by Application Mode 2020 & 2033
- Table 4: U.S. Crop Protection Chemicals Industry Volume Kiloton Forecast, by Application Mode 2020 & 2033
- Table 5: U.S. Crop Protection Chemicals Industry Revenue billion Forecast, by Crop Type 2020 & 2033
- Table 6: U.S. Crop Protection Chemicals Industry Volume Kiloton Forecast, by Crop Type 2020 & 2033
- Table 7: U.S. Crop Protection Chemicals Industry Revenue billion Forecast, by Function 2020 & 2033
- Table 8: U.S. Crop Protection Chemicals Industry Volume Kiloton Forecast, by Function 2020 & 2033
- Table 9: U.S. Crop Protection Chemicals Industry Revenue billion Forecast, by Application Mode 2020 & 2033
- Table 10: U.S. Crop Protection Chemicals Industry Volume Kiloton Forecast, by Application Mode 2020 & 2033
- Table 11: U.S. Crop Protection Chemicals Industry Revenue billion Forecast, by Crop Type 2020 & 2033
- Table 12: U.S. Crop Protection Chemicals Industry Volume Kiloton Forecast, by Crop Type 2020 & 2033
- Table 13: U.S. Crop Protection Chemicals Industry Revenue billion Forecast, by Region 2020 & 2033
- Table 14: U.S. Crop Protection Chemicals Industry Volume Kiloton Forecast, by Region 2020 & 2033
- Table 15: U.S. Crop Protection Chemicals Industry Revenue billion Forecast, by Function 2020 & 2033
- Table 16: U.S. Crop Protection Chemicals Industry Volume Kiloton Forecast, by Function 2020 & 2033
- Table 17: U.S. Crop Protection Chemicals Industry Revenue billion Forecast, by Application Mode 2020 & 2033
- Table 18: U.S. Crop Protection Chemicals Industry Volume Kiloton Forecast, by Application Mode 2020 & 2033
- Table 19: U.S. Crop Protection Chemicals Industry Revenue billion Forecast, by Crop Type 2020 & 2033
- Table 20: U.S. Crop Protection Chemicals Industry Volume Kiloton Forecast, by Crop Type 2020 & 2033
- Table 21: U.S. Crop Protection Chemicals Industry Revenue billion Forecast, by Function 2020 & 2033
- Table 22: U.S. Crop Protection Chemicals Industry Volume Kiloton Forecast, by Function 2020 & 2033
- Table 23: U.S. Crop Protection Chemicals Industry Revenue billion Forecast, by Application Mode 2020 & 2033
- Table 24: U.S. Crop Protection Chemicals Industry Volume Kiloton Forecast, by Application Mode 2020 & 2033
- Table 25: U.S. Crop Protection Chemicals Industry Revenue billion Forecast, by Crop Type 2020 & 2033
- Table 26: U.S. Crop Protection Chemicals Industry Volume Kiloton Forecast, by Crop Type 2020 & 2033
- Table 27: U.S. Crop Protection Chemicals Industry Revenue billion Forecast, by Country 2020 & 2033
- Table 28: U.S. Crop Protection Chemicals Industry Volume Kiloton Forecast, by Country 2020 & 2033
Frequently Asked Questions
1. What is the projected Compound Annual Growth Rate (CAGR) of the U.S. Crop Protection Chemicals Industry?
The projected CAGR is approximately 5%.
2. Which companies are prominent players in the U.S. Crop Protection Chemicals Industry?
Key companies in the market include Sumitomo Chemical Co Ltd, American Vanguard Corporation, ADAMA Agricultural Solutions Ltd, Bayer AG, Syngenta Group, BASF SE, FMC Corporation, UPL Limite, Corteva Agriscience, Nufarm Ltd.
3. What are the main segments of the U.S. Crop Protection Chemicals Industry?
The market segments include Function, Application Mode, Crop Type, Function, Application Mode, Crop Type.
4. Can you provide details about the market size?
The market size is estimated to be USD 83.32 billion as of 2022.
5. What are some drivers contributing to market growth?
Seed Treatment As A Solution To Enhance Yield; Growing Awareness For Seed Treatment Among The Farmers; Rising Trend Of Organic Farming.
6. What are the notable trends driving market growth?
Rise in weed infestations. shortage of labor. increased wages. and need for higher food production may drive the herbicide market in the country.
7. Are there any restraints impacting market growth?
Limitations Across Farm-Level Seed Treatment; Rising Environmental Concerns.
8. Can you provide examples of recent developments in the market?
April 2023: Nufarm launched a new liquid formulation fungicide, Tourney EZ, exclusively for turf and ornamental crops based on customer demand, which further strengthens the company's role in turf and ornamental crop protection.March 2023: AMVAC launched a portfolio of herbicides, including Impact Core and Sinate, to combat weed resistance in maize.January 2023: Bayer formed a new partnership with Oerth Bio to enhance crop protection technology and create more eco-friendly crop protection solutions.
9. What pricing options are available for accessing the report?
Pricing options include single-user, multi-user, and enterprise licenses priced at USD 3800, USD 4500, and USD 5800 respectively.
10. Is the market size provided in terms of value or volume?
The market size is provided in terms of value, measured in billion and volume, measured in Kiloton.
11. Are there any specific market keywords associated with the report?
Yes, the market keyword associated with the report is "U.S. Crop Protection Chemicals Industry," which aids in identifying and referencing the specific market segment covered.
12. How do I determine which pricing option suits my needs best?
The pricing options vary based on user requirements and access needs. Individual users may opt for single-user licenses, while businesses requiring broader access may choose multi-user or enterprise licenses for cost-effective access to the report.
13. Are there any additional resources or data provided in the U.S. Crop Protection Chemicals Industry report?
While the report offers comprehensive insights, it's advisable to review the specific contents or supplementary materials provided to ascertain if additional resources or data are available.
14. How can I stay updated on further developments or reports in the U.S. Crop Protection Chemicals Industry?
To stay informed about further developments, trends, and reports in the U.S. Crop Protection Chemicals Industry, consider subscribing to industry newsletters, following relevant companies and organizations, or regularly checking reputable industry news sources and publications.
Methodology
Step 1 - Identification of Relevant Samples Size from Population Database


Step 2 - Approaches for Defining Global Market Size (Value, Volume* & Price*)

Note*: In applicable scenarios
Step 3 - Data Sources
Primary Research
- Web Analytics
- Survey Reports
- Research Institute
- Latest Research Reports
- Opinion Leaders
Secondary Research
- Annual Reports
- White Paper
- Latest Press Release
- Industry Association
- Paid Database
- Investor Presentations

Step 4 - Data Triangulation
Involves using different sources of information in order to increase the validity of a study
These sources are likely to be stakeholders in a program - participants, other researchers, program staff, other community members, and so on.
Then we put all data in single framework & apply various statistical tools to find out the dynamic on the market.
During the analysis stage, feedback from the stakeholder groups would be compared to determine areas of agreement as well as areas of divergence