

Key Insights
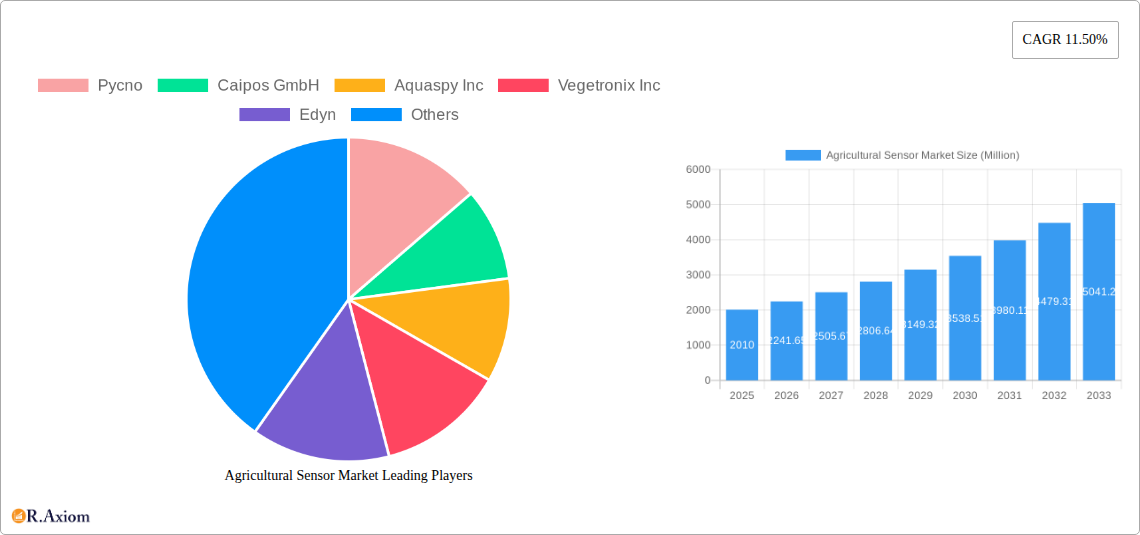
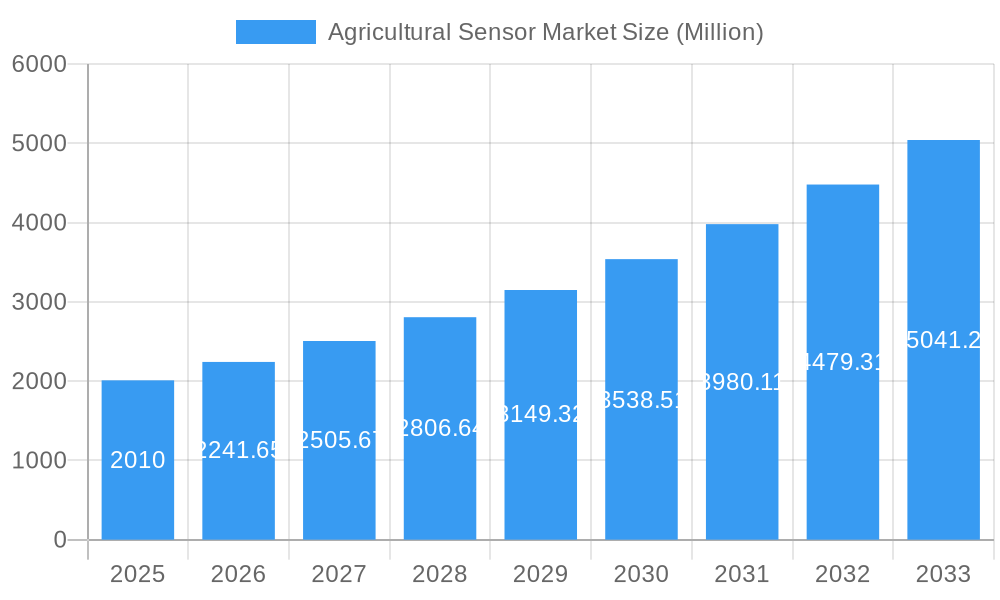
The global agricultural sensor market, valued at $2.01 billion in 2025, is experiencing robust growth, projected to expand at a Compound Annual Growth Rate (CAGR) of 11.50% from 2025 to 2033. This surge is driven by several key factors. Precision agriculture, a farming approach leveraging technology for optimized resource management, is a major catalyst. Farmers are increasingly adopting sensors to monitor crucial parameters like soil moisture, temperature, humidity, and nutrient levels, leading to enhanced crop yields, reduced input costs (water, fertilizer, pesticides), and improved sustainability. Furthermore, the rising global population and the consequent demand for increased food production are fueling the market's expansion. Government initiatives promoting technological advancements in agriculture, coupled with the growing adoption of IoT (Internet of Things) devices for data collection and analysis, are further contributing to this growth. The market is segmented by sensor type (humidity, electrochemical, mechanical, airflow, optical, pressure, water, soil, livestock, and others) and application (dairy, soil, climate, and water management). While technological advancements and rising adoption are significant drivers, challenges like high initial investment costs, lack of awareness among farmers in certain regions, and the need for reliable internet connectivity in remote farming areas could potentially restrain market growth to some extent. However, the long-term benefits of enhanced efficiency and profitability are expected to outweigh these challenges. The Asia-Pacific region, particularly countries like India and China with their vast agricultural sectors, is expected to exhibit strong growth, followed by North America and Europe.
Agricultural Sensor Market Market Size (In Billion)
The competitive landscape is characterized by a mix of established players and emerging startups. Companies like Pycno, Caipos GmbH, Aquaspy Inc, and others are innovating and expanding their product portfolios to cater to the evolving needs of the precision agriculture industry. Strategic partnerships, mergers and acquisitions, and product diversification are key strategies being employed by companies to strengthen their market position and expand their reach. The continuous development of advanced sensor technologies, including those with enhanced accuracy, durability, and wireless connectivity, will be a significant factor shaping the market's trajectory in the coming years. The integration of artificial intelligence (AI) and machine learning (ML) capabilities into sensor systems will further enhance data analysis and predictive capabilities, leading to more informed decision-making for farmers and ultimately contributing to a more sustainable and efficient agricultural sector.
Agricultural Sensor Market Company Market Share
Agricultural Sensor Market: A Comprehensive Report (2019-2033)
This in-depth report provides a comprehensive analysis of the Agricultural Sensor Market, offering invaluable insights for stakeholders across the agricultural technology sector. Covering the period from 2019 to 2033, with a focus on 2025, this report dissects market trends, competitive dynamics, and future growth projections. The study includes detailed segmentation by sensor type and application, revealing lucrative opportunities and potential challenges.
Agricultural Sensor Market Market Concentration & Innovation
The Agricultural Sensor Market exhibits a moderately concentrated landscape, with several key players vying for market share. Market concentration is influenced by factors such as technological advancements, regulatory compliance, and the increasing demand for precision agriculture solutions. While a few established companies hold significant market share (estimated at xx%), the market also displays considerable innovation. This is driven by the ongoing development of more sophisticated sensors, improved data analytics, and the integration of IoT technologies.
Market Concentration Metrics (Estimated 2025):
- Top 5 players' combined market share: xx%
- Average M&A deal value (2019-2024): $xx Million
Innovation Drivers:
- Miniaturization and improved sensor accuracy.
- Integration with IoT and cloud-based platforms for data analysis.
- Development of wireless sensor networks for remote monitoring.
- Growing adoption of AI and machine learning for data interpretation.
Regulatory Landscape & Substitutes:
- Stringent regulatory standards for sensor accuracy and data security.
- Limited presence of direct substitutes, but traditional methods like manual monitoring remain competitive.
M&A Activity: Recent mergers and acquisitions indicate a trend toward consolidation within the industry, aimed at enhancing technological capabilities, expanding market reach, and optimizing operational efficiencies.
Agricultural Sensor Market Industry Trends & Insights
The Agricultural Sensor Market is experiencing robust growth, driven by several key factors. The increasing adoption of precision agriculture techniques, coupled with the need for efficient resource management and improved crop yields, is fueling market expansion. Technological disruptions, such as the development of low-cost sensors and advanced data analytics, are also contributing significantly. Consumer preferences are shifting towards sustainable and efficient farming practices, further driving demand for agricultural sensors.
Key Market Trends:
- Growing adoption of precision agriculture: Farmers are increasingly relying on data-driven insights to optimize their operations.
- Technological advancements: New sensor technologies offer improved accuracy, reliability, and affordability.
- Increased connectivity: IoT integration enables real-time data monitoring and remote management.
- Rising demand for data analytics: Sophisticated software solutions are crucial for extracting actionable insights from sensor data.
- Focus on sustainability: Sensors play a vital role in optimizing water and fertilizer use, promoting sustainable farming.
The market is projected to witness a CAGR of xx% during the forecast period (2025-2033), with market penetration expected to reach xx% by 2033.
Dominant Markets & Segments in Agricultural Sensor Market
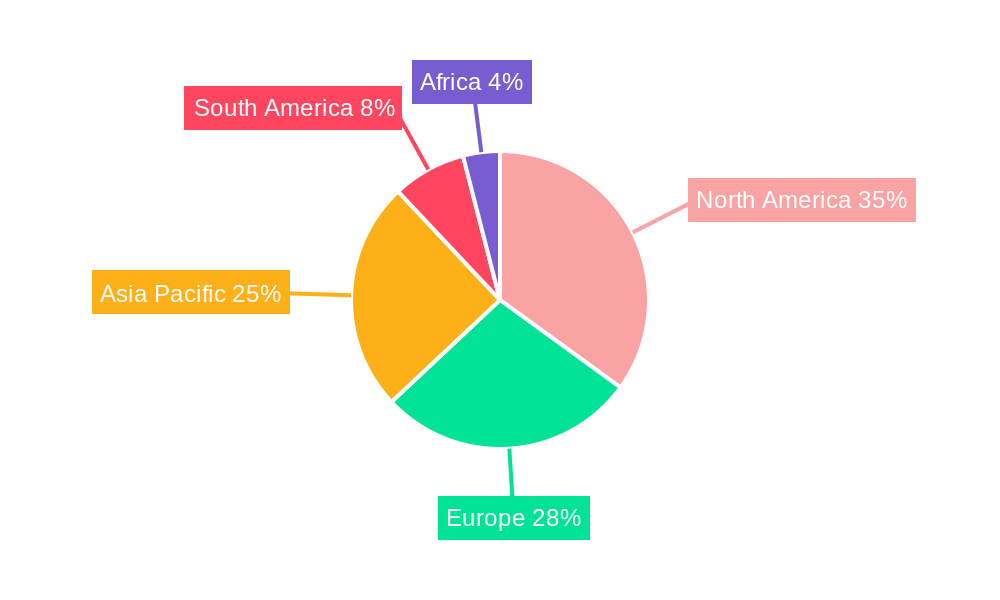
The North American region currently dominates the Agricultural Sensor Market, followed by Europe. Within these regions, specific countries with advanced agricultural practices and robust technological infrastructure exhibit higher market penetration.
Dominant Segments:
By Type: Soil sensors are currently the most dominant segment, driven by their crucial role in monitoring soil moisture, nutrients, and temperature. This is followed closely by water sensors.
By Application: Soil management applications hold the largest market share, reflecting the importance of precise soil monitoring for optimal crop production.
Key Drivers of Regional Dominance:
- North America: Advanced agricultural technologies, high adoption rates of precision agriculture, and significant investments in agricultural research and development.
- Europe: Stringent environmental regulations promoting sustainable farming practices, along with a high level of technological sophistication in the agricultural sector.
Agricultural Sensor Market Product Developments
Recent innovations in agricultural sensors include the development of miniaturized sensors with enhanced accuracy and durability. New sensor types capable of measuring a wider range of parameters are emerging. The integration of IoT technologies enables real-time data transmission and remote monitoring capabilities, contributing to improved farm management and decision-making. These advancements enhance competitiveness by offering farmers precise, actionable information leading to increased yield, reduced input costs, and improved sustainability.
Report Scope & Segmentation Analysis
This report segments the Agricultural Sensor Market by sensor type (Humidity Sensor, Electrochemical Sensor, Mechanical Sensor, Airflow Sensor, Optical Sensor, Pressure Sensor, Water Sensor, Soil Sensor, Livestock Sensor, Other Types) and application (Dairy Management, Soil Management, Climate Management, Water Management). Each segment's growth projection, market size (in Million USD), and competitive dynamics are analyzed in detail. For instance, the soil sensor segment is expected to grow at a CAGR of xx% due to its crucial role in optimizing irrigation and fertilization. The water management application segment is projected to show significant growth due to increasing water scarcity concerns.
Key Drivers of Agricultural Sensor Market Growth
Several factors contribute to the growth of the Agricultural Sensor Market. Technological advancements, like the development of low-cost, highly accurate sensors, and the integration of IoT technologies, are key drivers. Economic incentives, such as government subsidies for precision agriculture adoption, further stimulate market expansion. Increasing consumer demand for sustainably produced food also underpins the growing need for efficient and precise resource management in agriculture, significantly driving demand for these sensors.
Challenges in the Agricultural Sensor Market Sector
The Agricultural Sensor Market faces certain challenges, including the high initial investment costs associated with implementing sensor networks. Interoperability issues between different sensor systems and data integration complexities can also hinder broader adoption. Competition from established players and new entrants can impact market share, and data security concerns related to sensitive farm information present a significant challenge to overcome. These factors contribute to a variable rate of adoption across different farming communities.
Emerging Opportunities in Agricultural Sensor Market
Emerging opportunities exist in the development of advanced sensor technologies capable of integrating data from multiple sources, enabling comprehensive farm management solutions. The application of AI and machine learning to process and interpret sensor data offers potential for improved decision-making and optimized resource management. Expanding markets in developing countries with a growing agricultural sector present significant opportunities for growth. Focus on user-friendly interfaces and affordable sensor solutions for smallholder farmers is crucial.
Leading Players in the Agricultural Sensor Market Market
- Pycno
- Caipos GmbH
- Aquaspy Inc
- Vegetronix Inc
- Edyn
- Libelium Comunicaciones Distribuidas Sl
- Crop
- Agsmarts Inc
- Acclima Inc
- Acquity Agriculture
- Auroras
- Sentek Ltd
Key Developments in Agricultural Sensor Market Industry
- August 2022: CropX Technologies launched continuous nitrogen leaching monitoring capability, providing continuous monitoring of nitrogen leaching events, making nitrogen management more efficient.
- October 2022: Reinke Irrigation partnered with CropX Technologies to optimize water use in crop production, leveraging data-driven insights for improved efficiency.
- January 2023: CropX Technologies acquired Tule Technologies, expanding its market reach and incorporating new data capture technologies.
Strategic Outlook for Agricultural Sensor Market Market
The Agricultural Sensor Market is poised for sustained growth, driven by ongoing technological advancements, increasing adoption of precision agriculture, and the growing focus on sustainable farming practices. Emerging markets and the development of innovative solutions will create significant opportunities for market expansion in the coming years. The market’s future success relies on addressing challenges related to cost, data integration, and security, alongside fostering wider adoption among smaller farming operations.
Agricultural Sensor Market Segmentation
- 1. Production Analysis
- 2. Consumption Analysis
- 3. Import Market Analysis (Value & Volume)
- 4. Export Market Analysis (Value & Volume)
- 5. Price Trend Analysis
Agricultural Sensor Market Segmentation By Geography
-
1. North America
- 1.1. United States
- 1.2. Canada
- 1.3. Mexico
-
2. South America
- 2.1. Brazil
- 2.2. Argentina
- 2.3. Rest of South America
-
3. Europe
- 3.1. United Kingdom
- 3.2. Germany
- 3.3. France
- 3.4. Italy
- 3.5. Spain
- 3.6. Russia
- 3.7. Benelux
- 3.8. Nordics
- 3.9. Rest of Europe
-
4. Middle East & Africa
- 4.1. Turkey
- 4.2. Israel
- 4.3. GCC
- 4.4. North Africa
- 4.5. South Africa
- 4.6. Rest of Middle East & Africa
-
5. Asia Pacific
- 5.1. China
- 5.2. India
- 5.3. Japan
- 5.4. South Korea
- 5.5. ASEAN
- 5.6. Oceania
- 5.7. Rest of Asia Pacific
Agricultural Sensor Market Regional Market Share
Geographic Coverage of Agricultural Sensor Market
Agricultural Sensor Market REPORT HIGHLIGHTS
| Aspects | Details |
|---|---|
| Study Period | 2020-2034 |
| Base Year | 2025 |
| Estimated Year | 2026 |
| Forecast Period | 2026-2034 |
| Historical Period | 2020-2025 |
| Growth Rate | CAGR of 11.50% from 2020-2034 |
| Segmentation |
|
Table of Contents
- 1. Introduction
- 1.1. Research Scope
- 1.2. Market Segmentation
- 1.3. Research Objective
- 1.4. Definitions and Assumptions
- 2. Executive Summary
- 2.1. Market Snapshot
- 3. Market Dynamics
- 3.1. Market Drivers
- 3.2. Market Restrains
- 3.3. Market Trends
- 3.4. Market Opportunities
- 4. Market Factor Analysis
- 4.1. Porters Five Forces
- 4.1.1. Bargaining Power of Suppliers
- 4.1.2. Bargaining Power of Buyers
- 4.1.3. Threat of New Entrants
- 4.1.4. Threat of Substitutes
- 4.1.5. Competitive Rivalry
- 4.2. PESTEL analysis
- 4.3. BCG Analysis
- 4.3.1. Stars (High Growth, High Market Share)
- 4.3.2. Cash Cows (Low Growth, High Market Share)
- 4.3.3. Question Mark (High Growth, Low Market Share)
- 4.3.4. Dogs (Low Growth, Low Market Share)
- 4.4. Ansoff Matrix Analysis
- 4.5. Supply Chain Analysis
- 4.6. Regulatory Landscape
- 4.7. Current Market Potential and Opportunity Assessment (TAM–SAM–SOM Framework)
- 4.8. RAX Analyst Note
- 4.1. Porters Five Forces
- 5. Market Analysis, Insights and Forecast 2021-2033
- 5.1. Market Analysis, Insights and Forecast - by Production Analysis
- 5.2. Market Analysis, Insights and Forecast - by Consumption Analysis
- 5.3. Market Analysis, Insights and Forecast - by Import Market Analysis (Value & Volume)
- 5.4. Market Analysis, Insights and Forecast - by Export Market Analysis (Value & Volume)
- 5.5. Market Analysis, Insights and Forecast - by Price Trend Analysis
- 5.6. Market Analysis, Insights and Forecast - by Region
- 5.6.1. North America
- 5.6.2. South America
- 5.6.3. Europe
- 5.6.4. Middle East & Africa
- 5.6.5. Asia Pacific
- 6. Global Agricultural Sensor Market Analysis, Insights and Forecast, 2021-2033
- 6.1. Market Analysis, Insights and Forecast - by Production Analysis
- 6.2. Market Analysis, Insights and Forecast - by Consumption Analysis
- 6.3. Market Analysis, Insights and Forecast - by Import Market Analysis (Value & Volume)
- 6.4. Market Analysis, Insights and Forecast - by Export Market Analysis (Value & Volume)
- 6.5. Market Analysis, Insights and Forecast - by Price Trend Analysis
- 7. North America Agricultural Sensor Market Analysis, Insights and Forecast, 2020-2032
- 7.1. Market Analysis, Insights and Forecast - by Production Analysis
- 7.2. Market Analysis, Insights and Forecast - by Consumption Analysis
- 7.3. Market Analysis, Insights and Forecast - by Import Market Analysis (Value & Volume)
- 7.4. Market Analysis, Insights and Forecast - by Export Market Analysis (Value & Volume)
- 7.5. Market Analysis, Insights and Forecast - by Price Trend Analysis
- 8. South America Agricultural Sensor Market Analysis, Insights and Forecast, 2020-2032
- 8.1. Market Analysis, Insights and Forecast - by Production Analysis
- 8.2. Market Analysis, Insights and Forecast - by Consumption Analysis
- 8.3. Market Analysis, Insights and Forecast - by Import Market Analysis (Value & Volume)
- 8.4. Market Analysis, Insights and Forecast - by Export Market Analysis (Value & Volume)
- 8.5. Market Analysis, Insights and Forecast - by Price Trend Analysis
- 9. Europe Agricultural Sensor Market Analysis, Insights and Forecast, 2020-2032
- 9.1. Market Analysis, Insights and Forecast - by Production Analysis
- 9.2. Market Analysis, Insights and Forecast - by Consumption Analysis
- 9.3. Market Analysis, Insights and Forecast - by Import Market Analysis (Value & Volume)
- 9.4. Market Analysis, Insights and Forecast - by Export Market Analysis (Value & Volume)
- 9.5. Market Analysis, Insights and Forecast - by Price Trend Analysis
- 10. Middle East & Africa Agricultural Sensor Market Analysis, Insights and Forecast, 2020-2032
- 10.1. Market Analysis, Insights and Forecast - by Production Analysis
- 10.2. Market Analysis, Insights and Forecast - by Consumption Analysis
- 10.3. Market Analysis, Insights and Forecast - by Import Market Analysis (Value & Volume)
- 10.4. Market Analysis, Insights and Forecast - by Export Market Analysis (Value & Volume)
- 10.5. Market Analysis, Insights and Forecast - by Price Trend Analysis
- 11. Asia Pacific Agricultural Sensor Market Analysis, Insights and Forecast, 2020-2032
- 11.1. Market Analysis, Insights and Forecast - by Production Analysis
- 11.2. Market Analysis, Insights and Forecast - by Consumption Analysis
- 11.3. Market Analysis, Insights and Forecast - by Import Market Analysis (Value & Volume)
- 11.4. Market Analysis, Insights and Forecast - by Export Market Analysis (Value & Volume)
- 11.5. Market Analysis, Insights and Forecast - by Price Trend Analysis
- 12. Competitive Analysis
- 12.1. Company Profiles
- 12.1.1 Pycno
- 12.1.1.1. Company Overview
- 12.1.1.2. Products
- 12.1.1.3. Company Financials
- 12.1.1.4. SWOT Analysis
- 12.1.2 Caipos GmbH
- 12.1.2.1. Company Overview
- 12.1.2.2. Products
- 12.1.2.3. Company Financials
- 12.1.2.4. SWOT Analysis
- 12.1.3 Aquaspy Inc
- 12.1.3.1. Company Overview
- 12.1.3.2. Products
- 12.1.3.3. Company Financials
- 12.1.3.4. SWOT Analysis
- 12.1.4 Vegetronix Inc
- 12.1.4.1. Company Overview
- 12.1.4.2. Products
- 12.1.4.3. Company Financials
- 12.1.4.4. SWOT Analysis
- 12.1.5 Edyn
- 12.1.5.1. Company Overview
- 12.1.5.2. Products
- 12.1.5.3. Company Financials
- 12.1.5.4. SWOT Analysis
- 12.1.6 Libelium Comunicaciones Distribuidas Sl
- 12.1.6.1. Company Overview
- 12.1.6.2. Products
- 12.1.6.3. Company Financials
- 12.1.6.4. SWOT Analysis
- 12.1.7 Crop
- 12.1.7.1. Company Overview
- 12.1.7.2. Products
- 12.1.7.3. Company Financials
- 12.1.7.4. SWOT Analysis
- 12.1.8 Agsmarts Inc
- 12.1.8.1. Company Overview
- 12.1.8.2. Products
- 12.1.8.3. Company Financials
- 12.1.8.4. SWOT Analysis
- 12.1.9 Acclima Inc
- 12.1.9.1. Company Overview
- 12.1.9.2. Products
- 12.1.9.3. Company Financials
- 12.1.9.4. SWOT Analysis
- 12.1.10 Acquity Agriculture
- 12.1.10.1. Company Overview
- 12.1.10.2. Products
- 12.1.10.3. Company Financials
- 12.1.10.4. SWOT Analysis
- 12.1.11 Auroras
- 12.1.11.1. Company Overview
- 12.1.11.2. Products
- 12.1.11.3. Company Financials
- 12.1.11.4. SWOT Analysis
- 12.1.12 Sentek Ltd
- 12.1.12.1. Company Overview
- 12.1.12.2. Products
- 12.1.12.3. Company Financials
- 12.1.12.4. SWOT Analysis
- 12.1.1 Pycno
- 12.2. Market Entropy
- 12.2.1 Company's Key Areas Served
- 12.2.2 Recent Developments
- 12.3. Company Market Share Analysis 2025
- 12.3.1 Top 5 Companies Market Share Analysis
- 12.3.2 Top 3 Companies Market Share Analysis
- 12.4. List of Potential Customers
- 13. Research Methodology
List of Figures
- Figure 1: Global Agricultural Sensor Market Revenue Breakdown (Million, %) by Region 2025 & 2033
- Figure 2: North America Agricultural Sensor Market Revenue (Million), by Production Analysis 2025 & 2033
- Figure 3: North America Agricultural Sensor Market Revenue Share (%), by Production Analysis 2025 & 2033
- Figure 4: North America Agricultural Sensor Market Revenue (Million), by Consumption Analysis 2025 & 2033
- Figure 5: North America Agricultural Sensor Market Revenue Share (%), by Consumption Analysis 2025 & 2033
- Figure 6: North America Agricultural Sensor Market Revenue (Million), by Import Market Analysis (Value & Volume) 2025 & 2033
- Figure 7: North America Agricultural Sensor Market Revenue Share (%), by Import Market Analysis (Value & Volume) 2025 & 2033
- Figure 8: North America Agricultural Sensor Market Revenue (Million), by Export Market Analysis (Value & Volume) 2025 & 2033
- Figure 9: North America Agricultural Sensor Market Revenue Share (%), by Export Market Analysis (Value & Volume) 2025 & 2033
- Figure 10: North America Agricultural Sensor Market Revenue (Million), by Price Trend Analysis 2025 & 2033
- Figure 11: North America Agricultural Sensor Market Revenue Share (%), by Price Trend Analysis 2025 & 2033
- Figure 12: North America Agricultural Sensor Market Revenue (Million), by Country 2025 & 2033
- Figure 13: North America Agricultural Sensor Market Revenue Share (%), by Country 2025 & 2033
- Figure 14: South America Agricultural Sensor Market Revenue (Million), by Production Analysis 2025 & 2033
- Figure 15: South America Agricultural Sensor Market Revenue Share (%), by Production Analysis 2025 & 2033
- Figure 16: South America Agricultural Sensor Market Revenue (Million), by Consumption Analysis 2025 & 2033
- Figure 17: South America Agricultural Sensor Market Revenue Share (%), by Consumption Analysis 2025 & 2033
- Figure 18: South America Agricultural Sensor Market Revenue (Million), by Import Market Analysis (Value & Volume) 2025 & 2033
- Figure 19: South America Agricultural Sensor Market Revenue Share (%), by Import Market Analysis (Value & Volume) 2025 & 2033
- Figure 20: South America Agricultural Sensor Market Revenue (Million), by Export Market Analysis (Value & Volume) 2025 & 2033
- Figure 21: South America Agricultural Sensor Market Revenue Share (%), by Export Market Analysis (Value & Volume) 2025 & 2033
- Figure 22: South America Agricultural Sensor Market Revenue (Million), by Price Trend Analysis 2025 & 2033
- Figure 23: South America Agricultural Sensor Market Revenue Share (%), by Price Trend Analysis 2025 & 2033
- Figure 24: South America Agricultural Sensor Market Revenue (Million), by Country 2025 & 2033
- Figure 25: South America Agricultural Sensor Market Revenue Share (%), by Country 2025 & 2033
- Figure 26: Europe Agricultural Sensor Market Revenue (Million), by Production Analysis 2025 & 2033
- Figure 27: Europe Agricultural Sensor Market Revenue Share (%), by Production Analysis 2025 & 2033
- Figure 28: Europe Agricultural Sensor Market Revenue (Million), by Consumption Analysis 2025 & 2033
- Figure 29: Europe Agricultural Sensor Market Revenue Share (%), by Consumption Analysis 2025 & 2033
- Figure 30: Europe Agricultural Sensor Market Revenue (Million), by Import Market Analysis (Value & Volume) 2025 & 2033
- Figure 31: Europe Agricultural Sensor Market Revenue Share (%), by Import Market Analysis (Value & Volume) 2025 & 2033
- Figure 32: Europe Agricultural Sensor Market Revenue (Million), by Export Market Analysis (Value & Volume) 2025 & 2033
- Figure 33: Europe Agricultural Sensor Market Revenue Share (%), by Export Market Analysis (Value & Volume) 2025 & 2033
- Figure 34: Europe Agricultural Sensor Market Revenue (Million), by Price Trend Analysis 2025 & 2033
- Figure 35: Europe Agricultural Sensor Market Revenue Share (%), by Price Trend Analysis 2025 & 2033
- Figure 36: Europe Agricultural Sensor Market Revenue (Million), by Country 2025 & 2033
- Figure 37: Europe Agricultural Sensor Market Revenue Share (%), by Country 2025 & 2033
- Figure 38: Middle East & Africa Agricultural Sensor Market Revenue (Million), by Production Analysis 2025 & 2033
- Figure 39: Middle East & Africa Agricultural Sensor Market Revenue Share (%), by Production Analysis 2025 & 2033
- Figure 40: Middle East & Africa Agricultural Sensor Market Revenue (Million), by Consumption Analysis 2025 & 2033
- Figure 41: Middle East & Africa Agricultural Sensor Market Revenue Share (%), by Consumption Analysis 2025 & 2033
- Figure 42: Middle East & Africa Agricultural Sensor Market Revenue (Million), by Import Market Analysis (Value & Volume) 2025 & 2033
- Figure 43: Middle East & Africa Agricultural Sensor Market Revenue Share (%), by Import Market Analysis (Value & Volume) 2025 & 2033
- Figure 44: Middle East & Africa Agricultural Sensor Market Revenue (Million), by Export Market Analysis (Value & Volume) 2025 & 2033
- Figure 45: Middle East & Africa Agricultural Sensor Market Revenue Share (%), by Export Market Analysis (Value & Volume) 2025 & 2033
- Figure 46: Middle East & Africa Agricultural Sensor Market Revenue (Million), by Price Trend Analysis 2025 & 2033
- Figure 47: Middle East & Africa Agricultural Sensor Market Revenue Share (%), by Price Trend Analysis 2025 & 2033
- Figure 48: Middle East & Africa Agricultural Sensor Market Revenue (Million), by Country 2025 & 2033
- Figure 49: Middle East & Africa Agricultural Sensor Market Revenue Share (%), by Country 2025 & 2033
- Figure 50: Asia Pacific Agricultural Sensor Market Revenue (Million), by Production Analysis 2025 & 2033
- Figure 51: Asia Pacific Agricultural Sensor Market Revenue Share (%), by Production Analysis 2025 & 2033
- Figure 52: Asia Pacific Agricultural Sensor Market Revenue (Million), by Consumption Analysis 2025 & 2033
- Figure 53: Asia Pacific Agricultural Sensor Market Revenue Share (%), by Consumption Analysis 2025 & 2033
- Figure 54: Asia Pacific Agricultural Sensor Market Revenue (Million), by Import Market Analysis (Value & Volume) 2025 & 2033
- Figure 55: Asia Pacific Agricultural Sensor Market Revenue Share (%), by Import Market Analysis (Value & Volume) 2025 & 2033
- Figure 56: Asia Pacific Agricultural Sensor Market Revenue (Million), by Export Market Analysis (Value & Volume) 2025 & 2033
- Figure 57: Asia Pacific Agricultural Sensor Market Revenue Share (%), by Export Market Analysis (Value & Volume) 2025 & 2033
- Figure 58: Asia Pacific Agricultural Sensor Market Revenue (Million), by Price Trend Analysis 2025 & 2033
- Figure 59: Asia Pacific Agricultural Sensor Market Revenue Share (%), by Price Trend Analysis 2025 & 2033
- Figure 60: Asia Pacific Agricultural Sensor Market Revenue (Million), by Country 2025 & 2033
- Figure 61: Asia Pacific Agricultural Sensor Market Revenue Share (%), by Country 2025 & 2033
List of Tables
- Table 1: Global Agricultural Sensor Market Revenue Million Forecast, by Production Analysis 2020 & 2033
- Table 2: Global Agricultural Sensor Market Revenue Million Forecast, by Consumption Analysis 2020 & 2033
- Table 3: Global Agricultural Sensor Market Revenue Million Forecast, by Import Market Analysis (Value & Volume) 2020 & 2033
- Table 4: Global Agricultural Sensor Market Revenue Million Forecast, by Export Market Analysis (Value & Volume) 2020 & 2033
- Table 5: Global Agricultural Sensor Market Revenue Million Forecast, by Price Trend Analysis 2020 & 2033
- Table 6: Global Agricultural Sensor Market Revenue Million Forecast, by Region 2020 & 2033
- Table 7: Global Agricultural Sensor Market Revenue Million Forecast, by Production Analysis 2020 & 2033
- Table 8: Global Agricultural Sensor Market Revenue Million Forecast, by Consumption Analysis 2020 & 2033
- Table 9: Global Agricultural Sensor Market Revenue Million Forecast, by Import Market Analysis (Value & Volume) 2020 & 2033
- Table 10: Global Agricultural Sensor Market Revenue Million Forecast, by Export Market Analysis (Value & Volume) 2020 & 2033
- Table 11: Global Agricultural Sensor Market Revenue Million Forecast, by Price Trend Analysis 2020 & 2033
- Table 12: Global Agricultural Sensor Market Revenue Million Forecast, by Country 2020 & 2033
- Table 13: United States Agricultural Sensor Market Revenue (Million) Forecast, by Application 2020 & 2033
- Table 14: Canada Agricultural Sensor Market Revenue (Million) Forecast, by Application 2020 & 2033
- Table 15: Mexico Agricultural Sensor Market Revenue (Million) Forecast, by Application 2020 & 2033
- Table 16: Global Agricultural Sensor Market Revenue Million Forecast, by Production Analysis 2020 & 2033
- Table 17: Global Agricultural Sensor Market Revenue Million Forecast, by Consumption Analysis 2020 & 2033
- Table 18: Global Agricultural Sensor Market Revenue Million Forecast, by Import Market Analysis (Value & Volume) 2020 & 2033
- Table 19: Global Agricultural Sensor Market Revenue Million Forecast, by Export Market Analysis (Value & Volume) 2020 & 2033
- Table 20: Global Agricultural Sensor Market Revenue Million Forecast, by Price Trend Analysis 2020 & 2033
- Table 21: Global Agricultural Sensor Market Revenue Million Forecast, by Country 2020 & 2033
- Table 22: Brazil Agricultural Sensor Market Revenue (Million) Forecast, by Application 2020 & 2033
- Table 23: Argentina Agricultural Sensor Market Revenue (Million) Forecast, by Application 2020 & 2033
- Table 24: Rest of South America Agricultural Sensor Market Revenue (Million) Forecast, by Application 2020 & 2033
- Table 25: Global Agricultural Sensor Market Revenue Million Forecast, by Production Analysis 2020 & 2033
- Table 26: Global Agricultural Sensor Market Revenue Million Forecast, by Consumption Analysis 2020 & 2033
- Table 27: Global Agricultural Sensor Market Revenue Million Forecast, by Import Market Analysis (Value & Volume) 2020 & 2033
- Table 28: Global Agricultural Sensor Market Revenue Million Forecast, by Export Market Analysis (Value & Volume) 2020 & 2033
- Table 29: Global Agricultural Sensor Market Revenue Million Forecast, by Price Trend Analysis 2020 & 2033
- Table 30: Global Agricultural Sensor Market Revenue Million Forecast, by Country 2020 & 2033
- Table 31: United Kingdom Agricultural Sensor Market Revenue (Million) Forecast, by Application 2020 & 2033
- Table 32: Germany Agricultural Sensor Market Revenue (Million) Forecast, by Application 2020 & 2033
- Table 33: France Agricultural Sensor Market Revenue (Million) Forecast, by Application 2020 & 2033
- Table 34: Italy Agricultural Sensor Market Revenue (Million) Forecast, by Application 2020 & 2033
- Table 35: Spain Agricultural Sensor Market Revenue (Million) Forecast, by Application 2020 & 2033
- Table 36: Russia Agricultural Sensor Market Revenue (Million) Forecast, by Application 2020 & 2033
- Table 37: Benelux Agricultural Sensor Market Revenue (Million) Forecast, by Application 2020 & 2033
- Table 38: Nordics Agricultural Sensor Market Revenue (Million) Forecast, by Application 2020 & 2033
- Table 39: Rest of Europe Agricultural Sensor Market Revenue (Million) Forecast, by Application 2020 & 2033
- Table 40: Global Agricultural Sensor Market Revenue Million Forecast, by Production Analysis 2020 & 2033
- Table 41: Global Agricultural Sensor Market Revenue Million Forecast, by Consumption Analysis 2020 & 2033
- Table 42: Global Agricultural Sensor Market Revenue Million Forecast, by Import Market Analysis (Value & Volume) 2020 & 2033
- Table 43: Global Agricultural Sensor Market Revenue Million Forecast, by Export Market Analysis (Value & Volume) 2020 & 2033
- Table 44: Global Agricultural Sensor Market Revenue Million Forecast, by Price Trend Analysis 2020 & 2033
- Table 45: Global Agricultural Sensor Market Revenue Million Forecast, by Country 2020 & 2033
- Table 46: Turkey Agricultural Sensor Market Revenue (Million) Forecast, by Application 2020 & 2033
- Table 47: Israel Agricultural Sensor Market Revenue (Million) Forecast, by Application 2020 & 2033
- Table 48: GCC Agricultural Sensor Market Revenue (Million) Forecast, by Application 2020 & 2033
- Table 49: North Africa Agricultural Sensor Market Revenue (Million) Forecast, by Application 2020 & 2033
- Table 50: South Africa Agricultural Sensor Market Revenue (Million) Forecast, by Application 2020 & 2033
- Table 51: Rest of Middle East & Africa Agricultural Sensor Market Revenue (Million) Forecast, by Application 2020 & 2033
- Table 52: Global Agricultural Sensor Market Revenue Million Forecast, by Production Analysis 2020 & 2033
- Table 53: Global Agricultural Sensor Market Revenue Million Forecast, by Consumption Analysis 2020 & 2033
- Table 54: Global Agricultural Sensor Market Revenue Million Forecast, by Import Market Analysis (Value & Volume) 2020 & 2033
- Table 55: Global Agricultural Sensor Market Revenue Million Forecast, by Export Market Analysis (Value & Volume) 2020 & 2033
- Table 56: Global Agricultural Sensor Market Revenue Million Forecast, by Price Trend Analysis 2020 & 2033
- Table 57: Global Agricultural Sensor Market Revenue Million Forecast, by Country 2020 & 2033
- Table 58: China Agricultural Sensor Market Revenue (Million) Forecast, by Application 2020 & 2033
- Table 59: India Agricultural Sensor Market Revenue (Million) Forecast, by Application 2020 & 2033
- Table 60: Japan Agricultural Sensor Market Revenue (Million) Forecast, by Application 2020 & 2033
- Table 61: South Korea Agricultural Sensor Market Revenue (Million) Forecast, by Application 2020 & 2033
- Table 62: ASEAN Agricultural Sensor Market Revenue (Million) Forecast, by Application 2020 & 2033
- Table 63: Oceania Agricultural Sensor Market Revenue (Million) Forecast, by Application 2020 & 2033
- Table 64: Rest of Asia Pacific Agricultural Sensor Market Revenue (Million) Forecast, by Application 2020 & 2033
Frequently Asked Questions
1. What is the projected Compound Annual Growth Rate (CAGR) of the Agricultural Sensor Market?
The projected CAGR is approximately 11.50%.
2. Which companies are prominent players in the Agricultural Sensor Market?
Key companies in the market include Pycno, Caipos GmbH, Aquaspy Inc, Vegetronix Inc, Edyn, Libelium Comunicaciones Distribuidas Sl, Crop, Agsmarts Inc, Acclima Inc, Acquity Agriculture, Auroras, Sentek Ltd.
3. What are the main segments of the Agricultural Sensor Market?
The market segments include Production Analysis, Consumption Analysis, Import Market Analysis (Value & Volume), Export Market Analysis (Value & Volume), Price Trend Analysis.
4. Can you provide details about the market size?
The market size is estimated to be USD 2.01 Million as of 2022.
5. What are some drivers contributing to market growth?
Skilled Labor Shortage; Favorable Government Policies.
6. What are the notable trends driving market growth?
Decreased Number of Labor Requirements.
7. Are there any restraints impacting market growth?
Fragmentation of Land Holdings; Increasing Interest of Farmers Toward Custom Hiring Center.
8. Can you provide examples of recent developments in the market?
January 2023: CropX Technologies, a global leader in digital solutions for agronomic farm management, acquired Tule Technologies, a precision irrigation company based in California. This acquisition brings new data capture technologies to the CropX Agronomic Farm Management System and expands its market in California drip-irrigated specialty crops.
9. What pricing options are available for accessing the report?
Pricing options include single-user, multi-user, and enterprise licenses priced at USD 4750, USD 5250, and USD 8750 respectively.
10. Is the market size provided in terms of value or volume?
The market size is provided in terms of value, measured in Million.
11. Are there any specific market keywords associated with the report?
Yes, the market keyword associated with the report is "Agricultural Sensor Market," which aids in identifying and referencing the specific market segment covered.
12. How do I determine which pricing option suits my needs best?
The pricing options vary based on user requirements and access needs. Individual users may opt for single-user licenses, while businesses requiring broader access may choose multi-user or enterprise licenses for cost-effective access to the report.
13. Are there any additional resources or data provided in the Agricultural Sensor Market report?
While the report offers comprehensive insights, it's advisable to review the specific contents or supplementary materials provided to ascertain if additional resources or data are available.
14. How can I stay updated on further developments or reports in the Agricultural Sensor Market?
To stay informed about further developments, trends, and reports in the Agricultural Sensor Market, consider subscribing to industry newsletters, following relevant companies and organizations, or regularly checking reputable industry news sources and publications.
Methodology
Step 1 - Identification of Relevant Samples Size from Population Database


Step 2 - Approaches for Defining Global Market Size (Value, Volume* & Price*)

Note*: In applicable scenarios
Step 3 - Data Sources
Primary Research
- Web Analytics
- Survey Reports
- Research Institute
- Latest Research Reports
- Opinion Leaders
Secondary Research
- Annual Reports
- White Paper
- Latest Press Release
- Industry Association
- Paid Database
- Investor Presentations

Step 4 - Data Triangulation
Involves using different sources of information in order to increase the validity of a study
These sources are likely to be stakeholders in a program - participants, other researchers, program staff, other community members, and so on.
Then we put all data in single framework & apply various statistical tools to find out the dynamic on the market.
During the analysis stage, feedback from the stakeholder groups would be compared to determine areas of agreement as well as areas of divergence