Agricultural Tractors Industry Market’s Tech Revolution: Projections to 2033

Agricultural Tractors Industry by Production Analysis, by Consumption Analysis, by Import Market Analysis (Value & Volume), by Export Market Analysis (Value & Volume), by Price Trend Analysis, by North America (United States, Canada, Mexico), by South America (Brazil, Argentina, Rest of South America), by Europe (United Kingdom, Germany, France, Italy, Spain, Russia, Benelux, Nordics, Rest of Europe), by Middle East & Africa (Turkey, Israel, GCC, North Africa, South Africa, Rest of Middle East & Africa), by Asia Pacific (China, India, Japan, South Korea, ASEAN, Oceania, Rest of Asia Pacific) Forecast 2025-2033

Jun 27 2025
Base Year: 2024

234 Pages
Main Logo

Agricultural Tractors Industry Market’s Tech Revolution: Projections to 2033


Home
Industries
Agriculture
sponsor image

Tailored for you

  • In-depth Analysis Tailored to Specified Regions or Segments
  • Company Profiles Customized to User Preferences
  • Comprehensive Insights Focused on Specific Segments or Regions
  • Customized Evaluation of Competitive Landscape to Meet Your Needs
  • Tailored Customization to Address Other Specific Requirements
Ask for customization


Key Insights

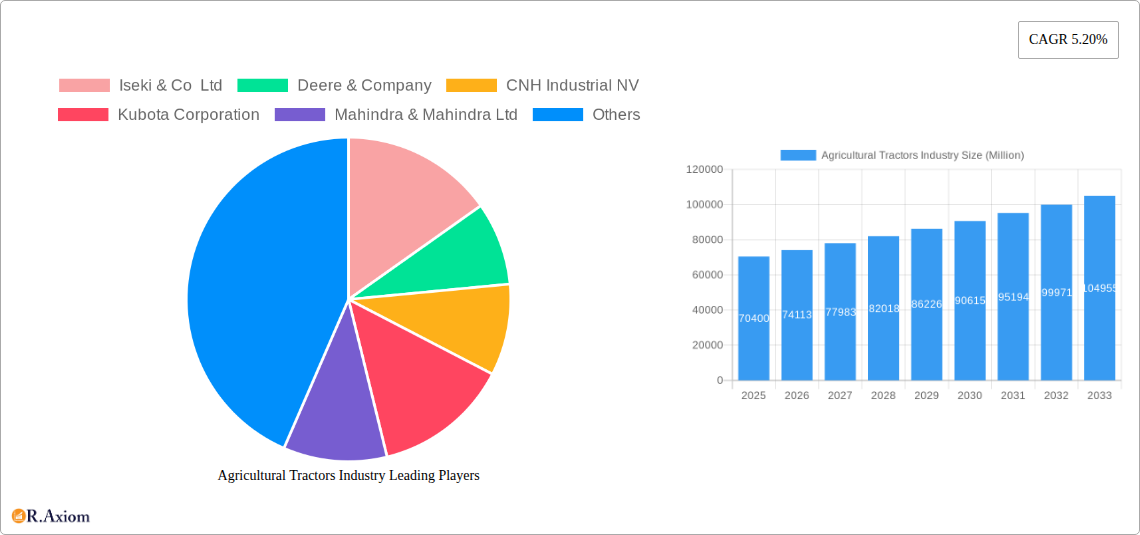
The global agricultural tractors market, valued at $70.40 billion in 2025, is projected to experience robust growth, exhibiting a Compound Annual Growth Rate (CAGR) of 5.20% from 2025 to 2033. This expansion is fueled by several key drivers. Increasing global food demand necessitates enhanced agricultural productivity, driving the adoption of modern, high-performance tractors. Technological advancements, such as precision farming technologies (GPS-guided systems, automated steering, and sensor-based applications), are improving efficiency and yield, further stimulating market growth. Government initiatives promoting agricultural modernization and mechanization in developing economies also contribute significantly. The market is segmented by horsepower, with the higher horsepower segments (151 HP to 350+ HP) expected to witness faster growth due to their suitability for large-scale farming operations. By type, row-crop tractors are likely to maintain a dominant market share, reflecting their widespread application in various cropping systems. Key players like Deere & Company, Kubota Corporation, and Mahindra & Mahindra Ltd. are leveraging their established distribution networks and innovative product offerings to strengthen their market positions. However, factors like high initial investment costs, fluctuating fuel prices, and environmental concerns related to emissions may restrain market growth to some extent.

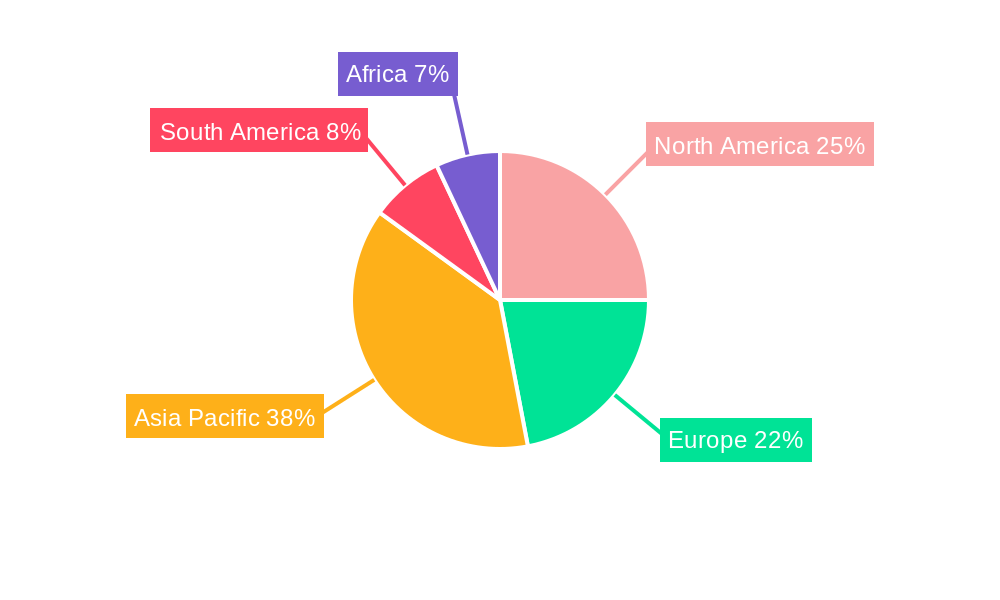
The regional landscape reveals diverse growth patterns. North America and Europe are expected to maintain significant market shares, driven by established agricultural practices and technological adoption. However, the Asia-Pacific region, particularly India and China, presents substantial growth opportunities due to expanding agricultural land under cultivation and increasing government support for agricultural mechanization. South America and Africa, although currently smaller markets, are anticipated to show promising growth potential in the coming years as agricultural practices modernize and economies develop. The competitive landscape is characterized by both established multinational corporations and regional players. The ongoing trend towards mergers and acquisitions, coupled with continuous product innovation and expansion into new markets, will likely shape the future dynamics of the agricultural tractor industry. The forecast period of 2025-2033 offers substantial potential for growth, contingent on sustained global food demand and supportive policy frameworks.

Agricultural Tractors Industry: A Comprehensive Market Report (2019-2033)

This comprehensive report provides a detailed analysis of the global agricultural tractors industry, covering market size, segmentation, growth drivers, challenges, and key players. The report utilizes data from 2019-2024 (historical period), with a base year of 2025 and forecasts extending to 2033. The study period covers 2019-2033. This in-depth analysis is crucial for industry stakeholders, investors, and strategic decision-makers seeking to understand and capitalize on the opportunities within this dynamic sector. The global agricultural tractor market is estimated to reach xx Million by 2033.

Agricultural Tractors Industry Research Report - Market Size, Growth & Forecast

Agricultural Tractors Industry Market Concentration & Innovation

The agricultural tractor industry is characterized by a moderate level of concentration, with several large multinational corporations holding significant market share. Companies like Deere & Company, CNH Industrial NV, and Kubota Corporation dominate the global landscape, while regional players like Mahindra & Mahindra Ltd hold strong positions in their respective markets. Market share data for 2024 indicates Deere & Company holds approximately xx% market share, followed by CNH Industrial NV at xx% and Kubota Corporation at xx%. These figures highlight the competitive nature of the market.

Innovation is a key driver in this sector, with continuous advancements in engine technology, precision farming capabilities (GPS-guided systems, automated steering), and enhanced safety features. Stringent emission regulations are also pushing manufacturers to adopt cleaner technologies. Furthermore, the increasing adoption of smart farming technologies is transforming the industry, creating demand for tractors equipped with sophisticated data analytics and connectivity features.

Mergers and acquisitions (M&A) activities play a significant role in shaping the industry landscape. Recent years have witnessed several significant deals, with total M&A deal values reaching xx Million in 2024. These transactions often involve the acquisition of smaller, specialized companies by larger players to expand product portfolios and geographical reach.

Agricultural Tractors Industry Industry Trends & Insights

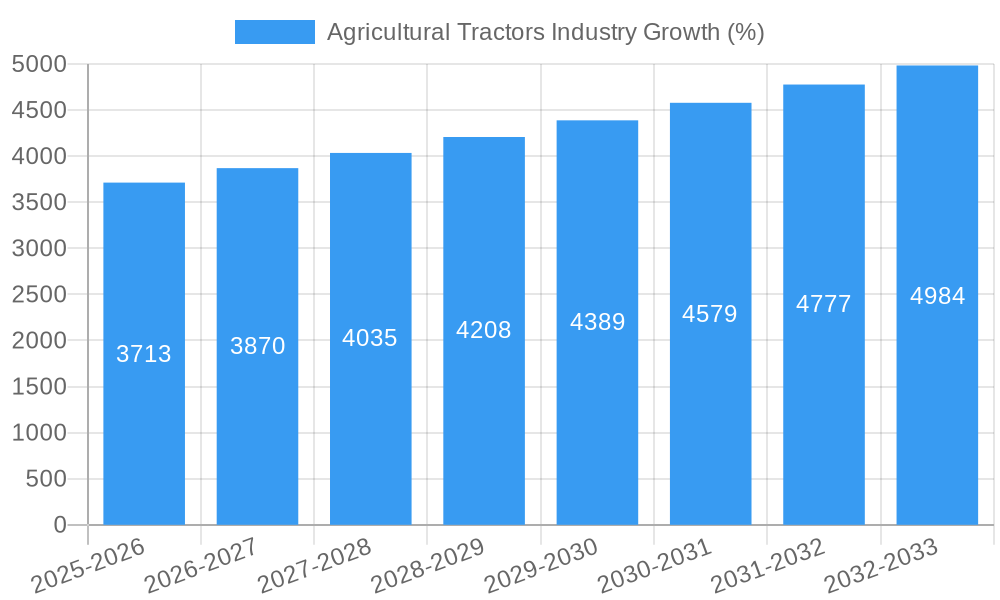
The agricultural tractors industry is experiencing robust growth, driven by several key factors. The increasing global population and rising demand for food are fueling the need for efficient and productive farming practices. This, in turn, is driving demand for advanced agricultural machinery, including tractors. The Compound Annual Growth Rate (CAGR) for the global agricultural tractors market during the forecast period (2025-2033) is projected to be xx%.

Technological advancements are revolutionizing the agricultural sector, leading to the adoption of precision farming techniques. This includes the integration of GPS, sensors, and data analytics to optimize planting, fertilization, and harvesting. The increasing adoption of these technologies is boosting the demand for high-tech tractors equipped with advanced features.

Consumer preferences are also evolving, with farmers increasingly demanding fuel-efficient, environmentally friendly, and user-friendly tractors. This has led to the development of tractors with improved fuel economy, reduced emissions, and ergonomic designs. The market penetration of technologically advanced tractors is expected to reach xx% by 2033.

The competitive landscape is fiercely contested, with major players investing heavily in research and development to stay ahead of the curve. This leads to continuous product innovation and improvements in tractor technology and efficiency.

Agricultural Tractors Industry Growth

Dominant Markets & Segments in Agricultural Tractors Industry

  • By Horse Power: The 40 HP to 99 HP segment currently holds the largest market share, driven by its versatility and suitability for a wide range of farming operations. The higher horsepower segments (100 HP and above) are experiencing significant growth due to the increasing demand for larger-scale farming operations. Growth is also seen in the smaller horsepower segments (less than 40 HP) due to increased demand for specialized applications.

  • By Type: Row-crop tractors dominate the market due to their widespread use in various agricultural applications. Orchard tractors hold a smaller but steadily growing market share, driven by increasing demand for efficient fruit and vegetable farming practices.

Key Drivers for Dominance:

  • North America: High agricultural productivity, advanced farming practices, and a strong agricultural economy contribute to North America's dominance in the market.
  • Europe: Stringent environmental regulations drive innovation and adoption of advanced technologies in this region.
  • Asia-Pacific: Rapid economic growth, rising agricultural output, and increasing government support are fueling growth in this region.

These regions are characterized by robust agricultural infrastructure, supportive government policies, and a favorable business environment. However, the market dominance is anticipated to shift slightly towards the Asia-Pacific region by 2033.

Agricultural Tractors Industry Product Developments

Recent product innovations focus on improving fuel efficiency, enhancing precision farming capabilities, and incorporating advanced technologies like automation and telematics. Tractors with improved GPS guidance systems, automated steering, and yield monitoring capabilities are gaining popularity. These advancements are leading to increased productivity, reduced operating costs, and improved environmental sustainability. The market has witnessed a significant increase in the integration of IoT and AI-based features in recent years.

Report Scope & Segmentation Analysis

This report segments the agricultural tractors market by horsepower (less than 40 HP, 40-99 HP, 100-150 HP, 151-200 HP, 201-270 HP, 271-350 HP, greater than 350 HP) and by type (orchard tractors, row-crop tractors, other types). Each segment is analyzed in detail, including growth projections, market size, and competitive dynamics. For instance, the 40-99 HP segment is expected to show steady growth due to its widespread application, while higher horsepower segments are anticipated to grow rapidly driven by demand for large scale farming. Similarly, row-crop tractors continue to dominate the market by type, driven by consistent demand across various agricultural practices. However, specialized segments like orchard tractors are showing strong growth potential, driven by a focus on efficient fruit and vegetable production.

Key Drivers of Agricultural Tractors Industry Growth

Several key factors drive growth in the agricultural tractors industry. These include rising global food demand, increasing adoption of advanced farming techniques, government support for agricultural modernization, and technological advancements like precision farming and automation. Improved infrastructure in developing economies is also fostering growth. Furthermore, favorable government policies promoting agricultural mechanization are creating favorable conditions for industry expansion.

Challenges in the Agricultural Tractors Industry Sector

The agricultural tractors industry faces several challenges, including fluctuating raw material prices, stringent emission regulations, and intense competition among manufacturers. Supply chain disruptions due to global events impact production and distribution, leading to increased costs and delays. Furthermore, economic downturns can reduce farmer investment in new equipment. This necessitates adaptation and innovation to overcome these market constraints. These challenges account for an estimated xx% reduction in annual market growth in certain years.

Emerging Opportunities in Agricultural Tractors Industry

Emerging opportunities lie in the growing adoption of electric and hybrid tractors, autonomous driving technologies, and precision farming solutions. Expansion into new and developing markets offers significant growth potential, while the rising demand for specialized tractors for niche applications creates new market segments. The increasing focus on sustainable agriculture further presents opportunities for manufacturers to develop and market environmentally friendly tractors.

Leading Players in the Agricultural Tractors Industry Market

  • Iseki & Co Ltd
  • Deere & Company
  • CNH Industrial NV
  • Kubota Corporation
  • Mahindra & Mahindra Ltd
  • Claas KGaA mbH
  • Tractors and Farm Equipment Ltd
  • AGCO Corporation (Massey Ferguson Limited)
  • Yanmar Holdings Co Lt

Key Developments in Agricultural Tractors Industry Industry

  • June 2022: Solis Yanmar launched three new tractor models (below 30 HP) for Turkish farms, exported from India. This expands market reach and caters to specific regional demands.

  • July 2021: New Holland North America launched the T7 Heavy-duty Tractor with PLM Intelligence, enhancing productivity and multi-tasking capabilities for farmers. This demonstrates technological advancement and improved efficiency.

  • November 2022: VST Tillers Tractors Ltd and ZETOR TRACTORS unveiled two tractors (45 HP and 50 HP) at CII Agro Tech India 2022. This collaborative effort highlights strategic partnerships and the introduction of new products tailored for specific markets.

Strategic Outlook for Agricultural Tractors Industry Market

The future of the agricultural tractors industry is bright, driven by technological advancements, evolving consumer preferences, and the increasing demand for food. Continued growth is anticipated, with significant opportunities in precision farming, automation, and sustainable agricultural practices. Companies that invest in research and development, adapt to changing regulations, and cater to the evolving needs of farmers will be best positioned for success in this dynamic market.

Agricultural Tractors Industry Segmentation

  • 1. Production Analysis
  • 2. Consumption Analysis
  • 3. Import Market Analysis (Value & Volume)
  • 4. Export Market Analysis (Value & Volume)
  • 5. Price Trend Analysis

Agricultural Tractors Industry Segmentation By Geography

  • 1. North America
    • 1.1. United States
    • 1.2. Canada
    • 1.3. Mexico
  • 2. South America
    • 2.1. Brazil
    • 2.2. Argentina
    • 2.3. Rest of South America
  • 3. Europe
    • 3.1. United Kingdom
    • 3.2. Germany
    • 3.3. France
    • 3.4. Italy
    • 3.5. Spain
    • 3.6. Russia
    • 3.7. Benelux
    • 3.8. Nordics
    • 3.9. Rest of Europe
  • 4. Middle East & Africa
    • 4.1. Turkey
    • 4.2. Israel
    • 4.3. GCC
    • 4.4. North Africa
    • 4.5. South Africa
    • 4.6. Rest of Middle East & Africa
  • 5. Asia Pacific
    • 5.1. China
    • 5.2. India
    • 5.3. Japan
    • 5.4. South Korea
    • 5.5. ASEAN
    • 5.6. Oceania
    • 5.7. Rest of Asia Pacific
Agricultural Tractors Industry Regional Share


Agricultural Tractors Industry REPORT HIGHLIGHTS

AspectsDetails
Study Period 2019-2033
Base Year 2024
Estimated Year 2025
Forecast Period2025-2033
Historical Period2019-2024
Growth RateCAGR of 5.20% from 2019-2033
Segmentation
    • By Production Analysis
    • By Consumption Analysis
    • By Import Market Analysis (Value & Volume)
    • By Export Market Analysis (Value & Volume)
    • By Price Trend Analysis
  • By Geography
    • North America
      • United States
      • Canada
      • Mexico
    • South America
      • Brazil
      • Argentina
      • Rest of South America
    • Europe
      • United Kingdom
      • Germany
      • France
      • Italy
      • Spain
      • Russia
      • Benelux
      • Nordics
      • Rest of Europe
    • Middle East & Africa
      • Turkey
      • Israel
      • GCC
      • North Africa
      • South Africa
      • Rest of Middle East & Africa
    • Asia Pacific
      • China
      • India
      • Japan
      • South Korea
      • ASEAN
      • Oceania
      • Rest of Asia Pacific


Table of Contents

  1. 1. Introduction
    • 1.1. Research Scope
    • 1.2. Market Segmentation
    • 1.3. Research Methodology
    • 1.4. Definitions and Assumptions
  2. 2. Executive Summary
    • 2.1. Introduction
  3. 3. Market Dynamics
    • 3.1. Introduction
      • 3.2. Market Drivers
        • 3.2.1. Shortage of Skilled Labor; Government Support to Enhance Farm Mechanization
      • 3.3. Market Restrains
        • 3.3.1. Heavy Initial Procurement Cost and High Expenditure on Maintenance
      • 3.4. Market Trends
        • 3.4.1. Increasing Farm Mechanization in Developing Markets
  4. 4. Market Factor Analysis
    • 4.1. Porters Five Forces
    • 4.2. Supply/Value Chain
    • 4.3. PESTEL analysis
    • 4.4. Market Entropy
    • 4.5. Patent/Trademark Analysis
  5. 5. Global Agricultural Tractors Industry Analysis, Insights and Forecast, 2019-2031
    • 5.1. Market Analysis, Insights and Forecast - by Production Analysis
      • 5.2. Market Analysis, Insights and Forecast - by Consumption Analysis
        • 5.3. Market Analysis, Insights and Forecast - by Import Market Analysis (Value & Volume)
          • 5.4. Market Analysis, Insights and Forecast - by Export Market Analysis (Value & Volume)
            • 5.5. Market Analysis, Insights and Forecast - by Price Trend Analysis
              • 5.6. Market Analysis, Insights and Forecast - by Region
                • 5.6.1. North America
                • 5.6.2. South America
                • 5.6.3. Europe
                • 5.6.4. Middle East & Africa
                • 5.6.5. Asia Pacific
            • 6. North America Agricultural Tractors Industry Analysis, Insights and Forecast, 2019-2031
              • 6.1. Market Analysis, Insights and Forecast - by Production Analysis
                • 6.2. Market Analysis, Insights and Forecast - by Consumption Analysis
                  • 6.3. Market Analysis, Insights and Forecast - by Import Market Analysis (Value & Volume)
                    • 6.4. Market Analysis, Insights and Forecast - by Export Market Analysis (Value & Volume)
                      • 6.5. Market Analysis, Insights and Forecast - by Price Trend Analysis
                      • 7. South America Agricultural Tractors Industry Analysis, Insights and Forecast, 2019-2031
                        • 7.1. Market Analysis, Insights and Forecast - by Production Analysis
                          • 7.2. Market Analysis, Insights and Forecast - by Consumption Analysis
                            • 7.3. Market Analysis, Insights and Forecast - by Import Market Analysis (Value & Volume)
                              • 7.4. Market Analysis, Insights and Forecast - by Export Market Analysis (Value & Volume)
                                • 7.5. Market Analysis, Insights and Forecast - by Price Trend Analysis
                                • 8. Europe Agricultural Tractors Industry Analysis, Insights and Forecast, 2019-2031
                                  • 8.1. Market Analysis, Insights and Forecast - by Production Analysis
                                    • 8.2. Market Analysis, Insights and Forecast - by Consumption Analysis
                                      • 8.3. Market Analysis, Insights and Forecast - by Import Market Analysis (Value & Volume)
                                        • 8.4. Market Analysis, Insights and Forecast - by Export Market Analysis (Value & Volume)
                                          • 8.5. Market Analysis, Insights and Forecast - by Price Trend Analysis
                                          • 9. Middle East & Africa Agricultural Tractors Industry Analysis, Insights and Forecast, 2019-2031
                                            • 9.1. Market Analysis, Insights and Forecast - by Production Analysis
                                              • 9.2. Market Analysis, Insights and Forecast - by Consumption Analysis
                                                • 9.3. Market Analysis, Insights and Forecast - by Import Market Analysis (Value & Volume)
                                                  • 9.4. Market Analysis, Insights and Forecast - by Export Market Analysis (Value & Volume)
                                                    • 9.5. Market Analysis, Insights and Forecast - by Price Trend Analysis
                                                    • 10. Asia Pacific Agricultural Tractors Industry Analysis, Insights and Forecast, 2019-2031
                                                      • 10.1. Market Analysis, Insights and Forecast - by Production Analysis
                                                        • 10.2. Market Analysis, Insights and Forecast - by Consumption Analysis
                                                          • 10.3. Market Analysis, Insights and Forecast - by Import Market Analysis (Value & Volume)
                                                            • 10.4. Market Analysis, Insights and Forecast - by Export Market Analysis (Value & Volume)
                                                              • 10.5. Market Analysis, Insights and Forecast - by Price Trend Analysis
                                                              • 11. North America Agricultural Tractors Industry Analysis, Insights and Forecast, 2019-2031
                                                                  • 11.1. Market Analysis, Insights and Forecast - By Country/Sub-region
                                                                    • 11.1.1 United States
                                                                    • 11.1.2 Canada
                                                                    • 11.1.3 Mexico
                                                                    • 11.1.4 Rest of North America
                                                              • 12. Europe Agricultural Tractors Industry Analysis, Insights and Forecast, 2019-2031
                                                                  • 12.1. Market Analysis, Insights and Forecast - By Country/Sub-region
                                                                    • 12.1.1 Germany
                                                                    • 12.1.2 United Kingdom
                                                                    • 12.1.3 France
                                                                    • 12.1.4 Spain
                                                                    • 12.1.5 Italy
                                                                    • 12.1.6 Russia
                                                                    • 12.1.7 Poland
                                                                    • 12.1.8 Rest of Europe
                                                              • 13. Asia Pacific Agricultural Tractors Industry Analysis, Insights and Forecast, 2019-2031
                                                                  • 13.1. Market Analysis, Insights and Forecast - By Country/Sub-region
                                                                    • 13.1.1 China
                                                                    • 13.1.2 Japan
                                                                    • 13.1.3 India
                                                                    • 13.1.4 Australia
                                                                    • 13.1.5 Rest of Asia Pacific
                                                              • 14. South America Agricultural Tractors Industry Analysis, Insights and Forecast, 2019-2031
                                                                  • 14.1. Market Analysis, Insights and Forecast - By Country/Sub-region
                                                                    • 14.1.1 Brazil
                                                                    • 14.1.2 Argentina
                                                                    • 14.1.3 Rest of South America
                                                              • 15. Africa Agricultural Tractors Industry Analysis, Insights and Forecast, 2019-2031
                                                                  • 15.1. Market Analysis, Insights and Forecast - By Country/Sub-region
                                                                    • 15.1.1 South Africa
                                                                    • 15.1.2 Rest of Africa
                                                              • 16. Competitive Analysis
                                                                • 16.1. Global Market Share Analysis 2024
                                                                  • 16.2. Company Profiles
                                                                    • 16.2.1 Iseki & Co Ltd
                                                                      • 16.2.1.1. Overview
                                                                      • 16.2.1.2. Products
                                                                      • 16.2.1.3. SWOT Analysis
                                                                      • 16.2.1.4. Recent Developments
                                                                      • 16.2.1.5. Financials (Based on Availability)
                                                                    • 16.2.2 Deere & Company
                                                                      • 16.2.2.1. Overview
                                                                      • 16.2.2.2. Products
                                                                      • 16.2.2.3. SWOT Analysis
                                                                      • 16.2.2.4. Recent Developments
                                                                      • 16.2.2.5. Financials (Based on Availability)
                                                                    • 16.2.3 CNH Industrial NV
                                                                      • 16.2.3.1. Overview
                                                                      • 16.2.3.2. Products
                                                                      • 16.2.3.3. SWOT Analysis
                                                                      • 16.2.3.4. Recent Developments
                                                                      • 16.2.3.5. Financials (Based on Availability)
                                                                    • 16.2.4 Kubota Corporation
                                                                      • 16.2.4.1. Overview
                                                                      • 16.2.4.2. Products
                                                                      • 16.2.4.3. SWOT Analysis
                                                                      • 16.2.4.4. Recent Developments
                                                                      • 16.2.4.5. Financials (Based on Availability)
                                                                    • 16.2.5 Mahindra & Mahindra Ltd
                                                                      • 16.2.5.1. Overview
                                                                      • 16.2.5.2. Products
                                                                      • 16.2.5.3. SWOT Analysis
                                                                      • 16.2.5.4. Recent Developments
                                                                      • 16.2.5.5. Financials (Based on Availability)
                                                                    • 16.2.6 Claas KGaA mbH
                                                                      • 16.2.6.1. Overview
                                                                      • 16.2.6.2. Products
                                                                      • 16.2.6.3. SWOT Analysis
                                                                      • 16.2.6.4. Recent Developments
                                                                      • 16.2.6.5. Financials (Based on Availability)
                                                                    • 16.2.7 Tractors and Farm Equipment Ltd
                                                                      • 16.2.7.1. Overview
                                                                      • 16.2.7.2. Products
                                                                      • 16.2.7.3. SWOT Analysis
                                                                      • 16.2.7.4. Recent Developments
                                                                      • 16.2.7.5. Financials (Based on Availability)
                                                                    • 16.2.8 AGCO Corporation (Massey Ferguson Limited)
                                                                      • 16.2.8.1. Overview
                                                                      • 16.2.8.2. Products
                                                                      • 16.2.8.3. SWOT Analysis
                                                                      • 16.2.8.4. Recent Developments
                                                                      • 16.2.8.5. Financials (Based on Availability)
                                                                    • 16.2.9 Yanmar Holdings Co Lt
                                                                      • 16.2.9.1. Overview
                                                                      • 16.2.9.2. Products
                                                                      • 16.2.9.3. SWOT Analysis
                                                                      • 16.2.9.4. Recent Developments
                                                                      • 16.2.9.5. Financials (Based on Availability)

                                                              List of Figures

                                                              1. Figure 1: Global Agricultural Tractors Industry Revenue Breakdown (Million, %) by Region 2024 & 2032
                                                              2. Figure 2: North America Agricultural Tractors Industry Revenue (Million), by Country 2024 & 2032
                                                              3. Figure 3: North America Agricultural Tractors Industry Revenue Share (%), by Country 2024 & 2032
                                                              4. Figure 4: Europe Agricultural Tractors Industry Revenue (Million), by Country 2024 & 2032
                                                              5. Figure 5: Europe Agricultural Tractors Industry Revenue Share (%), by Country 2024 & 2032
                                                              6. Figure 6: Asia Pacific Agricultural Tractors Industry Revenue (Million), by Country 2024 & 2032
                                                              7. Figure 7: Asia Pacific Agricultural Tractors Industry Revenue Share (%), by Country 2024 & 2032
                                                              8. Figure 8: South America Agricultural Tractors Industry Revenue (Million), by Country 2024 & 2032
                                                              9. Figure 9: South America Agricultural Tractors Industry Revenue Share (%), by Country 2024 & 2032
                                                              10. Figure 10: Africa Agricultural Tractors Industry Revenue (Million), by Country 2024 & 2032
                                                              11. Figure 11: Africa Agricultural Tractors Industry Revenue Share (%), by Country 2024 & 2032
                                                              12. Figure 12: North America Agricultural Tractors Industry Revenue (Million), by Production Analysis 2024 & 2032
                                                              13. Figure 13: North America Agricultural Tractors Industry Revenue Share (%), by Production Analysis 2024 & 2032
                                                              14. Figure 14: North America Agricultural Tractors Industry Revenue (Million), by Consumption Analysis 2024 & 2032
                                                              15. Figure 15: North America Agricultural Tractors Industry Revenue Share (%), by Consumption Analysis 2024 & 2032
                                                              16. Figure 16: North America Agricultural Tractors Industry Revenue (Million), by Import Market Analysis (Value & Volume) 2024 & 2032
                                                              17. Figure 17: North America Agricultural Tractors Industry Revenue Share (%), by Import Market Analysis (Value & Volume) 2024 & 2032
                                                              18. Figure 18: North America Agricultural Tractors Industry Revenue (Million), by Export Market Analysis (Value & Volume) 2024 & 2032
                                                              19. Figure 19: North America Agricultural Tractors Industry Revenue Share (%), by Export Market Analysis (Value & Volume) 2024 & 2032
                                                              20. Figure 20: North America Agricultural Tractors Industry Revenue (Million), by Price Trend Analysis 2024 & 2032
                                                              21. Figure 21: North America Agricultural Tractors Industry Revenue Share (%), by Price Trend Analysis 2024 & 2032
                                                              22. Figure 22: North America Agricultural Tractors Industry Revenue (Million), by Country 2024 & 2032
                                                              23. Figure 23: North America Agricultural Tractors Industry Revenue Share (%), by Country 2024 & 2032
                                                              24. Figure 24: South America Agricultural Tractors Industry Revenue (Million), by Production Analysis 2024 & 2032
                                                              25. Figure 25: South America Agricultural Tractors Industry Revenue Share (%), by Production Analysis 2024 & 2032
                                                              26. Figure 26: South America Agricultural Tractors Industry Revenue (Million), by Consumption Analysis 2024 & 2032
                                                              27. Figure 27: South America Agricultural Tractors Industry Revenue Share (%), by Consumption Analysis 2024 & 2032
                                                              28. Figure 28: South America Agricultural Tractors Industry Revenue (Million), by Import Market Analysis (Value & Volume) 2024 & 2032
                                                              29. Figure 29: South America Agricultural Tractors Industry Revenue Share (%), by Import Market Analysis (Value & Volume) 2024 & 2032
                                                              30. Figure 30: South America Agricultural Tractors Industry Revenue (Million), by Export Market Analysis (Value & Volume) 2024 & 2032
                                                              31. Figure 31: South America Agricultural Tractors Industry Revenue Share (%), by Export Market Analysis (Value & Volume) 2024 & 2032
                                                              32. Figure 32: South America Agricultural Tractors Industry Revenue (Million), by Price Trend Analysis 2024 & 2032
                                                              33. Figure 33: South America Agricultural Tractors Industry Revenue Share (%), by Price Trend Analysis 2024 & 2032
                                                              34. Figure 34: South America Agricultural Tractors Industry Revenue (Million), by Country 2024 & 2032
                                                              35. Figure 35: South America Agricultural Tractors Industry Revenue Share (%), by Country 2024 & 2032
                                                              36. Figure 36: Europe Agricultural Tractors Industry Revenue (Million), by Production Analysis 2024 & 2032
                                                              37. Figure 37: Europe Agricultural Tractors Industry Revenue Share (%), by Production Analysis 2024 & 2032
                                                              38. Figure 38: Europe Agricultural Tractors Industry Revenue (Million), by Consumption Analysis 2024 & 2032
                                                              39. Figure 39: Europe Agricultural Tractors Industry Revenue Share (%), by Consumption Analysis 2024 & 2032
                                                              40. Figure 40: Europe Agricultural Tractors Industry Revenue (Million), by Import Market Analysis (Value & Volume) 2024 & 2032
                                                              41. Figure 41: Europe Agricultural Tractors Industry Revenue Share (%), by Import Market Analysis (Value & Volume) 2024 & 2032
                                                              42. Figure 42: Europe Agricultural Tractors Industry Revenue (Million), by Export Market Analysis (Value & Volume) 2024 & 2032
                                                              43. Figure 43: Europe Agricultural Tractors Industry Revenue Share (%), by Export Market Analysis (Value & Volume) 2024 & 2032
                                                              44. Figure 44: Europe Agricultural Tractors Industry Revenue (Million), by Price Trend Analysis 2024 & 2032
                                                              45. Figure 45: Europe Agricultural Tractors Industry Revenue Share (%), by Price Trend Analysis 2024 & 2032
                                                              46. Figure 46: Europe Agricultural Tractors Industry Revenue (Million), by Country 2024 & 2032
                                                              47. Figure 47: Europe Agricultural Tractors Industry Revenue Share (%), by Country 2024 & 2032
                                                              48. Figure 48: Middle East & Africa Agricultural Tractors Industry Revenue (Million), by Production Analysis 2024 & 2032
                                                              49. Figure 49: Middle East & Africa Agricultural Tractors Industry Revenue Share (%), by Production Analysis 2024 & 2032
                                                              50. Figure 50: Middle East & Africa Agricultural Tractors Industry Revenue (Million), by Consumption Analysis 2024 & 2032
                                                              51. Figure 51: Middle East & Africa Agricultural Tractors Industry Revenue Share (%), by Consumption Analysis 2024 & 2032
                                                              52. Figure 52: Middle East & Africa Agricultural Tractors Industry Revenue (Million), by Import Market Analysis (Value & Volume) 2024 & 2032
                                                              53. Figure 53: Middle East & Africa Agricultural Tractors Industry Revenue Share (%), by Import Market Analysis (Value & Volume) 2024 & 2032
                                                              54. Figure 54: Middle East & Africa Agricultural Tractors Industry Revenue (Million), by Export Market Analysis (Value & Volume) 2024 & 2032
                                                              55. Figure 55: Middle East & Africa Agricultural Tractors Industry Revenue Share (%), by Export Market Analysis (Value & Volume) 2024 & 2032
                                                              56. Figure 56: Middle East & Africa Agricultural Tractors Industry Revenue (Million), by Price Trend Analysis 2024 & 2032
                                                              57. Figure 57: Middle East & Africa Agricultural Tractors Industry Revenue Share (%), by Price Trend Analysis 2024 & 2032
                                                              58. Figure 58: Middle East & Africa Agricultural Tractors Industry Revenue (Million), by Country 2024 & 2032
                                                              59. Figure 59: Middle East & Africa Agricultural Tractors Industry Revenue Share (%), by Country 2024 & 2032
                                                              60. Figure 60: Asia Pacific Agricultural Tractors Industry Revenue (Million), by Production Analysis 2024 & 2032
                                                              61. Figure 61: Asia Pacific Agricultural Tractors Industry Revenue Share (%), by Production Analysis 2024 & 2032
                                                              62. Figure 62: Asia Pacific Agricultural Tractors Industry Revenue (Million), by Consumption Analysis 2024 & 2032
                                                              63. Figure 63: Asia Pacific Agricultural Tractors Industry Revenue Share (%), by Consumption Analysis 2024 & 2032
                                                              64. Figure 64: Asia Pacific Agricultural Tractors Industry Revenue (Million), by Import Market Analysis (Value & Volume) 2024 & 2032
                                                              65. Figure 65: Asia Pacific Agricultural Tractors Industry Revenue Share (%), by Import Market Analysis (Value & Volume) 2024 & 2032
                                                              66. Figure 66: Asia Pacific Agricultural Tractors Industry Revenue (Million), by Export Market Analysis (Value & Volume) 2024 & 2032
                                                              67. Figure 67: Asia Pacific Agricultural Tractors Industry Revenue Share (%), by Export Market Analysis (Value & Volume) 2024 & 2032
                                                              68. Figure 68: Asia Pacific Agricultural Tractors Industry Revenue (Million), by Price Trend Analysis 2024 & 2032
                                                              69. Figure 69: Asia Pacific Agricultural Tractors Industry Revenue Share (%), by Price Trend Analysis 2024 & 2032
                                                              70. Figure 70: Asia Pacific Agricultural Tractors Industry Revenue (Million), by Country 2024 & 2032
                                                              71. Figure 71: Asia Pacific Agricultural Tractors Industry Revenue Share (%), by Country 2024 & 2032

                                                              List of Tables

                                                              1. Table 1: Global Agricultural Tractors Industry Revenue Million Forecast, by Region 2019 & 2032
                                                              2. Table 2: Global Agricultural Tractors Industry Revenue Million Forecast, by Production Analysis 2019 & 2032
                                                              3. Table 3: Global Agricultural Tractors Industry Revenue Million Forecast, by Consumption Analysis 2019 & 2032
                                                              4. Table 4: Global Agricultural Tractors Industry Revenue Million Forecast, by Import Market Analysis (Value & Volume) 2019 & 2032
                                                              5. Table 5: Global Agricultural Tractors Industry Revenue Million Forecast, by Export Market Analysis (Value & Volume) 2019 & 2032
                                                              6. Table 6: Global Agricultural Tractors Industry Revenue Million Forecast, by Price Trend Analysis 2019 & 2032
                                                              7. Table 7: Global Agricultural Tractors Industry Revenue Million Forecast, by Region 2019 & 2032
                                                              8. Table 8: Global Agricultural Tractors Industry Revenue Million Forecast, by Country 2019 & 2032
                                                              9. Table 9: United States Agricultural Tractors Industry Revenue (Million) Forecast, by Application 2019 & 2032
                                                              10. Table 10: Canada Agricultural Tractors Industry Revenue (Million) Forecast, by Application 2019 & 2032
                                                              11. Table 11: Mexico Agricultural Tractors Industry Revenue (Million) Forecast, by Application 2019 & 2032
                                                              12. Table 12: Rest of North America Agricultural Tractors Industry Revenue (Million) Forecast, by Application 2019 & 2032
                                                              13. Table 13: Global Agricultural Tractors Industry Revenue Million Forecast, by Country 2019 & 2032
                                                              14. Table 14: Germany Agricultural Tractors Industry Revenue (Million) Forecast, by Application 2019 & 2032
                                                              15. Table 15: United Kingdom Agricultural Tractors Industry Revenue (Million) Forecast, by Application 2019 & 2032
                                                              16. Table 16: France Agricultural Tractors Industry Revenue (Million) Forecast, by Application 2019 & 2032
                                                              17. Table 17: Spain Agricultural Tractors Industry Revenue (Million) Forecast, by Application 2019 & 2032
                                                              18. Table 18: Italy Agricultural Tractors Industry Revenue (Million) Forecast, by Application 2019 & 2032
                                                              19. Table 19: Russia Agricultural Tractors Industry Revenue (Million) Forecast, by Application 2019 & 2032
                                                              20. Table 20: Poland Agricultural Tractors Industry Revenue (Million) Forecast, by Application 2019 & 2032
                                                              21. Table 21: Rest of Europe Agricultural Tractors Industry Revenue (Million) Forecast, by Application 2019 & 2032
                                                              22. Table 22: Global Agricultural Tractors Industry Revenue Million Forecast, by Country 2019 & 2032
                                                              23. Table 23: China Agricultural Tractors Industry Revenue (Million) Forecast, by Application 2019 & 2032
                                                              24. Table 24: Japan Agricultural Tractors Industry Revenue (Million) Forecast, by Application 2019 & 2032
                                                              25. Table 25: India Agricultural Tractors Industry Revenue (Million) Forecast, by Application 2019 & 2032
                                                              26. Table 26: Australia Agricultural Tractors Industry Revenue (Million) Forecast, by Application 2019 & 2032
                                                              27. Table 27: Rest of Asia Pacific Agricultural Tractors Industry Revenue (Million) Forecast, by Application 2019 & 2032
                                                              28. Table 28: Global Agricultural Tractors Industry Revenue Million Forecast, by Country 2019 & 2032
                                                              29. Table 29: Brazil Agricultural Tractors Industry Revenue (Million) Forecast, by Application 2019 & 2032
                                                              30. Table 30: Argentina Agricultural Tractors Industry Revenue (Million) Forecast, by Application 2019 & 2032
                                                              31. Table 31: Rest of South America Agricultural Tractors Industry Revenue (Million) Forecast, by Application 2019 & 2032
                                                              32. Table 32: Global Agricultural Tractors Industry Revenue Million Forecast, by Country 2019 & 2032
                                                              33. Table 33: South Africa Agricultural Tractors Industry Revenue (Million) Forecast, by Application 2019 & 2032
                                                              34. Table 34: Rest of Africa Agricultural Tractors Industry Revenue (Million) Forecast, by Application 2019 & 2032
                                                              35. Table 35: Global Agricultural Tractors Industry Revenue Million Forecast, by Production Analysis 2019 & 2032
                                                              36. Table 36: Global Agricultural Tractors Industry Revenue Million Forecast, by Consumption Analysis 2019 & 2032
                                                              37. Table 37: Global Agricultural Tractors Industry Revenue Million Forecast, by Import Market Analysis (Value & Volume) 2019 & 2032
                                                              38. Table 38: Global Agricultural Tractors Industry Revenue Million Forecast, by Export Market Analysis (Value & Volume) 2019 & 2032
                                                              39. Table 39: Global Agricultural Tractors Industry Revenue Million Forecast, by Price Trend Analysis 2019 & 2032
                                                              40. Table 40: Global Agricultural Tractors Industry Revenue Million Forecast, by Country 2019 & 2032
                                                              41. Table 41: United States Agricultural Tractors Industry Revenue (Million) Forecast, by Application 2019 & 2032
                                                              42. Table 42: Canada Agricultural Tractors Industry Revenue (Million) Forecast, by Application 2019 & 2032
                                                              43. Table 43: Mexico Agricultural Tractors Industry Revenue (Million) Forecast, by Application 2019 & 2032
                                                              44. Table 44: Global Agricultural Tractors Industry Revenue Million Forecast, by Production Analysis 2019 & 2032
                                                              45. Table 45: Global Agricultural Tractors Industry Revenue Million Forecast, by Consumption Analysis 2019 & 2032
                                                              46. Table 46: Global Agricultural Tractors Industry Revenue Million Forecast, by Import Market Analysis (Value & Volume) 2019 & 2032
                                                              47. Table 47: Global Agricultural Tractors Industry Revenue Million Forecast, by Export Market Analysis (Value & Volume) 2019 & 2032
                                                              48. Table 48: Global Agricultural Tractors Industry Revenue Million Forecast, by Price Trend Analysis 2019 & 2032
                                                              49. Table 49: Global Agricultural Tractors Industry Revenue Million Forecast, by Country 2019 & 2032
                                                              50. Table 50: Brazil Agricultural Tractors Industry Revenue (Million) Forecast, by Application 2019 & 2032
                                                              51. Table 51: Argentina Agricultural Tractors Industry Revenue (Million) Forecast, by Application 2019 & 2032
                                                              52. Table 52: Rest of South America Agricultural Tractors Industry Revenue (Million) Forecast, by Application 2019 & 2032
                                                              53. Table 53: Global Agricultural Tractors Industry Revenue Million Forecast, by Production Analysis 2019 & 2032
                                                              54. Table 54: Global Agricultural Tractors Industry Revenue Million Forecast, by Consumption Analysis 2019 & 2032
                                                              55. Table 55: Global Agricultural Tractors Industry Revenue Million Forecast, by Import Market Analysis (Value & Volume) 2019 & 2032
                                                              56. Table 56: Global Agricultural Tractors Industry Revenue Million Forecast, by Export Market Analysis (Value & Volume) 2019 & 2032
                                                              57. Table 57: Global Agricultural Tractors Industry Revenue Million Forecast, by Price Trend Analysis 2019 & 2032
                                                              58. Table 58: Global Agricultural Tractors Industry Revenue Million Forecast, by Country 2019 & 2032
                                                              59. Table 59: United Kingdom Agricultural Tractors Industry Revenue (Million) Forecast, by Application 2019 & 2032
                                                              60. Table 60: Germany Agricultural Tractors Industry Revenue (Million) Forecast, by Application 2019 & 2032
                                                              61. Table 61: France Agricultural Tractors Industry Revenue (Million) Forecast, by Application 2019 & 2032
                                                              62. Table 62: Italy Agricultural Tractors Industry Revenue (Million) Forecast, by Application 2019 & 2032
                                                              63. Table 63: Spain Agricultural Tractors Industry Revenue (Million) Forecast, by Application 2019 & 2032
                                                              64. Table 64: Russia Agricultural Tractors Industry Revenue (Million) Forecast, by Application 2019 & 2032
                                                              65. Table 65: Benelux Agricultural Tractors Industry Revenue (Million) Forecast, by Application 2019 & 2032
                                                              66. Table 66: Nordics Agricultural Tractors Industry Revenue (Million) Forecast, by Application 2019 & 2032
                                                              67. Table 67: Rest of Europe Agricultural Tractors Industry Revenue (Million) Forecast, by Application 2019 & 2032
                                                              68. Table 68: Global Agricultural Tractors Industry Revenue Million Forecast, by Production Analysis 2019 & 2032
                                                              69. Table 69: Global Agricultural Tractors Industry Revenue Million Forecast, by Consumption Analysis 2019 & 2032
                                                              70. Table 70: Global Agricultural Tractors Industry Revenue Million Forecast, by Import Market Analysis (Value & Volume) 2019 & 2032
                                                              71. Table 71: Global Agricultural Tractors Industry Revenue Million Forecast, by Export Market Analysis (Value & Volume) 2019 & 2032
                                                              72. Table 72: Global Agricultural Tractors Industry Revenue Million Forecast, by Price Trend Analysis 2019 & 2032
                                                              73. Table 73: Global Agricultural Tractors Industry Revenue Million Forecast, by Country 2019 & 2032
                                                              74. Table 74: Turkey Agricultural Tractors Industry Revenue (Million) Forecast, by Application 2019 & 2032
                                                              75. Table 75: Israel Agricultural Tractors Industry Revenue (Million) Forecast, by Application 2019 & 2032
                                                              76. Table 76: GCC Agricultural Tractors Industry Revenue (Million) Forecast, by Application 2019 & 2032
                                                              77. Table 77: North Africa Agricultural Tractors Industry Revenue (Million) Forecast, by Application 2019 & 2032
                                                              78. Table 78: South Africa Agricultural Tractors Industry Revenue (Million) Forecast, by Application 2019 & 2032
                                                              79. Table 79: Rest of Middle East & Africa Agricultural Tractors Industry Revenue (Million) Forecast, by Application 2019 & 2032
                                                              80. Table 80: Global Agricultural Tractors Industry Revenue Million Forecast, by Production Analysis 2019 & 2032
                                                              81. Table 81: Global Agricultural Tractors Industry Revenue Million Forecast, by Consumption Analysis 2019 & 2032
                                                              82. Table 82: Global Agricultural Tractors Industry Revenue Million Forecast, by Import Market Analysis (Value & Volume) 2019 & 2032
                                                              83. Table 83: Global Agricultural Tractors Industry Revenue Million Forecast, by Export Market Analysis (Value & Volume) 2019 & 2032
                                                              84. Table 84: Global Agricultural Tractors Industry Revenue Million Forecast, by Price Trend Analysis 2019 & 2032
                                                              85. Table 85: Global Agricultural Tractors Industry Revenue Million Forecast, by Country 2019 & 2032
                                                              86. Table 86: China Agricultural Tractors Industry Revenue (Million) Forecast, by Application 2019 & 2032
                                                              87. Table 87: India Agricultural Tractors Industry Revenue (Million) Forecast, by Application 2019 & 2032
                                                              88. Table 88: Japan Agricultural Tractors Industry Revenue (Million) Forecast, by Application 2019 & 2032
                                                              89. Table 89: South Korea Agricultural Tractors Industry Revenue (Million) Forecast, by Application 2019 & 2032
                                                              90. Table 90: ASEAN Agricultural Tractors Industry Revenue (Million) Forecast, by Application 2019 & 2032
                                                              91. Table 91: Oceania Agricultural Tractors Industry Revenue (Million) Forecast, by Application 2019 & 2032
                                                              92. Table 92: Rest of Asia Pacific Agricultural Tractors Industry Revenue (Million) Forecast, by Application 2019 & 2032


                                                              Frequently Asked Questions

                                                              1. What is the projected Compound Annual Growth Rate (CAGR) of the Agricultural Tractors Industry?

                                                              The projected CAGR is approximately 5.20%.

                                                              2. Which companies are prominent players in the Agricultural Tractors Industry?

                                                              Key companies in the market include Iseki & Co Ltd, Deere & Company, CNH Industrial NV, Kubota Corporation, Mahindra & Mahindra Ltd, Claas KGaA mbH, Tractors and Farm Equipment Ltd, AGCO Corporation (Massey Ferguson Limited), Yanmar Holdings Co Lt.

                                                              3. What are the main segments of the Agricultural Tractors Industry?

                                                              The market segments include Production Analysis, Consumption Analysis, Import Market Analysis (Value & Volume), Export Market Analysis (Value & Volume), Price Trend Analysis.

                                                              4. Can you provide details about the market size?

                                                              The market size is estimated to be USD 70.40 Million as of 2022.

                                                              5. What are some drivers contributing to market growth?

                                                              Shortage of Skilled Labor; Government Support to Enhance Farm Mechanization.

                                                              6. What are the notable trends driving market growth?

                                                              Increasing Farm Mechanization in Developing Markets.

                                                              7. Are there any restraints impacting market growth?

                                                              Heavy Initial Procurement Cost and High Expenditure on Maintenance.

                                                              8. Can you provide examples of recent developments in the market?

                                                              November 2022: VST Tillers Tractors Ltd and ZETOR TRACTORS unveiled two best-in-class tractors at the CII Agro Tech India 2022 exhibition. These 45 HP and 50 HP category tractors are jointly developed by VST & ZETOR at their India & Czech Republic plants.

                                                              9. What pricing options are available for accessing the report?

                                                              Pricing options include single-user, multi-user, and enterprise licenses priced at USD 4750, USD 5250, and USD 8750 respectively.

                                                              10. Is the market size provided in terms of value or volume?

                                                              The market size is provided in terms of value, measured in Million.

                                                              11. Are there any specific market keywords associated with the report?

                                                              Yes, the market keyword associated with the report is "Agricultural Tractors Industry," which aids in identifying and referencing the specific market segment covered.

                                                              12. How do I determine which pricing option suits my needs best?

                                                              The pricing options vary based on user requirements and access needs. Individual users may opt for single-user licenses, while businesses requiring broader access may choose multi-user or enterprise licenses for cost-effective access to the report.

                                                              13. Are there any additional resources or data provided in the Agricultural Tractors Industry report?

                                                              While the report offers comprehensive insights, it's advisable to review the specific contents or supplementary materials provided to ascertain if additional resources or data are available.

                                                              14. How can I stay updated on further developments or reports in the Agricultural Tractors Industry?

                                                              To stay informed about further developments, trends, and reports in the Agricultural Tractors Industry, consider subscribing to industry newsletters, following relevant companies and organizations, or regularly checking reputable industry news sources and publications.


                                                              Methodology

                                                              Step 1 - Identification of Relevant Samples Size from Population Database

                                                              Step Chart
                                                              Bar Chart
                                                              Method Chart

                                                              Step 2 - Approaches for Defining Global Market Size (Value, Volume* & Price*)

                                                              Approach Chart
                                                              Top-down and bottom-up approaches are used to validate the global market size and estimate the market size for manufactures, regional segments, product, and application.

                                                              Note*: In applicable scenarios

                                                              Step 3 - Data Sources

                                                              Primary Research

                                                              • Web Analytics
                                                              • Survey Reports
                                                              • Research Institute
                                                              • Latest Research Reports
                                                              • Opinion Leaders

                                                              Secondary Research

                                                              • Annual Reports
                                                              • White Paper
                                                              • Latest Press Release
                                                              • Industry Association
                                                              • Paid Database
                                                              • Investor Presentations
                                                              Analyst Chart

                                                              Step 4 - Data Triangulation

                                                              Involves using different sources of information in order to increase the validity of a study

                                                              These sources are likely to be stakeholders in a program - participants, other researchers, program staff, other community members, and so on.

                                                              Then we put all data in single framework & apply various statistical tools to find out the dynamic on the market.

                                                              During the analysis stage, feedback from the stakeholder groups would be compared to determine areas of agreement as well as areas of divergence

                                                              Additionally, after gathering mixed and scattered data from a wide range of sources, data is triangulated and correlated to come up with estimated figures which are further validated through primary mediums or industry experts, opinion leaders.

                                                              About Research Axiom

                                                              Research Axiom delivers in-depth market research, industry analysis, and consulting for pharmaceuticals, automotive, IT, and consumer goods. Our reports provide the clarity you need to make informed decisions and drive innovation.

                                                              Our team combines primary research, advanced analytics, and sector expertise to deliver actionable intelligence. We offer syndicated reports, custom research, and consulting services tailored to your business needs.

                                                              At Research Axiom, we are committed to quality, transparency, and client satisfaction. Every report is rigorously validated to ensure accuracy and relevance. Our global perspective and local expertise help you understand both the big picture and the finer details of your market.

                                                              Stay informed with Research Axiom. Subscribe to our newsletter for the latest updates and research highlights, and follow us on social media for real-time insights. Research Axiom – Turning Data into Business Advantage.

                                                              artwork spiralartwork spiralRelated Reports
                                                              artwork underline

                                                              Bio Organic Fertilizer Market Insightful Market Analysis: Trends and Opportunities 2025-2033

                                                              The global bio organic fertilizer market is booming, projected to reach [estimated 2033 value] by 2033 with a CAGR of 5.90%. Discover key market trends, drivers, restraints, and leading companies shaping this sustainable agriculture sector. Learn more about organic fertilizer types, applications, and regional market analysis.

                                                              July 2025
                                                              Base Year: 2024
                                                              No Of Pages: 150
                                                              Price: $4750

                                                              Exploring Saudi Arabia Agriculture Market’s Market Size Dynamics 2025-2033

                                                              Discover the booming Saudi Arabia agriculture market! Projected to reach \$28.3 billion by 2033 with a 5.2% CAGR, this report analyzes market size, key players (Carrefour, Lulu Group), regional trends, and growth drivers. Learn about opportunities and challenges in this dynamic sector.

                                                              July 2025
                                                              Base Year: 2024
                                                              No Of Pages: 197
                                                              Price: $3800

                                                              Lentil Industry Charting Growth Trajectories 2025-2033: Strategic Insights and Forecasts

                                                              Discover the booming lentil market! Explore key trends, regional insights, and leading companies driving growth in this $X billion industry (2025 estimate) projected to reach $X billion by 2033. Learn about the rising demand for whole, split, and dehulled lentils in dry, canned, and frozen forms. Get the complete market analysis now!

                                                              July 2025
                                                              Base Year: 2024
                                                              No Of Pages: 234
                                                              Price: $4750

                                                              USA Agricultural Irrigation Machinery Market Soars to XXX Million, witnessing a CAGR of XX during the forecast period 2025-2033

                                                              Discover the booming US agricultural irrigation machinery market! This in-depth analysis reveals key trends, growth drivers, and leading companies from 2025-2033. Learn about the impact of precision agriculture, water scarcity, and government initiatives on the market's future. Explore segments like drip, sprinkler, and pivot irrigation systems.

                                                              July 2025
                                                              Base Year: 2024
                                                              No Of Pages: 150
                                                              Price: $3800

                                                              South America Biological Organic Fertilizers Industry 2025 to Grow at XX CAGR with XXX Million Market Size: Analysis and Forecasts 2033

                                                              Discover the booming South American biological organic fertilizer market! Projected to reach [estimated 2033 value based on CAGR] by 2033, this market is driven by sustainable agriculture trends and growing demand for eco-friendly farming. Learn about key players, market segments (cereals, legumes, fruits & vegetables), and growth opportunities in Brazil, Argentina, and beyond.

                                                              July 2025
                                                              Base Year: 2024
                                                              No Of Pages: 150
                                                              Price: $4750

                                                              Exploring Barriers in North American Olives Market Market: Trends and Analysis 2025-2033

                                                              Discover the booming North American olives market! This comprehensive analysis reveals a $6.9B market with a 5.74% CAGR (2025-2033), driven by health trends & Mediterranean diet popularity. Explore market segmentation, key players (Napa Valley Olive Oil, Musco Family Olive Co., etc.), and future growth projections for olive oil, table olives, and more.

                                                              July 2025
                                                              Base Year: 2024
                                                              No Of Pages: 180
                                                              Price: $4750

                                                              Analyzing Competitor Moves: Iran Agricultural Sector Analysis Growth Outlook 2025-2033

                                                              Discover the growth opportunities and challenges within Iran's agricultural sector. This comprehensive analysis covers market size, CAGR, key drivers, trends, and regional variations across food crops, cash crops, fruits, vegetables, dairy, and fishery from 2019-2033. Gain valuable insights into this dynamic market.

                                                              July 2025
                                                              Base Year: 2024
                                                              No Of Pages: 150
                                                              Price: $3800

                                                              South America Agricultual Films Market Market’s Drivers and Challenges: Strategic Overview 2025-2033

                                                              Discover the booming South American agricultural films market! This in-depth analysis reveals a CAGR of 6.10% to 2033, driven by growing demand for modern farming techniques and food security. Explore key trends, leading companies (Dow, Agroflex, etc.), and regional insights for Brazil, Argentina, and beyond. Learn how this expanding market presents lucrative opportunities.

                                                              July 2025
                                                              Base Year: 2024
                                                              No Of Pages: 150
                                                              Price: $4750

                                                              Analyzing Coffee Trade Analysis Industry: Opportunities and Growth Patterns 2025-2033

                                                              Discover the latest insights into the booming global coffee trade market. This comprehensive analysis reveals key trends, growth drivers, and market segmentation for Arabica, Robusta, and various coffee processing methods. Explore regional market shares and leading companies like Starbucks & Nestlé. Project your business strategy with our 2025-2033 forecast.

                                                              July 2025
                                                              Base Year: 2024
                                                              No Of Pages: 150
                                                              Price: $4750

                                                              Kiwi Fruit Market Insightful Market Analysis: Trends and Opportunities 2025-2033

                                                              Discover the booming kiwi fruit market! This comprehensive analysis reveals a $1.89B market in 2025, projected to reach significant heights by 2033 with a 5.02% CAGR. Explore key drivers, regional trends, and leading companies shaping this dynamic industry.

                                                              July 2025
                                                              Base Year: 2024
                                                              No Of Pages: 180
                                                              Price: $4750

                                                              Africa Chia Seeds Industry: Growth Opportunities and Competitive Landscape Overview 2025-2033

                                                              Discover the booming Africa chia seeds market! Explore its $13.87M valuation (2025), 2.10% CAGR, key segments (organic, food & beverage, supplements), and leading companies. Learn about growth drivers, trends, and regional insights (South Africa, UAE) in this comprehensive market analysis.

                                                              July 2025
                                                              Base Year: 2024
                                                              No Of Pages: 180
                                                              Price: $4750

                                                              China Pesticide Industry Market Report: Strategic Insights

                                                              Discover the booming China pesticide market, projected to reach $XX million by 2025 and grow at a CAGR of 6.60% until 2033. Analyze key trends, leading companies (Bayer, Syngenta, UPL), and market segmentation (fungicides, herbicides, insecticides, etc.) impacting this dynamic sector.

                                                              July 2025
                                                              Base Year: 2024
                                                              No Of Pages: 197
                                                              Price: $3800

                                                              Global Metal Chelates Market Future-proof Strategies: Trends, Competitor Dynamics, and Opportunities 2025-2033

                                                              Discover the booming global metal chelates market! This comprehensive analysis reveals a CAGR of 10.20%, driven by surging demand for efficient micronutrient delivery in agriculture. Explore market size, segmentation (crop type, product type, application), key players, and regional trends for 2025-2033.

                                                              July 2025
                                                              Base Year: 2024
                                                              No Of Pages: 197
                                                              Price: $3800

                                                              Fresh Cherries Industry CAGR Trends: Growth Outlook 2025-2033

                                                              Discover the booming fresh cherries market! This in-depth analysis reveals key trends, drivers, and restraints, along with regional market share data and projections to 2033. Learn about leading companies and explore growth opportunities in this lucrative sector.

                                                              July 2025
                                                              Base Year: 2024
                                                              No Of Pages: 180
                                                              Price: $4750

                                                              North American Wheat Seed Treatment 2025 Market Trends and 2033 Forecasts: Exploring Growth Potential

                                                              Discover the booming North American wheat seed treatment market! Learn about key growth drivers, emerging trends, major players like Bayer and Syngenta, and the projected CAGR of 7.30% through 2033. Explore market segmentation by product type, application, and crop type in this comprehensive analysis.

                                                              July 2025
                                                              Base Year: 2024
                                                              No Of Pages: 197
                                                              Price: $3800

                                                              Fresh Peaches Market Market Analysis and Forecasts

                                                              Discover the thriving fresh peaches market! This in-depth analysis reveals a projected CAGR of 3.20% to 2033, driven by health trends and culinary innovation. Explore market segmentation, key players like Del Monte and Dole, and regional growth projections for North America, Europe, and Asia Pacific. Learn more about the opportunities and challenges shaping this dynamic industry.

                                                              July 2025
                                                              Base Year: 2024
                                                              No Of Pages: 234
                                                              Price: $4750

                                                              Thailand Vegetable Seed Market’s Role in Shaping Industry Trends 2025-2033

                                                              Discover the booming Thailand vegetable seed market! This comprehensive analysis reveals a CAGR of 5.20% through 2033, driven by rising demand, technological advancements, and government initiatives. Explore market segmentation, key players, and future trends in this lucrative sector.

                                                              July 2025
                                                              Base Year: 2024
                                                              No Of Pages: 150
                                                              Price: $3800

                                                              Strategic Growth Drivers for Asia-Pacific Irrigation Machinery Market Market

                                                              Discover the booming Asia-Pacific irrigation machinery market! This in-depth analysis reveals a CAGR of 6.20%, driven by water scarcity and rising agricultural demands. Explore market trends, key players (Rain Bird, Netafim, Jain Irrigation), and regional insights. Learn how precision irrigation, drip irrigation, and sprinkler systems are shaping the future of farming.

                                                              July 2025
                                                              Base Year: 2024
                                                              No Of Pages: 150
                                                              Price: $3800

                                                              Analyzing the Future of United States Forage Seed Market: Key Trends to 2033

                                                              Discover the booming US forage seed market! This in-depth analysis reveals key trends, growth drivers, and market size projections (2025-2033), impacting livestock feed, sustainable agriculture, and leading companies like DLF International Seeds and Allied Seed LLC. Explore regional market shares and future opportunities.

                                                              July 2025
                                                              Base Year: 2024
                                                              No Of Pages: 197
                                                              Price: $3800

                                                              Cameroon Grains Industry Charting Growth Trajectories: Analysis and Forecasts 2025-2033

                                                              Discover the booming Cameroon grains industry: a comprehensive market analysis revealing a 4.80% CAGR, key players like Sodecoton and CDC, and future growth opportunities. Explore market size, trends, and challenges in this vital sector.

                                                              July 2025
                                                              Base Year: 2024
                                                              No Of Pages: 180
                                                              Price: $3800

                                                              Business Address

                                                              Head Office

                                                              Office no. A 5010, fifth floor, Solitaire Business Hub, Near Phoenix mall, Pune, Maharashtra 411014

                                                              Contact Information

                                                              Craig Francis

                                                              Business Development Head

                                                              +17162654855

                                                              [email protected]

                                                              Connect With Us

                                                              Secure Payment Partners

                                                              payment image
                                                              RetailLogisticsPackagingAutomotiveHealthcareAgricultureEnergy & PowerFood & BeverageAerospace & DefenseChemicals & MaterialsHospitality and TourismAnimal Nutrition & WellnessConsumer Goods and ServicesReal Estate and ConstructionHome and Property ImprovementTechnology, Media and TelecomManufacturing Products and ServicesFinancial Services and Investment Intelligence

                                                              © 2025 All rights reserved


                                                              Privacy Policy
                                                              Terms and Conditions
                                                              FAQ
                                                              • Home
                                                              • About Us
                                                              • Industries
                                                                • Aerospace & Defense
                                                                • Agriculture
                                                                • Animal Nutrition & Wellness
                                                                • Automotive
                                                                • Chemicals & Materials
                                                                • Consumer Goods and Services
                                                                • Energy & Power
                                                                • Financial Services and Investment Intelligence
                                                                • Food & Beverage
                                                                • Home and Property Improvement
                                                                • Hospitality and Tourism
                                                                • Logistics
                                                                • Manufacturing Products and Services
                                                                • Packaging
                                                                • Professional and Commercial Services
                                                                • Real Estate and Construction
                                                                • Retail
                                                                • Technology, Media and Telecom
                                                                • Healthcare
                                                              • Services
                                                              • Contact
                                                              Main Logo
                                                              • Home
                                                              • About Us
                                                              • Industries
                                                                • Aerospace & Defense
                                                                • Agriculture
                                                                • Animal Nutrition & Wellness
                                                                • Automotive
                                                                • Chemicals & Materials
                                                                • Consumer Goods and Services
                                                                • Energy & Power
                                                                • Financial Services and Investment Intelligence
                                                                • Food & Beverage
                                                                • Home and Property Improvement
                                                                • Hospitality and Tourism
                                                                • Logistics
                                                                • Manufacturing Products and Services
                                                                • Packaging
                                                                • Professional and Commercial Services
                                                                • Real Estate and Construction
                                                                • Retail
                                                                • Technology, Media and Telecom
                                                                • Healthcare
                                                              • Services
                                                              • Contact
                                                              +17162654855
                                                              [email protected]

                                                              +17162654855

                                                              [email protected]