
Key Insights
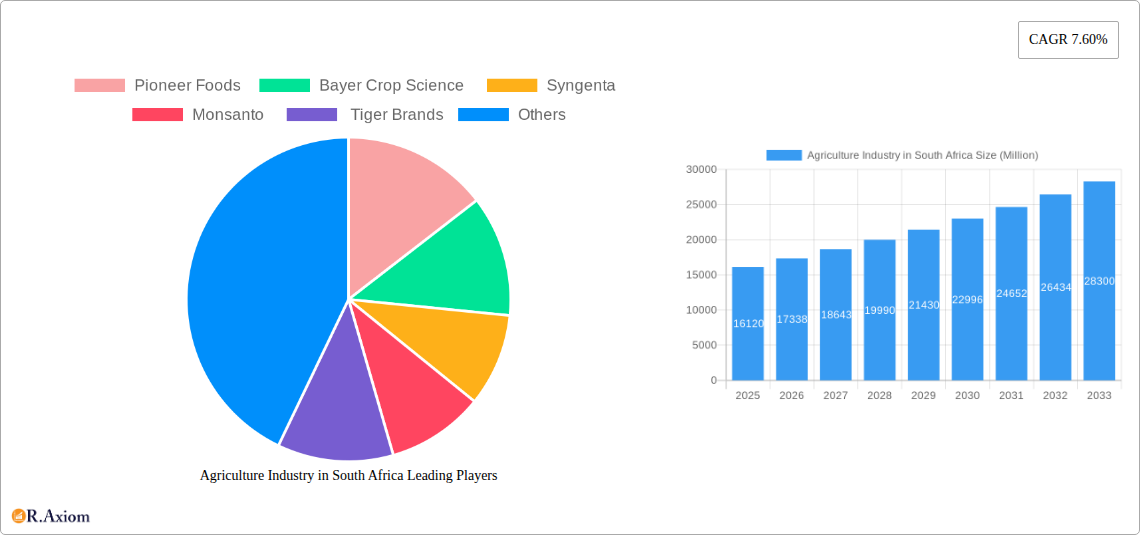
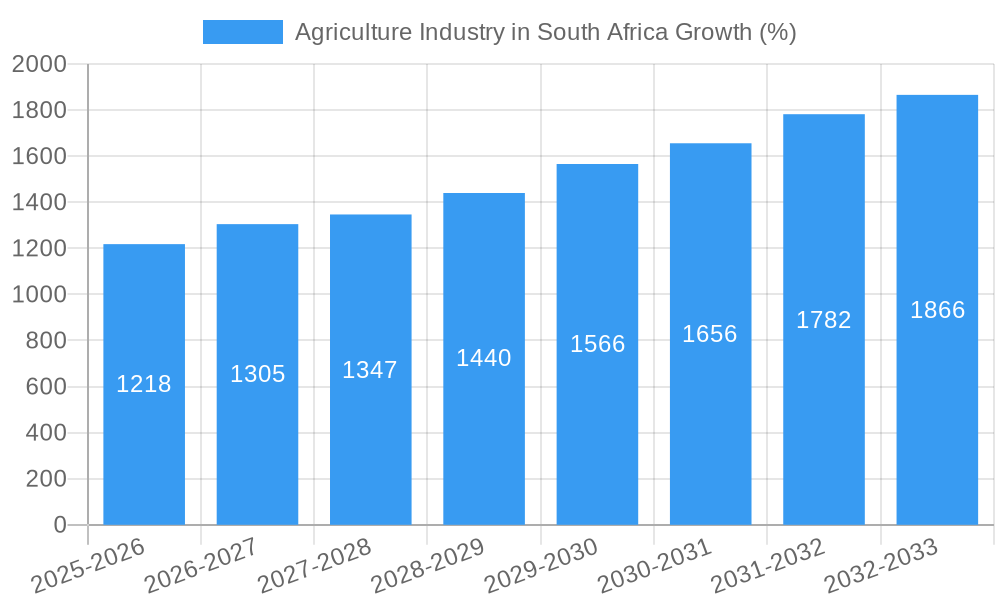
The South African agricultural industry, valued at $16.12 billion in 2025, is projected to experience robust growth, driven by increasing domestic demand, favorable government policies promoting agricultural development, and rising exports of key crops like cereals, fruits, vegetables, and oilseeds. A Compound Annual Growth Rate (CAGR) of 7.60% is anticipated from 2025 to 2033, indicating a significant expansion of the market. Key drivers include technological advancements in farming techniques (precision agriculture, improved irrigation), growing consumer awareness of healthy eating leading to higher demand for fresh produce, and diversification into higher-value crops. Major players like Pioneer Foods, Bayer Crop Science, Syngenta, Monsanto, and Tiger Brands are strategically positioned to capitalize on these trends, investing in research and development, expanding distribution networks, and exploring opportunities in value-added agricultural products. While challenges remain, such as climate change impacts (droughts and erratic rainfall), land reform complexities, and infrastructure limitations in certain regions, the overall outlook for the South African agricultural sector remains positive, suggesting considerable investment opportunities.
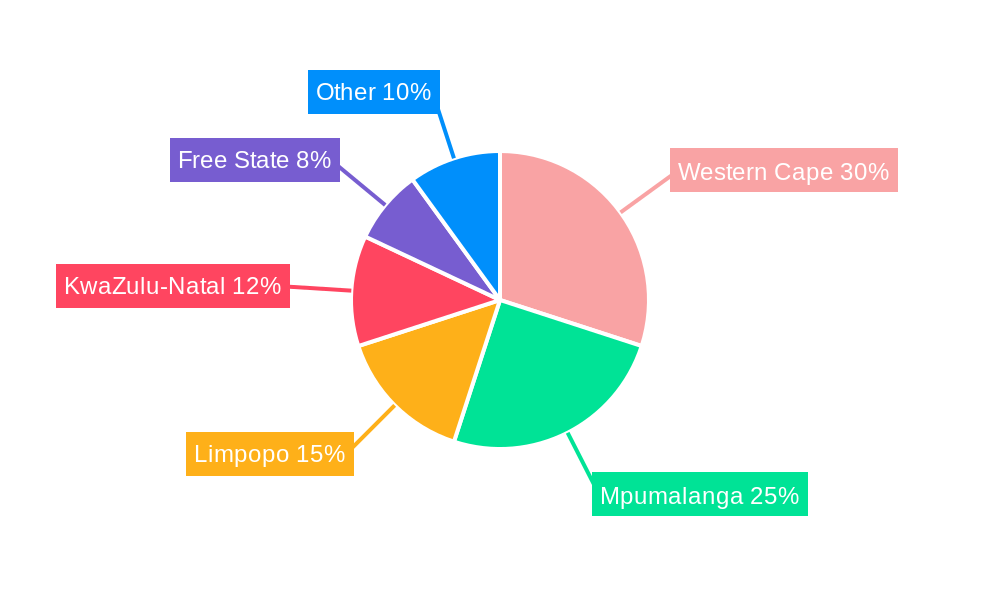
The segmental breakdown reveals cereals, fruits, and vegetables as dominant contributors to the market, with oilseeds showing significant growth potential given increasing global demand for biofuels and sustainable food sources. Regional variations exist within South Africa, with regions like the Western Cape and Mpumalanga contributing substantially due to favorable climatic conditions and established agricultural infrastructure. The forecast period (2025-2033) will witness continued market consolidation, with larger companies acquiring smaller entities and integrating vertical value chains to enhance efficiency and profitability. Continued government investment in agricultural infrastructure, research and extension services, and market access programs will be crucial for sustaining the projected growth trajectory and ensuring the long-term sustainability of the South African agricultural sector.
Agriculture Industry in South Africa: A Comprehensive Market Report (2019-2033)
This in-depth report provides a comprehensive analysis of the South African agriculture industry, offering valuable insights for stakeholders, investors, and industry professionals. Covering the period 2019-2033, with a focus on 2025, this report unveils the market's dynamics, growth drivers, challenges, and future opportunities. The study meticulously examines market concentration, innovation, trends, dominant segments, and leading players, delivering actionable intelligence to navigate the complexities of this vital sector.
Agriculture Industry in South Africa Market Concentration & Innovation
The South African agriculture industry exhibits a moderately concentrated market structure, with a few large players like Pioneer Foods, Tiger Brands, and multinational corporations such as Bayer Crop Science and Syngenta holding significant market share. Precise market share figures for 2025 are unavailable (xx%), but estimates suggest a combined share of around 40% for these companies. This concentration is influenced by factors including economies of scale, access to advanced technologies, and established distribution networks.
Innovation in the sector is driven by the need to enhance productivity, improve crop yields, and mitigate the impact of climate change. Regulatory frameworks, such as those related to GMOs and sustainable farming practices, play a crucial role. Product substitutes, such as alternative protein sources, are gradually emerging, but their market penetration remains limited (xx% in 2025). End-user trends increasingly favor sustainably produced, high-quality agricultural products. M&A activities have been moderate in recent years, with deal values totaling approximately xx Million in the period 2019-2024. Future M&A activity is anticipated to increase as companies seek to consolidate market share and gain access to new technologies and markets.
Agriculture Industry in South Africa Industry Trends & Insights
The South African agriculture industry is experiencing moderate growth, driven primarily by increasing domestic demand, growing exports, and government initiatives supporting agricultural development. The Compound Annual Growth Rate (CAGR) for the period 2025-2033 is projected to be xx%. Technological disruptions, particularly in precision agriculture, data analytics, and biotechnology, are transforming farming practices, enhancing efficiency, and boosting yields. Consumer preferences are shifting towards healthier and more sustainably produced food, creating opportunities for organic and ethically sourced products. The competitive landscape is characterized by intense competition among established players and the emergence of new entrants. Market penetration of advanced technologies is gradually increasing, with adoption rates varying across different segments and regions. These factors collectively contribute to the evolving dynamics of the South African agriculture industry.
Dominant Markets & Segments in Agriculture Industry in South Africa
While precise data for regional dominance is unavailable, the Western Cape is considered a highly productive region due to its favorable climate and established infrastructure. In terms of crop types, Cereals (including maize, wheat, and sorghum) constitute the largest segment in 2025 (xx Million), followed by fruits and vegetables.
- Key Drivers for Cereal Dominance:
- Favorable climatic conditions in several regions.
- Government support programs for cereal production.
- Established processing and distribution infrastructure.
- Strong domestic and export demand.
Oilseeds are a significant segment, crucial for the production of edible oils and animal feed. Vegetables and fruits contribute substantially to the overall agricultural output, with substantial export potential. The dominance of each segment is subject to fluctuations based on factors like weather patterns, global demand, and government policies. A detailed analysis of regional variations and segment-specific growth trajectories is provided in the full report.
Agriculture Industry in South Africa Product Developments
Recent product innovations focus on drought-resistant and high-yielding crop varieties, improved pest and disease management solutions, and precision farming technologies. These advancements aim to enhance productivity, reduce input costs, and improve the quality and sustainability of agricultural output. The adoption of these innovations is gradually increasing, but faces challenges related to technology access and affordability, especially among smallholder farmers. The market fit for these products depends on factors such as cost-effectiveness, ease of use, and compatibility with existing farming practices.
Report Scope & Segmentation Analysis
This report segments the South African agriculture industry by crop type: Cereals, Fruits, Vegetables, and Oilseeds. Each segment is analyzed based on market size (in Million), growth projections, and competitive dynamics.
- Cereals: This segment holds the largest market share in 2025 (xx Million) with significant growth projected driven by domestic demand and exports.
- Fruits: The fruit segment exhibits moderate growth, driven by demand for both fresh produce and processed products. Competition is relatively high.
- Vegetables: Similar to fruits, the vegetable segment shows moderate growth potential, influenced by increasing health consciousness and diverse consumer preferences.
- Oilseeds: This segment experiences fluctuating growth driven by global oilseed prices and domestic demand for edible oils and animal feed.
Key Drivers of Agriculture Industry in South Africa Growth
Several key factors drive growth in the South African agriculture industry. Government initiatives to support agricultural development, including investment in infrastructure and research, play a vital role. Technological advancements, particularly in precision farming and biotechnology, significantly enhance productivity. Increasing domestic demand for food products and growing export opportunities further fuel market expansion. Moreover, favorable climatic conditions in certain regions contribute to high crop yields.
Challenges in the Agriculture Industry in South Africa Sector
The South African agriculture industry faces several challenges. Climate change, including droughts and unpredictable weather patterns, poses a significant threat to crop yields and overall productivity. Land reform issues and unequal access to resources impact the sector's equity and efficiency. Furthermore, supply chain inefficiencies and limitations in storage and transportation infrastructure hinder market access. These challenges significantly impact the industry’s overall profitability and sustainability.
Emerging Opportunities in Agriculture Industry in South Africa
The industry presents several promising opportunities. Growing demand for organic and sustainably produced food offers considerable potential for niche markets. Technological advancements, especially in precision agriculture, data analytics, and automation, present opportunities for improved efficiency and profitability. Value addition through processing and export of agricultural products provides avenues for economic growth. Addressing the challenges related to climate change and sustainable farming practices is a critical area for future investment and innovation.
Leading Players in the Agriculture Industry in South Africa Market
- Pioneer Foods
- Bayer Crop Science
- Syngenta
- Monsanto (Note: Monsanto is now part of Bayer)
- Tiger Brands
Key Developments in Agriculture Industry in South Africa Industry
- 2022: Government announces increased funding for agricultural research and development.
- 2023: Launch of a new drought-resistant maize variety by a local seed company.
- 2024: Significant investment in modernizing agricultural infrastructure by private companies.
- 2025: Increased adoption of precision farming technologies by larger farms.
- (Further developments will be detailed in the full report.)
Strategic Outlook for Agriculture Industry in South Africa Market
The South African agriculture industry's future holds significant potential. Continued investment in technology, infrastructure, and research is crucial to enhance productivity and competitiveness. Addressing the challenges related to climate change and sustainable farming practices is essential for long-term growth. Focusing on value addition through processing and export, along with embracing innovative farming techniques, will unlock the industry's vast potential. The market is poised for moderate but steady growth in the coming years, supported by increasing domestic demand and emerging export opportunities.
Agriculture Industry in South Africa Segmentation
-
1. Crop Type
- 1.1. Cereals
- 1.2. Fruits
- 1.3. Vegetables
- 1.4. Oilseeds
-
2. Crop Type
- 2.1. Cereals
- 2.2. Fruits
- 2.3. Vegetables
- 2.4. Oilseeds
Agriculture Industry in South Africa Segmentation By Geography
-
1. North America
- 1.1. United States
- 1.2. Canada
- 1.3. Mexico
-
2. South America
- 2.1. Brazil
- 2.2. Argentina
- 2.3. Rest of South America
-
3. Europe
- 3.1. United Kingdom
- 3.2. Germany
- 3.3. France
- 3.4. Italy
- 3.5. Spain
- 3.6. Russia
- 3.7. Benelux
- 3.8. Nordics
- 3.9. Rest of Europe
-
4. Middle East & Africa
- 4.1. Turkey
- 4.2. Israel
- 4.3. GCC
- 4.4. North Africa
- 4.5. South Africa
- 4.6. Rest of Middle East & Africa
-
5. Asia Pacific
- 5.1. China
- 5.2. India
- 5.3. Japan
- 5.4. South Korea
- 5.5. ASEAN
- 5.6. Oceania
- 5.7. Rest of Asia Pacific
Agriculture Industry in South Africa REPORT HIGHLIGHTS
| Aspects | Details |
|---|---|
| Study Period | 2019-2033 |
| Base Year | 2024 |
| Estimated Year | 2025 |
| Forecast Period | 2025-2033 |
| Historical Period | 2019-2024 |
| Growth Rate | CAGR of 7.60% from 2019-2033 |
| Segmentation |
|
Table of Contents
- 1. Introduction
- 1.1. Research Scope
- 1.2. Market Segmentation
- 1.3. Research Methodology
- 1.4. Definitions and Assumptions
- 2. Executive Summary
- 2.1. Introduction
- 3. Market Dynamics
- 3.1. Introduction
- 3.2. Market Drivers
- 3.2.1. Rising Consumption of Cashew Nuts as a Healthy Snack; Increasing Government initiatives; Growing Cashew Nut Imports in The United States
- 3.3. Market Restrains
- 3.3.1. Hazardous Climatic Condition Hinders Cashew Production; Stringent Regulations Related To Food Quality Standards
- 3.4. Market Trends
- 3.4.1. High Demand for Food Crops with the rising population
- 4. Market Factor Analysis
- 4.1. Porters Five Forces
- 4.2. Supply/Value Chain
- 4.3. PESTEL analysis
- 4.4. Market Entropy
- 4.5. Patent/Trademark Analysis
- 5. Global Agriculture Industry in South Africa Analysis, Insights and Forecast, 2019-2031
- 5.1. Market Analysis, Insights and Forecast - by Crop Type
- 5.1.1. Cereals
- 5.1.2. Fruits
- 5.1.3. Vegetables
- 5.1.4. Oilseeds
- 5.2. Market Analysis, Insights and Forecast - by Crop Type
- 5.2.1. Cereals
- 5.2.2. Fruits
- 5.2.3. Vegetables
- 5.2.4. Oilseeds
- 5.3. Market Analysis, Insights and Forecast - by Region
- 5.3.1. North America
- 5.3.2. South America
- 5.3.3. Europe
- 5.3.4. Middle East & Africa
- 5.3.5. Asia Pacific
- 5.1. Market Analysis, Insights and Forecast - by Crop Type
- 6. North America Agriculture Industry in South Africa Analysis, Insights and Forecast, 2019-2031
- 6.1. Market Analysis, Insights and Forecast - by Crop Type
- 6.1.1. Cereals
- 6.1.2. Fruits
- 6.1.3. Vegetables
- 6.1.4. Oilseeds
- 6.2. Market Analysis, Insights and Forecast - by Crop Type
- 6.2.1. Cereals
- 6.2.2. Fruits
- 6.2.3. Vegetables
- 6.2.4. Oilseeds
- 6.1. Market Analysis, Insights and Forecast - by Crop Type
- 7. South America Agriculture Industry in South Africa Analysis, Insights and Forecast, 2019-2031
- 7.1. Market Analysis, Insights and Forecast - by Crop Type
- 7.1.1. Cereals
- 7.1.2. Fruits
- 7.1.3. Vegetables
- 7.1.4. Oilseeds
- 7.2. Market Analysis, Insights and Forecast - by Crop Type
- 7.2.1. Cereals
- 7.2.2. Fruits
- 7.2.3. Vegetables
- 7.2.4. Oilseeds
- 7.1. Market Analysis, Insights and Forecast - by Crop Type
- 8. Europe Agriculture Industry in South Africa Analysis, Insights and Forecast, 2019-2031
- 8.1. Market Analysis, Insights and Forecast - by Crop Type
- 8.1.1. Cereals
- 8.1.2. Fruits
- 8.1.3. Vegetables
- 8.1.4. Oilseeds
- 8.2. Market Analysis, Insights and Forecast - by Crop Type
- 8.2.1. Cereals
- 8.2.2. Fruits
- 8.2.3. Vegetables
- 8.2.4. Oilseeds
- 8.1. Market Analysis, Insights and Forecast - by Crop Type
- 9. Middle East & Africa Agriculture Industry in South Africa Analysis, Insights and Forecast, 2019-2031
- 9.1. Market Analysis, Insights and Forecast - by Crop Type
- 9.1.1. Cereals
- 9.1.2. Fruits
- 9.1.3. Vegetables
- 9.1.4. Oilseeds
- 9.2. Market Analysis, Insights and Forecast - by Crop Type
- 9.2.1. Cereals
- 9.2.2. Fruits
- 9.2.3. Vegetables
- 9.2.4. Oilseeds
- 9.1. Market Analysis, Insights and Forecast - by Crop Type
- 10. Asia Pacific Agriculture Industry in South Africa Analysis, Insights and Forecast, 2019-2031
- 10.1. Market Analysis, Insights and Forecast - by Crop Type
- 10.1.1. Cereals
- 10.1.2. Fruits
- 10.1.3. Vegetables
- 10.1.4. Oilseeds
- 10.2. Market Analysis, Insights and Forecast - by Crop Type
- 10.2.1. Cereals
- 10.2.2. Fruits
- 10.2.3. Vegetables
- 10.2.4. Oilseeds
- 10.1. Market Analysis, Insights and Forecast - by Crop Type
- 11. South Africa Agriculture Industry in South Africa Analysis, Insights and Forecast, 2019-2031
- 12. Sudan Agriculture Industry in South Africa Analysis, Insights and Forecast, 2019-2031
- 13. Uganda Agriculture Industry in South Africa Analysis, Insights and Forecast, 2019-2031
- 14. Tanzania Agriculture Industry in South Africa Analysis, Insights and Forecast, 2019-2031
- 15. Kenya Agriculture Industry in South Africa Analysis, Insights and Forecast, 2019-2031
- 16. Rest of Africa Agriculture Industry in South Africa Analysis, Insights and Forecast, 2019-2031
- 17. Competitive Analysis
- 17.1. Global Market Share Analysis 2024
- 17.2. Company Profiles
- 17.2.1 Pioneer Foods
- 17.2.1.1. Overview
- 17.2.1.2. Products
- 17.2.1.3. SWOT Analysis
- 17.2.1.4. Recent Developments
- 17.2.1.5. Financials (Based on Availability)
- 17.2.2 Bayer Crop Science
- 17.2.2.1. Overview
- 17.2.2.2. Products
- 17.2.2.3. SWOT Analysis
- 17.2.2.4. Recent Developments
- 17.2.2.5. Financials (Based on Availability)
- 17.2.3 Syngenta
- 17.2.3.1. Overview
- 17.2.3.2. Products
- 17.2.3.3. SWOT Analysis
- 17.2.3.4. Recent Developments
- 17.2.3.5. Financials (Based on Availability)
- 17.2.4 Monsanto
- 17.2.4.1. Overview
- 17.2.4.2. Products
- 17.2.4.3. SWOT Analysis
- 17.2.4.4. Recent Developments
- 17.2.4.5. Financials (Based on Availability)
- 17.2.5 Tiger Brands
- 17.2.5.1. Overview
- 17.2.5.2. Products
- 17.2.5.3. SWOT Analysis
- 17.2.5.4. Recent Developments
- 17.2.5.5. Financials (Based on Availability)
- 17.2.1 Pioneer Foods
List of Figures
- Figure 1: Global Agriculture Industry in South Africa Revenue Breakdown (Million, %) by Region 2024 & 2032
- Figure 2: Africa Agriculture Industry in South Africa Revenue (Million), by Country 2024 & 2032
- Figure 3: Africa Agriculture Industry in South Africa Revenue Share (%), by Country 2024 & 2032
- Figure 4: North America Agriculture Industry in South Africa Revenue (Million), by Crop Type 2024 & 2032
- Figure 5: North America Agriculture Industry in South Africa Revenue Share (%), by Crop Type 2024 & 2032
- Figure 6: North America Agriculture Industry in South Africa Revenue (Million), by Crop Type 2024 & 2032
- Figure 7: North America Agriculture Industry in South Africa Revenue Share (%), by Crop Type 2024 & 2032
- Figure 8: North America Agriculture Industry in South Africa Revenue (Million), by Country 2024 & 2032
- Figure 9: North America Agriculture Industry in South Africa Revenue Share (%), by Country 2024 & 2032
- Figure 10: South America Agriculture Industry in South Africa Revenue (Million), by Crop Type 2024 & 2032
- Figure 11: South America Agriculture Industry in South Africa Revenue Share (%), by Crop Type 2024 & 2032
- Figure 12: South America Agriculture Industry in South Africa Revenue (Million), by Crop Type 2024 & 2032
- Figure 13: South America Agriculture Industry in South Africa Revenue Share (%), by Crop Type 2024 & 2032
- Figure 14: South America Agriculture Industry in South Africa Revenue (Million), by Country 2024 & 2032
- Figure 15: South America Agriculture Industry in South Africa Revenue Share (%), by Country 2024 & 2032
- Figure 16: Europe Agriculture Industry in South Africa Revenue (Million), by Crop Type 2024 & 2032
- Figure 17: Europe Agriculture Industry in South Africa Revenue Share (%), by Crop Type 2024 & 2032
- Figure 18: Europe Agriculture Industry in South Africa Revenue (Million), by Crop Type 2024 & 2032
- Figure 19: Europe Agriculture Industry in South Africa Revenue Share (%), by Crop Type 2024 & 2032
- Figure 20: Europe Agriculture Industry in South Africa Revenue (Million), by Country 2024 & 2032
- Figure 21: Europe Agriculture Industry in South Africa Revenue Share (%), by Country 2024 & 2032
- Figure 22: Middle East & Africa Agriculture Industry in South Africa Revenue (Million), by Crop Type 2024 & 2032
- Figure 23: Middle East & Africa Agriculture Industry in South Africa Revenue Share (%), by Crop Type 2024 & 2032
- Figure 24: Middle East & Africa Agriculture Industry in South Africa Revenue (Million), by Crop Type 2024 & 2032
- Figure 25: Middle East & Africa Agriculture Industry in South Africa Revenue Share (%), by Crop Type 2024 & 2032
- Figure 26: Middle East & Africa Agriculture Industry in South Africa Revenue (Million), by Country 2024 & 2032
- Figure 27: Middle East & Africa Agriculture Industry in South Africa Revenue Share (%), by Country 2024 & 2032
- Figure 28: Asia Pacific Agriculture Industry in South Africa Revenue (Million), by Crop Type 2024 & 2032
- Figure 29: Asia Pacific Agriculture Industry in South Africa Revenue Share (%), by Crop Type 2024 & 2032
- Figure 30: Asia Pacific Agriculture Industry in South Africa Revenue (Million), by Crop Type 2024 & 2032
- Figure 31: Asia Pacific Agriculture Industry in South Africa Revenue Share (%), by Crop Type 2024 & 2032
- Figure 32: Asia Pacific Agriculture Industry in South Africa Revenue (Million), by Country 2024 & 2032
- Figure 33: Asia Pacific Agriculture Industry in South Africa Revenue Share (%), by Country 2024 & 2032
List of Tables
- Table 1: Global Agriculture Industry in South Africa Revenue Million Forecast, by Region 2019 & 2032
- Table 2: Global Agriculture Industry in South Africa Revenue Million Forecast, by Crop Type 2019 & 2032
- Table 3: Global Agriculture Industry in South Africa Revenue Million Forecast, by Crop Type 2019 & 2032
- Table 4: Global Agriculture Industry in South Africa Revenue Million Forecast, by Region 2019 & 2032
- Table 5: Global Agriculture Industry in South Africa Revenue Million Forecast, by Country 2019 & 2032
- Table 6: South Africa Agriculture Industry in South Africa Revenue (Million) Forecast, by Application 2019 & 2032
- Table 7: Sudan Agriculture Industry in South Africa Revenue (Million) Forecast, by Application 2019 & 2032
- Table 8: Uganda Agriculture Industry in South Africa Revenue (Million) Forecast, by Application 2019 & 2032
- Table 9: Tanzania Agriculture Industry in South Africa Revenue (Million) Forecast, by Application 2019 & 2032
- Table 10: Kenya Agriculture Industry in South Africa Revenue (Million) Forecast, by Application 2019 & 2032
- Table 11: Rest of Africa Agriculture Industry in South Africa Revenue (Million) Forecast, by Application 2019 & 2032
- Table 12: Global Agriculture Industry in South Africa Revenue Million Forecast, by Crop Type 2019 & 2032
- Table 13: Global Agriculture Industry in South Africa Revenue Million Forecast, by Crop Type 2019 & 2032
- Table 14: Global Agriculture Industry in South Africa Revenue Million Forecast, by Country 2019 & 2032
- Table 15: United States Agriculture Industry in South Africa Revenue (Million) Forecast, by Application 2019 & 2032
- Table 16: Canada Agriculture Industry in South Africa Revenue (Million) Forecast, by Application 2019 & 2032
- Table 17: Mexico Agriculture Industry in South Africa Revenue (Million) Forecast, by Application 2019 & 2032
- Table 18: Global Agriculture Industry in South Africa Revenue Million Forecast, by Crop Type 2019 & 2032
- Table 19: Global Agriculture Industry in South Africa Revenue Million Forecast, by Crop Type 2019 & 2032
- Table 20: Global Agriculture Industry in South Africa Revenue Million Forecast, by Country 2019 & 2032
- Table 21: Brazil Agriculture Industry in South Africa Revenue (Million) Forecast, by Application 2019 & 2032
- Table 22: Argentina Agriculture Industry in South Africa Revenue (Million) Forecast, by Application 2019 & 2032
- Table 23: Rest of South America Agriculture Industry in South Africa Revenue (Million) Forecast, by Application 2019 & 2032
- Table 24: Global Agriculture Industry in South Africa Revenue Million Forecast, by Crop Type 2019 & 2032
- Table 25: Global Agriculture Industry in South Africa Revenue Million Forecast, by Crop Type 2019 & 2032
- Table 26: Global Agriculture Industry in South Africa Revenue Million Forecast, by Country 2019 & 2032
- Table 27: United Kingdom Agriculture Industry in South Africa Revenue (Million) Forecast, by Application 2019 & 2032
- Table 28: Germany Agriculture Industry in South Africa Revenue (Million) Forecast, by Application 2019 & 2032
- Table 29: France Agriculture Industry in South Africa Revenue (Million) Forecast, by Application 2019 & 2032
- Table 30: Italy Agriculture Industry in South Africa Revenue (Million) Forecast, by Application 2019 & 2032
- Table 31: Spain Agriculture Industry in South Africa Revenue (Million) Forecast, by Application 2019 & 2032
- Table 32: Russia Agriculture Industry in South Africa Revenue (Million) Forecast, by Application 2019 & 2032
- Table 33: Benelux Agriculture Industry in South Africa Revenue (Million) Forecast, by Application 2019 & 2032
- Table 34: Nordics Agriculture Industry in South Africa Revenue (Million) Forecast, by Application 2019 & 2032
- Table 35: Rest of Europe Agriculture Industry in South Africa Revenue (Million) Forecast, by Application 2019 & 2032
- Table 36: Global Agriculture Industry in South Africa Revenue Million Forecast, by Crop Type 2019 & 2032
- Table 37: Global Agriculture Industry in South Africa Revenue Million Forecast, by Crop Type 2019 & 2032
- Table 38: Global Agriculture Industry in South Africa Revenue Million Forecast, by Country 2019 & 2032
- Table 39: Turkey Agriculture Industry in South Africa Revenue (Million) Forecast, by Application 2019 & 2032
- Table 40: Israel Agriculture Industry in South Africa Revenue (Million) Forecast, by Application 2019 & 2032
- Table 41: GCC Agriculture Industry in South Africa Revenue (Million) Forecast, by Application 2019 & 2032
- Table 42: North Africa Agriculture Industry in South Africa Revenue (Million) Forecast, by Application 2019 & 2032
- Table 43: South Africa Agriculture Industry in South Africa Revenue (Million) Forecast, by Application 2019 & 2032
- Table 44: Rest of Middle East & Africa Agriculture Industry in South Africa Revenue (Million) Forecast, by Application 2019 & 2032
- Table 45: Global Agriculture Industry in South Africa Revenue Million Forecast, by Crop Type 2019 & 2032
- Table 46: Global Agriculture Industry in South Africa Revenue Million Forecast, by Crop Type 2019 & 2032
- Table 47: Global Agriculture Industry in South Africa Revenue Million Forecast, by Country 2019 & 2032
- Table 48: China Agriculture Industry in South Africa Revenue (Million) Forecast, by Application 2019 & 2032
- Table 49: India Agriculture Industry in South Africa Revenue (Million) Forecast, by Application 2019 & 2032
- Table 50: Japan Agriculture Industry in South Africa Revenue (Million) Forecast, by Application 2019 & 2032
- Table 51: South Korea Agriculture Industry in South Africa Revenue (Million) Forecast, by Application 2019 & 2032
- Table 52: ASEAN Agriculture Industry in South Africa Revenue (Million) Forecast, by Application 2019 & 2032
- Table 53: Oceania Agriculture Industry in South Africa Revenue (Million) Forecast, by Application 2019 & 2032
- Table 54: Rest of Asia Pacific Agriculture Industry in South Africa Revenue (Million) Forecast, by Application 2019 & 2032
Frequently Asked Questions
1. What is the projected Compound Annual Growth Rate (CAGR) of the Agriculture Industry in South Africa?
The projected CAGR is approximately 7.60%.
2. Which companies are prominent players in the Agriculture Industry in South Africa?
Key companies in the market include Pioneer Foods , Bayer Crop Science , Syngenta , Monsanto , Tiger Brands.
3. What are the main segments of the Agriculture Industry in South Africa?
The market segments include Crop Type, Crop Type.
4. Can you provide details about the market size?
The market size is estimated to be USD 16.12 Million as of 2022.
5. What are some drivers contributing to market growth?
Rising Consumption of Cashew Nuts as a Healthy Snack; Increasing Government initiatives; Growing Cashew Nut Imports in The United States.
6. What are the notable trends driving market growth?
High Demand for Food Crops with the rising population.
7. Are there any restraints impacting market growth?
Hazardous Climatic Condition Hinders Cashew Production; Stringent Regulations Related To Food Quality Standards.
8. Can you provide examples of recent developments in the market?
N/A
9. What pricing options are available for accessing the report?
Pricing options include single-user, multi-user, and enterprise licenses priced at USD 3800, USD 4500, and USD 5800 respectively.
10. Is the market size provided in terms of value or volume?
The market size is provided in terms of value, measured in Million.
11. Are there any specific market keywords associated with the report?
Yes, the market keyword associated with the report is "Agriculture Industry in South Africa," which aids in identifying and referencing the specific market segment covered.
12. How do I determine which pricing option suits my needs best?
The pricing options vary based on user requirements and access needs. Individual users may opt for single-user licenses, while businesses requiring broader access may choose multi-user or enterprise licenses for cost-effective access to the report.
13. Are there any additional resources or data provided in the Agriculture Industry in South Africa report?
While the report offers comprehensive insights, it's advisable to review the specific contents or supplementary materials provided to ascertain if additional resources or data are available.
14. How can I stay updated on further developments or reports in the Agriculture Industry in South Africa?
To stay informed about further developments, trends, and reports in the Agriculture Industry in South Africa, consider subscribing to industry newsletters, following relevant companies and organizations, or regularly checking reputable industry news sources and publications.
Methodology
Step 1 - Identification of Relevant Samples Size from Population Database


Step 2 - Approaches for Defining Global Market Size (Value, Volume* & Price*)

Note*: In applicable scenarios
Step 3 - Data Sources
Primary Research
- Web Analytics
- Survey Reports
- Research Institute
- Latest Research Reports
- Opinion Leaders
Secondary Research
- Annual Reports
- White Paper
- Latest Press Release
- Industry Association
- Paid Database
- Investor Presentations

Step 4 - Data Triangulation
Involves using different sources of information in order to increase the validity of a study
These sources are likely to be stakeholders in a program - participants, other researchers, program staff, other community members, and so on.
Then we put all data in single framework & apply various statistical tools to find out the dynamic on the market.
During the analysis stage, feedback from the stakeholder groups would be compared to determine areas of agreement as well as areas of divergence


