
Key Insights
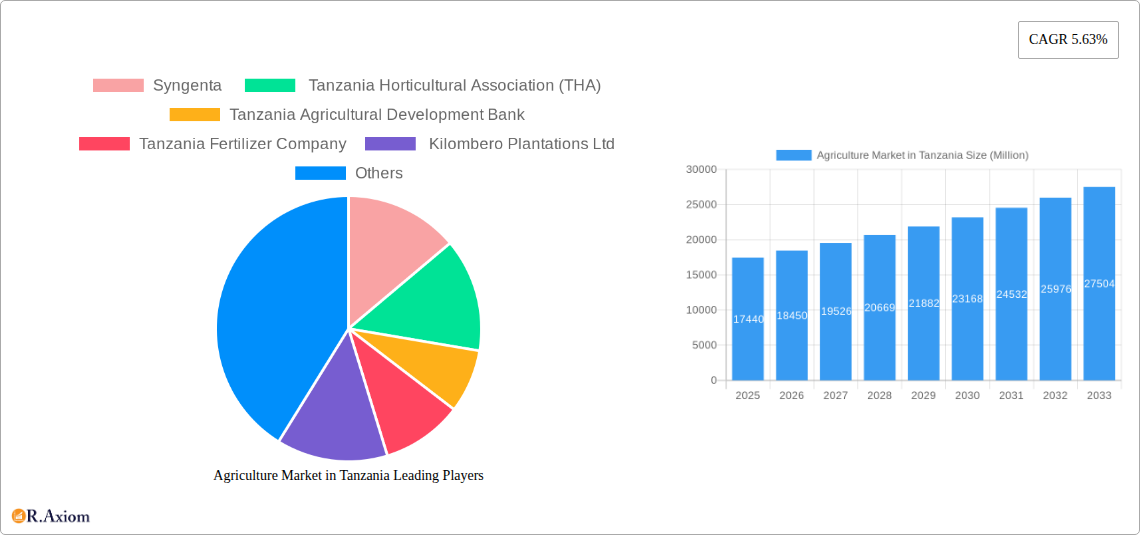
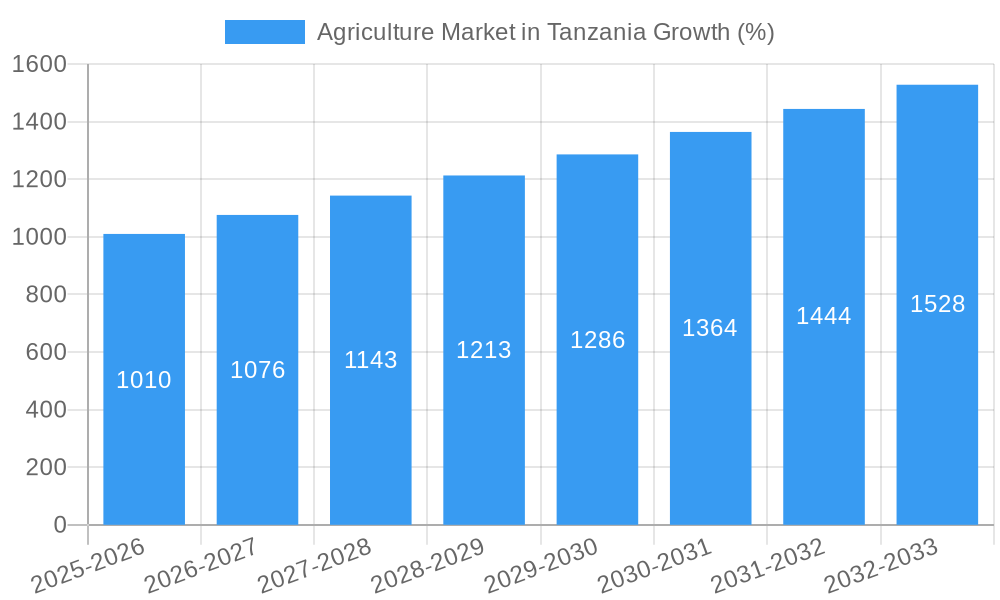
The Tanzanian agriculture market, valued at $17.44 billion in 2025, is projected to experience robust growth, with a compound annual growth rate (CAGR) of 5.63% from 2025 to 2033. This expansion is driven by several factors. Increased government investment in agricultural infrastructure, including irrigation systems and improved storage facilities, is boosting productivity. Growing demand for food crops like cereals, fruits, and vegetables, fueled by a rising population and increasing urbanization, is another significant driver. Furthermore, the adoption of improved farming techniques, including the use of high-yielding seeds and fertilizers, is enhancing crop yields. However, challenges remain. Climate change, characterized by unpredictable rainfall patterns and increased frequency of droughts, poses a significant threat to agricultural output. Limited access to credit and modern technology, especially for smallholder farmers who constitute a large portion of the agricultural workforce, continues to hinder growth. Overcoming these constraints through targeted government policies and private sector investment is crucial for realizing the market's full potential.
Key players in the Tanzanian agricultural landscape include multinational companies like Syngenta and Rijk Zwaan, alongside local entities such as the Tanzania Horticultural Association (THA) and the Tanzania Agricultural Development Bank. These organizations play vital roles in seed production, distribution, financing, and market access. The market segmentation reveals a significant focus on food crops, with cereals holding a substantial share due to their importance in food security. Fruits and vegetables, representing high-value crops with increasing export potential, are also significant segments. Analyzing import and export data across these crop types will provide valuable insights into market dynamics and trade relationships. Continued growth will hinge on strategic initiatives aimed at climate change adaptation, technology dissemination, improved farmer training, and enhanced market linkages.
Agriculture Market in Tanzania: A Comprehensive Report (2019-2033)
This in-depth report provides a comprehensive analysis of the Tanzanian agriculture market, covering market size, segmentation, growth drivers, challenges, and future opportunities. With a focus on the period 2019-2033, including a base year of 2025 and a forecast period of 2025-2033, this report offers invaluable insights for industry stakeholders, investors, and policymakers. The analysis incorporates key data points and trends to provide actionable intelligence for strategic decision-making.
Agriculture Market in Tanzania: Market Concentration & Innovation
The Tanzanian agriculture market exhibits a diverse landscape with varying degrees of concentration across different segments. While large multinational corporations like Syngenta and Monsanto (now Bayer) play significant roles in the supply of inputs, the market is largely characterized by smallholder farmers. Market share data for individual players varies greatly by segment (seeds, fertilizers, etc.) and is currently estimated at xx% for the top 5 players. Innovation is driven by both international companies introducing advanced technologies and local initiatives focused on improving traditional farming practices.
- Regulatory Framework: The Tanzanian government plays a vital role through policies and support programs aimed at boosting agricultural productivity. However, regulatory complexities can sometimes hinder growth and investment.
- Product Substitutes: Traditional farming methods and locally sourced inputs compete with modern technologies and imported products, influencing consumer choices.
- End-User Trends: A growing awareness of sustainable and climate-smart agriculture is driving demand for eco-friendly products and practices. There's also an increasing interest in value-added products and higher-yield crops.
- M&A Activities: The number of significant M&A deals in the Tanzanian agriculture sector remains relatively low, with estimated deal values totaling xx Million in the last five years. However, increased foreign investment and consolidation within certain segments are likely to drive future activity.
Agriculture Market in Tanzania: Industry Trends & Insights
The Tanzanian agriculture market is experiencing dynamic growth, driven by rising population, increasing urbanization, and growing demand for food. The Compound Annual Growth Rate (CAGR) for the overall market is projected to be xx% during the forecast period (2025-2033). Key factors influencing market growth include government initiatives to improve agricultural infrastructure, increasing access to finance, and technological advancements in farming techniques.
Technological disruptions, such as the adoption of precision agriculture and mobile-based technologies, are improving efficiency and productivity. Consumer preferences are shifting towards higher-quality, processed foods, presenting opportunities for value-addition along the agricultural supply chain. The competitive landscape is diverse, with multinational corporations, local companies, and smallholder farmers all vying for market share. Market penetration of improved seed varieties and fertilizers remains relatively low, indicating considerable potential for growth.
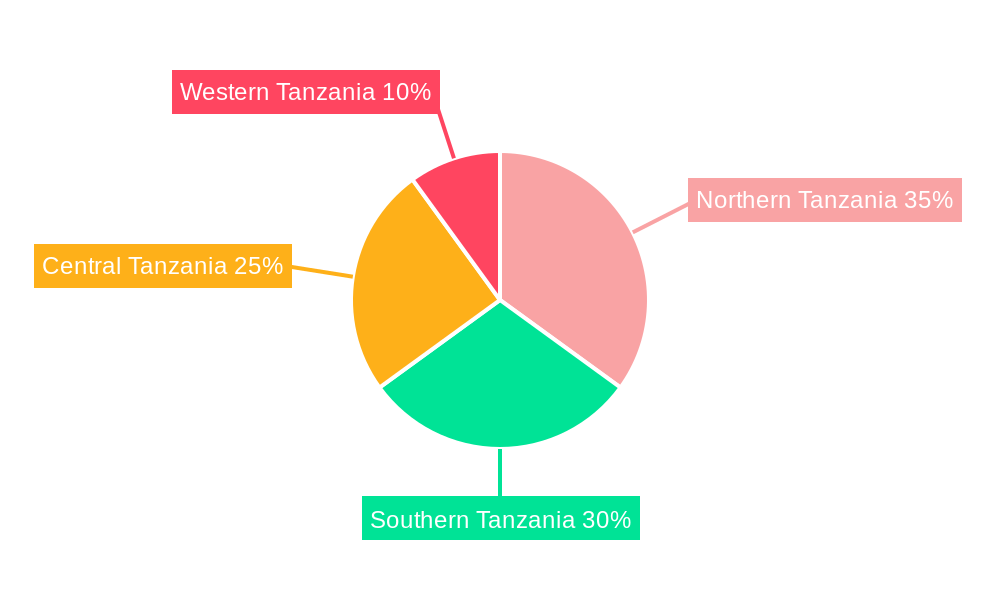
Dominant Markets & Segments in Agriculture Market in Tanzania
- Food Crops/Cereals: This segment dominates the Tanzanian agriculture market by volume, with maize, rice, and wheat being the major crops. Production is heavily reliant on smallholder farmers. Consumption is primarily driven by domestic demand, and the price trend shows considerable seasonality. Export volumes remain relatively low.
- Fruits: The fruits segment showcases strong export potential, particularly for high-value crops like mangoes, bananas, and avocados. Growth is driven by increasing global demand and investments in improved processing facilities. Key regions driving this segment are xx.
- Vegetables: The vegetable sector demonstrates robust growth, fueled by increasing urbanization and rising consumer preference for healthy diets. However, challenges relating to post-harvest losses and efficient distribution networks limit market potential. Key regions driving this segment are xx.
The dominance of each segment is influenced by various factors including:
- Economic Policies: Government subsidies, investment in irrigation, and market access policies significantly impact production levels.
- Infrastructure: Road networks, storage facilities, and processing capabilities affect the efficiency of the agricultural value chain.
- Climate: Tanzania’s climate plays a significant role in the type and yield of crops grown in different regions.
Agriculture Market in Tanzania: Product Developments
Recent product developments are focused on improving crop yields, pest resistance, and disease tolerance through the introduction of high-yielding varieties, improved fertilizers, and precision agriculture techniques. These innovations aim to increase productivity and profitability for farmers, enhance food security, and meet the growing demands of both domestic and international markets. Technological trends such as the use of drones for monitoring crops, and mobile apps for providing agricultural information are gaining traction.
Report Scope & Segmentation Analysis
This report segments the Tanzanian agriculture market by crop type, encompassing food crops/cereals, fruits, and vegetables. Each segment is further analyzed by production, consumption, import, export volumes and values, and price trends. Growth projections vary across segments, with fruits and vegetables expected to experience higher growth rates compared to food crops/cereals due to export potential and rising consumer demand. Competitive dynamics are influenced by the participation of multinational corporations, local companies, and smallholder farmers, generating a complex and dynamic market structure. Market sizes for each segment are detailed in the full report.
Key Drivers of Agriculture Market in Tanzania Growth
Several key factors are driving growth in the Tanzanian agriculture market: rising population leading to increased food demand; government initiatives to improve agricultural infrastructure and access to finance; technological advancements enhancing productivity; and increasing awareness of the importance of sustainable agricultural practices. The African Development Bank's USD 73.5 Million investment to increase food production underscores the commitment to bolstering the agricultural sector.
Challenges in the Agriculture Market in Tanzania Sector
The Tanzanian agriculture sector faces several challenges, including limited access to credit and finance for smallholder farmers, inadequate agricultural infrastructure such as irrigation and storage facilities, climate change impacts, post-harvest losses, and limited access to improved technologies and information. These factors constrain productivity and limit market participation, hindering overall sector growth.
Emerging Opportunities in Agriculture Market in Tanzania
Emerging opportunities include the growth of value-added agricultural products, the expansion of export markets for high-value crops, the adoption of climate-smart agriculture practices, and the increasing use of technology to enhance farming efficiency. Investments in processing and packaging facilities will be key to capitalizing on these opportunities.
Leading Players in the Agriculture Market in Tanzania Market
- Syngenta
- Tanzania Horticultural Association (THA)
- Tanzania Agricultural Development Bank
- Tanzania Fertilizer Company
- Kilombero Plantations Ltd
- Rijk Zwaan
- Monsanto
- Tanzania Breweries Limited
- Kilimanjaro Agro Inputs Ltd
- Tanzania Seed Trade Association (TASTA)
Key Developments in Agriculture Market in Tanzania Industry
- September 2022: Tanzania's Ministry of Agriculture directed TARI to find a location for genetically engineered (GE) crop trials, potentially overturning a 2021 ban. This development signifies a potential shift towards embracing biotechnology to enhance crop production.
- July 2022: The African Development Bank Group approved USD 73.5 Million to increase food production by a million tonnes over three years. This substantial investment highlights the commitment to boosting agricultural productivity and food security.
- February 2022: AgriFI and ElectrFI hosted a signing ceremony and launch event, signifying increased collaboration to enhance agricultural financing and electrification. This demonstrates a concerted effort to address critical infrastructural challenges within the sector.
Strategic Outlook for Agriculture Market in Tanzania Market
The Tanzanian agriculture market presents significant opportunities for growth and investment over the next decade. Continued government support, technological advancements, and private sector engagement are vital to unlock the sector's full potential. Focusing on improving efficiency, value addition, and sustainable practices will drive future success, contributing to both economic growth and food security.
Agriculture Market in Tanzania Segmentation
-
1. Crop Typ
- 1.1. Food Crops/Cereals
- 1.2. Fruits
- 1.3. Vegetables
-
2. Crop Typ
- 2.1. Food Crops/Cereals
- 2.2. Fruits
- 2.3. Vegetables
Agriculture Market in Tanzania Segmentation By Geography
-
1. North America
- 1.1. United States
- 1.2. Canada
- 1.3. Mexico
-
2. South America
- 2.1. Brazil
- 2.2. Argentina
- 2.3. Rest of South America
-
3. Europe
- 3.1. United Kingdom
- 3.2. Germany
- 3.3. France
- 3.4. Italy
- 3.5. Spain
- 3.6. Russia
- 3.7. Benelux
- 3.8. Nordics
- 3.9. Rest of Europe
-
4. Middle East & Africa
- 4.1. Turkey
- 4.2. Israel
- 4.3. GCC
- 4.4. North Africa
- 4.5. South Africa
- 4.6. Rest of Middle East & Africa
-
5. Asia Pacific
- 5.1. China
- 5.2. India
- 5.3. Japan
- 5.4. South Korea
- 5.5. ASEAN
- 5.6. Oceania
- 5.7. Rest of Asia Pacific
Agriculture Market in Tanzania REPORT HIGHLIGHTS
| Aspects | Details |
|---|---|
| Study Period | 2019-2033 |
| Base Year | 2024 |
| Estimated Year | 2025 |
| Forecast Period | 2025-2033 |
| Historical Period | 2019-2024 |
| Growth Rate | CAGR of 5.63% from 2019-2033 |
| Segmentation |
|
Table of Contents
- 1. Introduction
- 1.1. Research Scope
- 1.2. Market Segmentation
- 1.3. Research Methodology
- 1.4. Definitions and Assumptions
- 2. Executive Summary
- 2.1. Introduction
- 3. Market Dynamics
- 3.1. Introduction
- 3.2. Market Drivers
- 3.2.1. Increasing Adoption of Technology in Horticulture; Government Initiatives for Self-reliance in Vegetable and Fruit Farming
- 3.3. Market Restrains
- 3.3.1. Limited Resource Availability and Unfavourable Climatic Condition; Increasing Reliance on Imports for Domestic Supply
- 3.4. Market Trends
- 3.4.1. Favorable Government Policies Supporting the Market Growth
- 4. Market Factor Analysis
- 4.1. Porters Five Forces
- 4.2. Supply/Value Chain
- 4.3. PESTEL analysis
- 4.4. Market Entropy
- 4.5. Patent/Trademark Analysis
- 5. Global Agriculture Market in Tanzania Analysis, Insights and Forecast, 2019-2031
- 5.1. Market Analysis, Insights and Forecast - by Crop Typ
- 5.1.1. Food Crops/Cereals
- 5.1.2. Fruits
- 5.1.3. Vegetables
- 5.2. Market Analysis, Insights and Forecast - by Crop Typ
- 5.2.1. Food Crops/Cereals
- 5.2.2. Fruits
- 5.2.3. Vegetables
- 5.3. Market Analysis, Insights and Forecast - by Region
- 5.3.1. North America
- 5.3.2. South America
- 5.3.3. Europe
- 5.3.4. Middle East & Africa
- 5.3.5. Asia Pacific
- 5.1. Market Analysis, Insights and Forecast - by Crop Typ
- 6. North America Agriculture Market in Tanzania Analysis, Insights and Forecast, 2019-2031
- 6.1. Market Analysis, Insights and Forecast - by Crop Typ
- 6.1.1. Food Crops/Cereals
- 6.1.2. Fruits
- 6.1.3. Vegetables
- 6.2. Market Analysis, Insights and Forecast - by Crop Typ
- 6.2.1. Food Crops/Cereals
- 6.2.2. Fruits
- 6.2.3. Vegetables
- 6.1. Market Analysis, Insights and Forecast - by Crop Typ
- 7. South America Agriculture Market in Tanzania Analysis, Insights and Forecast, 2019-2031
- 7.1. Market Analysis, Insights and Forecast - by Crop Typ
- 7.1.1. Food Crops/Cereals
- 7.1.2. Fruits
- 7.1.3. Vegetables
- 7.2. Market Analysis, Insights and Forecast - by Crop Typ
- 7.2.1. Food Crops/Cereals
- 7.2.2. Fruits
- 7.2.3. Vegetables
- 7.1. Market Analysis, Insights and Forecast - by Crop Typ
- 8. Europe Agriculture Market in Tanzania Analysis, Insights and Forecast, 2019-2031
- 8.1. Market Analysis, Insights and Forecast - by Crop Typ
- 8.1.1. Food Crops/Cereals
- 8.1.2. Fruits
- 8.1.3. Vegetables
- 8.2. Market Analysis, Insights and Forecast - by Crop Typ
- 8.2.1. Food Crops/Cereals
- 8.2.2. Fruits
- 8.2.3. Vegetables
- 8.1. Market Analysis, Insights and Forecast - by Crop Typ
- 9. Middle East & Africa Agriculture Market in Tanzania Analysis, Insights and Forecast, 2019-2031
- 9.1. Market Analysis, Insights and Forecast - by Crop Typ
- 9.1.1. Food Crops/Cereals
- 9.1.2. Fruits
- 9.1.3. Vegetables
- 9.2. Market Analysis, Insights and Forecast - by Crop Typ
- 9.2.1. Food Crops/Cereals
- 9.2.2. Fruits
- 9.2.3. Vegetables
- 9.1. Market Analysis, Insights and Forecast - by Crop Typ
- 10. Asia Pacific Agriculture Market in Tanzania Analysis, Insights and Forecast, 2019-2031
- 10.1. Market Analysis, Insights and Forecast - by Crop Typ
- 10.1.1. Food Crops/Cereals
- 10.1.2. Fruits
- 10.1.3. Vegetables
- 10.2. Market Analysis, Insights and Forecast - by Crop Typ
- 10.2.1. Food Crops/Cereals
- 10.2.2. Fruits
- 10.2.3. Vegetables
- 10.1. Market Analysis, Insights and Forecast - by Crop Typ
- 11. Competitive Analysis
- 11.1. Global Market Share Analysis 2024
- 11.2. Company Profiles
- 11.2.1 Syngenta
- 11.2.1.1. Overview
- 11.2.1.2. Products
- 11.2.1.3. SWOT Analysis
- 11.2.1.4. Recent Developments
- 11.2.1.5. Financials (Based on Availability)
- 11.2.2 Tanzania Horticultural Association (THA)
- 11.2.2.1. Overview
- 11.2.2.2. Products
- 11.2.2.3. SWOT Analysis
- 11.2.2.4. Recent Developments
- 11.2.2.5. Financials (Based on Availability)
- 11.2.3 Tanzania Agricultural Development Bank
- 11.2.3.1. Overview
- 11.2.3.2. Products
- 11.2.3.3. SWOT Analysis
- 11.2.3.4. Recent Developments
- 11.2.3.5. Financials (Based on Availability)
- 11.2.4 Tanzania Fertilizer Company
- 11.2.4.1. Overview
- 11.2.4.2. Products
- 11.2.4.3. SWOT Analysis
- 11.2.4.4. Recent Developments
- 11.2.4.5. Financials (Based on Availability)
- 11.2.5 Kilombero Plantations Ltd
- 11.2.5.1. Overview
- 11.2.5.2. Products
- 11.2.5.3. SWOT Analysis
- 11.2.5.4. Recent Developments
- 11.2.5.5. Financials (Based on Availability)
- 11.2.6 Rijk Zwaan
- 11.2.6.1. Overview
- 11.2.6.2. Products
- 11.2.6.3. SWOT Analysis
- 11.2.6.4. Recent Developments
- 11.2.6.5. Financials (Based on Availability)
- 11.2.7 Monsanto
- 11.2.7.1. Overview
- 11.2.7.2. Products
- 11.2.7.3. SWOT Analysis
- 11.2.7.4. Recent Developments
- 11.2.7.5. Financials (Based on Availability)
- 11.2.8 Tanzania Breweries Limited
- 11.2.8.1. Overview
- 11.2.8.2. Products
- 11.2.8.3. SWOT Analysis
- 11.2.8.4. Recent Developments
- 11.2.8.5. Financials (Based on Availability)
- 11.2.9 Kilimanjaro Agro Inputs Ltd
- 11.2.9.1. Overview
- 11.2.9.2. Products
- 11.2.9.3. SWOT Analysis
- 11.2.9.4. Recent Developments
- 11.2.9.5. Financials (Based on Availability)
- 11.2.10 Tanzania Seed Trade Association (TASTA)
- 11.2.10.1. Overview
- 11.2.10.2. Products
- 11.2.10.3. SWOT Analysis
- 11.2.10.4. Recent Developments
- 11.2.10.5. Financials (Based on Availability)
- 11.2.1 Syngenta
List of Figures
- Figure 1: Global Agriculture Market in Tanzania Revenue Breakdown (Million, %) by Region 2024 & 2032
- Figure 2: Tanzania Agriculture Market in Tanzania Revenue (Million), by Country 2024 & 2032
- Figure 3: Tanzania Agriculture Market in Tanzania Revenue Share (%), by Country 2024 & 2032
- Figure 4: North America Agriculture Market in Tanzania Revenue (Million), by Crop Typ 2024 & 2032
- Figure 5: North America Agriculture Market in Tanzania Revenue Share (%), by Crop Typ 2024 & 2032
- Figure 6: North America Agriculture Market in Tanzania Revenue (Million), by Crop Typ 2024 & 2032
- Figure 7: North America Agriculture Market in Tanzania Revenue Share (%), by Crop Typ 2024 & 2032
- Figure 8: North America Agriculture Market in Tanzania Revenue (Million), by Country 2024 & 2032
- Figure 9: North America Agriculture Market in Tanzania Revenue Share (%), by Country 2024 & 2032
- Figure 10: South America Agriculture Market in Tanzania Revenue (Million), by Crop Typ 2024 & 2032
- Figure 11: South America Agriculture Market in Tanzania Revenue Share (%), by Crop Typ 2024 & 2032
- Figure 12: South America Agriculture Market in Tanzania Revenue (Million), by Crop Typ 2024 & 2032
- Figure 13: South America Agriculture Market in Tanzania Revenue Share (%), by Crop Typ 2024 & 2032
- Figure 14: South America Agriculture Market in Tanzania Revenue (Million), by Country 2024 & 2032
- Figure 15: South America Agriculture Market in Tanzania Revenue Share (%), by Country 2024 & 2032
- Figure 16: Europe Agriculture Market in Tanzania Revenue (Million), by Crop Typ 2024 & 2032
- Figure 17: Europe Agriculture Market in Tanzania Revenue Share (%), by Crop Typ 2024 & 2032
- Figure 18: Europe Agriculture Market in Tanzania Revenue (Million), by Crop Typ 2024 & 2032
- Figure 19: Europe Agriculture Market in Tanzania Revenue Share (%), by Crop Typ 2024 & 2032
- Figure 20: Europe Agriculture Market in Tanzania Revenue (Million), by Country 2024 & 2032
- Figure 21: Europe Agriculture Market in Tanzania Revenue Share (%), by Country 2024 & 2032
- Figure 22: Middle East & Africa Agriculture Market in Tanzania Revenue (Million), by Crop Typ 2024 & 2032
- Figure 23: Middle East & Africa Agriculture Market in Tanzania Revenue Share (%), by Crop Typ 2024 & 2032
- Figure 24: Middle East & Africa Agriculture Market in Tanzania Revenue (Million), by Crop Typ 2024 & 2032
- Figure 25: Middle East & Africa Agriculture Market in Tanzania Revenue Share (%), by Crop Typ 2024 & 2032
- Figure 26: Middle East & Africa Agriculture Market in Tanzania Revenue (Million), by Country 2024 & 2032
- Figure 27: Middle East & Africa Agriculture Market in Tanzania Revenue Share (%), by Country 2024 & 2032
- Figure 28: Asia Pacific Agriculture Market in Tanzania Revenue (Million), by Crop Typ 2024 & 2032
- Figure 29: Asia Pacific Agriculture Market in Tanzania Revenue Share (%), by Crop Typ 2024 & 2032
- Figure 30: Asia Pacific Agriculture Market in Tanzania Revenue (Million), by Crop Typ 2024 & 2032
- Figure 31: Asia Pacific Agriculture Market in Tanzania Revenue Share (%), by Crop Typ 2024 & 2032
- Figure 32: Asia Pacific Agriculture Market in Tanzania Revenue (Million), by Country 2024 & 2032
- Figure 33: Asia Pacific Agriculture Market in Tanzania Revenue Share (%), by Country 2024 & 2032
List of Tables
- Table 1: Global Agriculture Market in Tanzania Revenue Million Forecast, by Region 2019 & 2032
- Table 2: Global Agriculture Market in Tanzania Revenue Million Forecast, by Crop Typ 2019 & 2032
- Table 3: Global Agriculture Market in Tanzania Revenue Million Forecast, by Crop Typ 2019 & 2032
- Table 4: Global Agriculture Market in Tanzania Revenue Million Forecast, by Region 2019 & 2032
- Table 5: Global Agriculture Market in Tanzania Revenue Million Forecast, by Country 2019 & 2032
- Table 6: Global Agriculture Market in Tanzania Revenue Million Forecast, by Crop Typ 2019 & 2032
- Table 7: Global Agriculture Market in Tanzania Revenue Million Forecast, by Crop Typ 2019 & 2032
- Table 8: Global Agriculture Market in Tanzania Revenue Million Forecast, by Country 2019 & 2032
- Table 9: United States Agriculture Market in Tanzania Revenue (Million) Forecast, by Application 2019 & 2032
- Table 10: Canada Agriculture Market in Tanzania Revenue (Million) Forecast, by Application 2019 & 2032
- Table 11: Mexico Agriculture Market in Tanzania Revenue (Million) Forecast, by Application 2019 & 2032
- Table 12: Global Agriculture Market in Tanzania Revenue Million Forecast, by Crop Typ 2019 & 2032
- Table 13: Global Agriculture Market in Tanzania Revenue Million Forecast, by Crop Typ 2019 & 2032
- Table 14: Global Agriculture Market in Tanzania Revenue Million Forecast, by Country 2019 & 2032
- Table 15: Brazil Agriculture Market in Tanzania Revenue (Million) Forecast, by Application 2019 & 2032
- Table 16: Argentina Agriculture Market in Tanzania Revenue (Million) Forecast, by Application 2019 & 2032
- Table 17: Rest of South America Agriculture Market in Tanzania Revenue (Million) Forecast, by Application 2019 & 2032
- Table 18: Global Agriculture Market in Tanzania Revenue Million Forecast, by Crop Typ 2019 & 2032
- Table 19: Global Agriculture Market in Tanzania Revenue Million Forecast, by Crop Typ 2019 & 2032
- Table 20: Global Agriculture Market in Tanzania Revenue Million Forecast, by Country 2019 & 2032
- Table 21: United Kingdom Agriculture Market in Tanzania Revenue (Million) Forecast, by Application 2019 & 2032
- Table 22: Germany Agriculture Market in Tanzania Revenue (Million) Forecast, by Application 2019 & 2032
- Table 23: France Agriculture Market in Tanzania Revenue (Million) Forecast, by Application 2019 & 2032
- Table 24: Italy Agriculture Market in Tanzania Revenue (Million) Forecast, by Application 2019 & 2032
- Table 25: Spain Agriculture Market in Tanzania Revenue (Million) Forecast, by Application 2019 & 2032
- Table 26: Russia Agriculture Market in Tanzania Revenue (Million) Forecast, by Application 2019 & 2032
- Table 27: Benelux Agriculture Market in Tanzania Revenue (Million) Forecast, by Application 2019 & 2032
- Table 28: Nordics Agriculture Market in Tanzania Revenue (Million) Forecast, by Application 2019 & 2032
- Table 29: Rest of Europe Agriculture Market in Tanzania Revenue (Million) Forecast, by Application 2019 & 2032
- Table 30: Global Agriculture Market in Tanzania Revenue Million Forecast, by Crop Typ 2019 & 2032
- Table 31: Global Agriculture Market in Tanzania Revenue Million Forecast, by Crop Typ 2019 & 2032
- Table 32: Global Agriculture Market in Tanzania Revenue Million Forecast, by Country 2019 & 2032
- Table 33: Turkey Agriculture Market in Tanzania Revenue (Million) Forecast, by Application 2019 & 2032
- Table 34: Israel Agriculture Market in Tanzania Revenue (Million) Forecast, by Application 2019 & 2032
- Table 35: GCC Agriculture Market in Tanzania Revenue (Million) Forecast, by Application 2019 & 2032
- Table 36: North Africa Agriculture Market in Tanzania Revenue (Million) Forecast, by Application 2019 & 2032
- Table 37: South Africa Agriculture Market in Tanzania Revenue (Million) Forecast, by Application 2019 & 2032
- Table 38: Rest of Middle East & Africa Agriculture Market in Tanzania Revenue (Million) Forecast, by Application 2019 & 2032
- Table 39: Global Agriculture Market in Tanzania Revenue Million Forecast, by Crop Typ 2019 & 2032
- Table 40: Global Agriculture Market in Tanzania Revenue Million Forecast, by Crop Typ 2019 & 2032
- Table 41: Global Agriculture Market in Tanzania Revenue Million Forecast, by Country 2019 & 2032
- Table 42: China Agriculture Market in Tanzania Revenue (Million) Forecast, by Application 2019 & 2032
- Table 43: India Agriculture Market in Tanzania Revenue (Million) Forecast, by Application 2019 & 2032
- Table 44: Japan Agriculture Market in Tanzania Revenue (Million) Forecast, by Application 2019 & 2032
- Table 45: South Korea Agriculture Market in Tanzania Revenue (Million) Forecast, by Application 2019 & 2032
- Table 46: ASEAN Agriculture Market in Tanzania Revenue (Million) Forecast, by Application 2019 & 2032
- Table 47: Oceania Agriculture Market in Tanzania Revenue (Million) Forecast, by Application 2019 & 2032
- Table 48: Rest of Asia Pacific Agriculture Market in Tanzania Revenue (Million) Forecast, by Application 2019 & 2032
Frequently Asked Questions
1. What is the projected Compound Annual Growth Rate (CAGR) of the Agriculture Market in Tanzania?
The projected CAGR is approximately 5.63%.
2. Which companies are prominent players in the Agriculture Market in Tanzania?
Key companies in the market include Syngenta , Tanzania Horticultural Association (THA) , Tanzania Agricultural Development Bank , Tanzania Fertilizer Company , Kilombero Plantations Ltd , Rijk Zwaan , Monsanto , Tanzania Breweries Limited , Kilimanjaro Agro Inputs Ltd , Tanzania Seed Trade Association (TASTA).
3. What are the main segments of the Agriculture Market in Tanzania?
The market segments include Crop Typ, Crop Typ.
4. Can you provide details about the market size?
The market size is estimated to be USD 17.44 Million as of 2022.
5. What are some drivers contributing to market growth?
Increasing Adoption of Technology in Horticulture; Government Initiatives for Self-reliance in Vegetable and Fruit Farming.
6. What are the notable trends driving market growth?
Favorable Government Policies Supporting the Market Growth.
7. Are there any restraints impacting market growth?
Limited Resource Availability and Unfavourable Climatic Condition; Increasing Reliance on Imports for Domestic Supply.
8. Can you provide examples of recent developments in the market?
September 2022: Tanzania's Ministry of Agriculture directed the Tanzania Agriculture Research Institute (TARI) to find a location for genetically engineered (GE) crop trials. This decision appeared to overturn the Tanzanian government's (GoT) 2021 ban on all GE crop research trials.
9. What pricing options are available for accessing the report?
Pricing options include single-user, multi-user, and enterprise licenses priced at USD 3800, USD 4500, and USD 5800 respectively.
10. Is the market size provided in terms of value or volume?
The market size is provided in terms of value, measured in Million.
11. Are there any specific market keywords associated with the report?
Yes, the market keyword associated with the report is "Agriculture Market in Tanzania," which aids in identifying and referencing the specific market segment covered.
12. How do I determine which pricing option suits my needs best?
The pricing options vary based on user requirements and access needs. Individual users may opt for single-user licenses, while businesses requiring broader access may choose multi-user or enterprise licenses for cost-effective access to the report.
13. Are there any additional resources or data provided in the Agriculture Market in Tanzania report?
While the report offers comprehensive insights, it's advisable to review the specific contents or supplementary materials provided to ascertain if additional resources or data are available.
14. How can I stay updated on further developments or reports in the Agriculture Market in Tanzania?
To stay informed about further developments, trends, and reports in the Agriculture Market in Tanzania, consider subscribing to industry newsletters, following relevant companies and organizations, or regularly checking reputable industry news sources and publications.
Methodology
Step 1 - Identification of Relevant Samples Size from Population Database


Step 2 - Approaches for Defining Global Market Size (Value, Volume* & Price*)

Note*: In applicable scenarios
Step 3 - Data Sources
Primary Research
- Web Analytics
- Survey Reports
- Research Institute
- Latest Research Reports
- Opinion Leaders
Secondary Research
- Annual Reports
- White Paper
- Latest Press Release
- Industry Association
- Paid Database
- Investor Presentations

Step 4 - Data Triangulation
Involves using different sources of information in order to increase the validity of a study
These sources are likely to be stakeholders in a program - participants, other researchers, program staff, other community members, and so on.
Then we put all data in single framework & apply various statistical tools to find out the dynamic on the market.
During the analysis stage, feedback from the stakeholder groups would be compared to determine areas of agreement as well as areas of divergence


