Key Insights
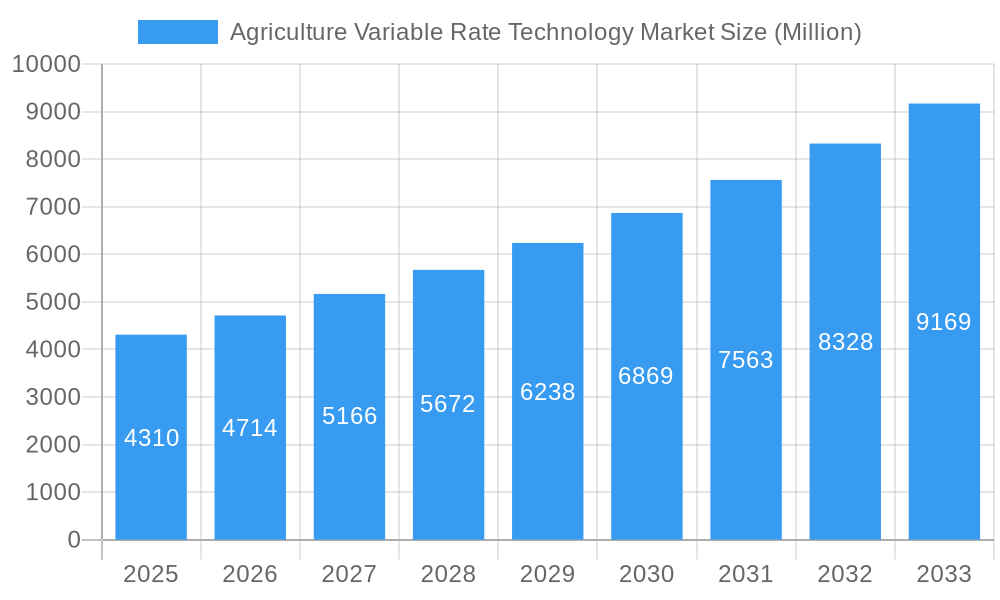
The Agriculture Variable Rate Technology (VRT) market is experiencing robust growth, projected to reach \$4.31 billion in 2025 and exhibiting a Compound Annual Growth Rate (CAGR) of 9.40% from 2025 to 2033. This expansion is driven by several key factors. Firstly, the increasing need for precision agriculture and optimized resource utilization is compelling farmers to adopt VRT solutions. These technologies enable targeted application of inputs like fertilizers and pesticides, reducing waste and environmental impact while boosting yields and profitability. Secondly, advancements in sensor technology, GPS, and data analytics are continuously enhancing the accuracy and efficiency of VRT systems. The integration of IoT and AI further improves data analysis and decision-making, leading to better farm management practices. Finally, supportive government policies and initiatives promoting sustainable agriculture are fueling the adoption of VRT across various regions. The market is segmented by crop type (cereals & grains, fruits & vegetables, oilseeds & pulses, commercial crops) and application (fertilizers, crop protection chemicals, soil sensing, yield monitoring, irrigation, others), reflecting the versatility of VRT across diverse agricultural operations. Major players like Deere & Company, Trimble Inc., and AGCO Corporation are driving innovation and market penetration through strategic partnerships, technological advancements, and geographic expansions.
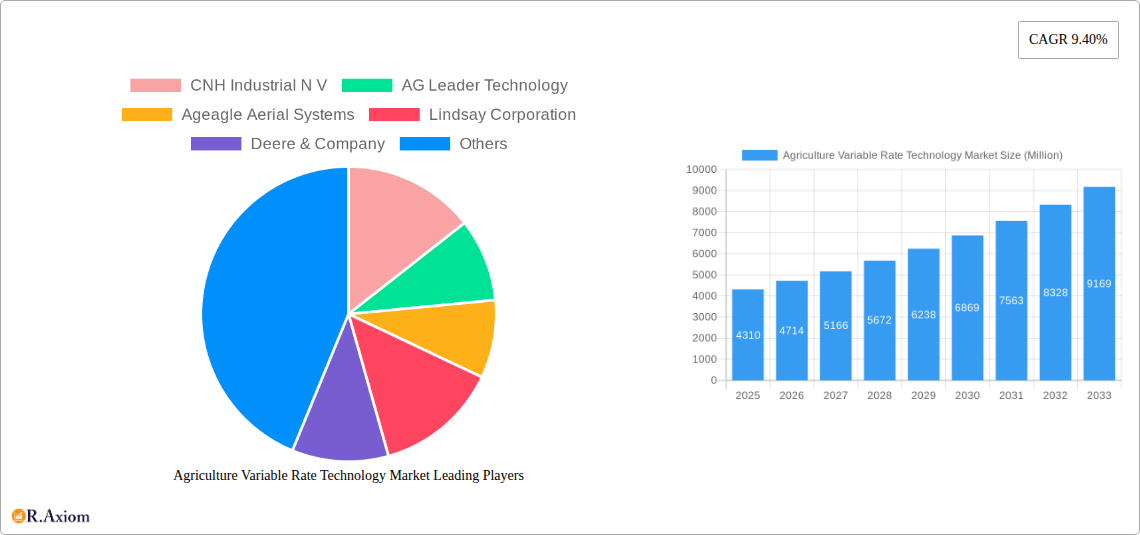
Agriculture Variable Rate Technology Market Market Size (In Billion)
The North American market currently holds a significant share, driven by early adoption and advanced technological infrastructure. However, the Asia-Pacific region is expected to witness the fastest growth in the coming years, fueled by increasing agricultural activities and rising awareness of precision farming techniques in countries like India and China. While high initial investment costs and a lack of technological expertise in some regions pose challenges, the long-term benefits of VRT in terms of improved yields, reduced input costs, and enhanced sustainability are overcoming these barriers. The market is also seeing an increasing adoption of cloud-based platforms and data analytics services, further strengthening its growth trajectory. Competition is intense amongst established players and emerging technology providers, resulting in continuous innovation and an evolving landscape of VRT solutions.
Agriculture Variable Rate Technology Market Company Market Share
Agriculture Variable Rate Technology Market: A Comprehensive Market Report (2019-2033)
This comprehensive report provides a detailed analysis of the Agriculture Variable Rate Technology market, offering invaluable insights for stakeholders across the agricultural technology landscape. The study period spans from 2019 to 2033, with 2025 serving as the base and estimated year. The forecast period covers 2025-2033, and the historical period encompasses 2019-2024. The report analyzes market trends, segmentation, leading players, and future growth potential, providing actionable intelligence for strategic decision-making. The global market size in 2025 is estimated at xx Million, and is projected to reach xx Million by 2033, exhibiting a CAGR of xx% during the forecast period.
Agriculture Variable Rate Technology Market Market Concentration & Innovation
The Agriculture Variable Rate Technology market exhibits a moderately concentrated landscape, with a few dominant players holding significant market share. CNH Industrial N V, Deere & Company, and Trimble Inc. are among the key players, collectively accounting for an estimated xx% of the global market share in 2025. However, the market is witnessing increased competition from smaller, specialized firms focusing on niche applications and technologies. Innovation is a crucial driver, fueled by advancements in sensor technology, data analytics, and automation. The market is witnessing significant investment in AI-powered precision agriculture solutions, leading to enhanced efficiency and yield optimization. Regulatory frameworks, including government subsidies and environmental regulations, play a crucial role in shaping market dynamics. Product substitutes, such as traditional farming methods, pose a limited threat due to the increasing demand for sustainable and efficient agricultural practices. End-user trends indicate a strong preference for data-driven decision-making and integrated precision agriculture solutions. Furthermore, M&A activities are prevalent, with deal values exceeding xx Million in recent years, demonstrating the consolidation and growth within the sector. For example, the acquisition of [Company A] by [Company B] in [Year] significantly expanded [Company B]'s market reach and technological capabilities.
Agriculture Variable Rate Technology Market Industry Trends & Insights
The Agriculture Variable Rate Technology market is experiencing robust growth, driven by factors such as increasing food demand, rising awareness of sustainable agriculture, and advancements in technology. The market is witnessing a surge in the adoption of variable rate technology across various crops and applications, leading to improved resource utilization and yield enhancement. Technological disruptions, such as the integration of IoT devices, cloud computing, and AI, are transforming agricultural practices and driving market innovation. Consumer preferences are increasingly shifting towards sustainably produced food, which fuels the demand for precision agriculture solutions that minimize environmental impact. The competitive dynamics are characterized by intense competition among established players and emerging startups, with a focus on product differentiation, technological advancements, and strategic partnerships. The market penetration rate for variable rate technology is estimated at xx% in 2025, and is expected to reach xx% by 2033, indicating significant growth potential.
Dominant Markets & Segments in Agriculture Variable Rate Technology Market
The North American region currently dominates the Agriculture Variable Rate Technology market, driven by factors such as high adoption rates, technological advancements, and supportive government policies. Within crop types, Cereals & Grains segment holds the largest market share, followed by Oilseeds & Pulses. In terms of applications, Fertilizer application accounts for the largest market share, reflecting the significant role of nutrient management in optimizing crop yields.
Key Drivers for North American Dominance:
- Strong government support for precision agriculture initiatives.
- High adoption rates of advanced technologies among large-scale farms.
- Well-developed agricultural infrastructure.
- Availability of skilled workforce.
Dominant Segments:
- Crop Type: Cereals & Grains (High acreage and demand for yield optimization).
- Application: Fertilizers (High volume and crucial role in yield enhancement).
The European and Asian markets are also showing significant growth potential, driven by increasing investments in agricultural modernization and the growing demand for food security.
Agriculture Variable Rate Technology Market Product Developments
Recent product innovations focus on integrating advanced sensors, AI-powered analytics, and automation capabilities into variable rate technology solutions. This allows for real-time monitoring, data-driven decision-making, and automated application of inputs, leading to improved efficiency, reduced waste, and enhanced yield. These advancements cater to the growing need for sustainable and efficient agriculture, providing a competitive advantage to companies offering these innovative solutions.
Report Scope & Segmentation Analysis
This report segments the Agriculture Variable Rate Technology market based on crop type (Cereals & Grains, Fruits & Vegetables, Oilseeds & Pulses, Commercial Crops) and application (Fertilizers, Crop Protection Chemicals, Soil Sensing, Yield Monitoring, Irrigation, Others). Each segment's market size, growth projections, and competitive landscape are analyzed in detail. For instance, the Cereals & Grains segment is expected to witness significant growth due to high acreage and demand for yield optimization. Similarly, the Fertilizer application segment is expected to maintain its dominance due to the crucial role of nutrient management.
Key Drivers of Agriculture Variable Rate Technology Market Growth
The growth of the Agriculture Variable Rate Technology market is primarily driven by increasing food demand globally, coupled with the need for sustainable and efficient agricultural practices. Technological advancements, such as the integration of AI and IoT devices, are transforming farm operations, improving resource utilization, and enhancing crop yields. Government initiatives promoting precision agriculture through subsidies and regulatory frameworks further accelerate market growth. The rising adoption of precision agriculture practices by farmers worldwide is also contributing to the expanding market.
Challenges in the Agriculture Variable Rate Technology Market Sector
Despite the significant growth potential, the Agriculture Variable Rate Technology market faces challenges such as high initial investment costs for technology adoption, a lack of digital literacy among farmers, particularly in developing countries, and complex regulatory landscapes in some regions. Furthermore, the dependence on reliable internet connectivity and data infrastructure remains a constraint, along with potential cybersecurity risks associated with the increasing use of connected devices.
Emerging Opportunities in Agriculture Variable Rate Technology Market
The Agriculture Variable Rate Technology market presents significant opportunities in developing countries with large agricultural sectors yet to fully embrace precision agriculture. The integration of blockchain technology for traceability and transparency in agricultural supply chains is an emerging trend, creating opportunities for new solutions. Furthermore, the growing demand for data-driven insights and predictive analytics opens avenues for advanced data processing and AI-powered solutions.
Leading Players in the Agriculture Variable Rate Technology Market Market
- CNH Industrial N V
- AG Leader Technology
- Ageagle Aerial Systems
- Lindsay Corporation
- Deere & Company
- Trimble Inc
- Topcon Corporation
- Valmont Industries Inc
- Raven Industries Inc
- AGCO Corporation
Key Developments in Agriculture Variable Rate Technology Market Industry
- Jan 2023: Deere & Company launched a new precision agriculture platform integrating AI-powered analytics.
- Mar 2022: Trimble Inc. announced a strategic partnership with a leading sensor technology provider.
- Oct 2021: CNH Industrial N V acquired a startup specializing in robotic harvesting technologies.
- [Add more developments with year/month and brief description of impact]
Strategic Outlook for Agriculture Variable Rate Technology Market Market
The Agriculture Variable Rate Technology market is poised for continued growth, driven by technological advancements, increasing food security concerns, and the growing adoption of sustainable agricultural practices. The integration of AI, IoT, and big data analytics will further transform the sector, opening new opportunities for innovation and market expansion. Companies focusing on developing user-friendly, cost-effective, and data-driven solutions are expected to thrive in this rapidly evolving market.
Agriculture Variable Rate Technology Market Segmentation
-
1. Crop Type
- 1.1. Cereals & Grains
- 1.2. Fruits and Vegetables
- 1.3. Oilseeds & Pulses
- 1.4. Commercial Crops
-
2. Application
- 2.1. Fertilizers
- 2.2. Crop Protection Chemicals
- 2.3. Soil Sensing
- 2.4. Yield Monitoring
- 2.5. Irrigation
- 2.6. Others
Agriculture Variable Rate Technology Market Segmentation By Geography
-
1. North America
- 1.1. United States
- 1.2. Canada
- 1.3. Mexico
-
2. South America
- 2.1. Brazil
- 2.2. Argentina
- 2.3. Rest of South America
-
3. Europe
- 3.1. United Kingdom
- 3.2. Germany
- 3.3. France
- 3.4. Italy
- 3.5. Spain
- 3.6. Russia
- 3.7. Benelux
- 3.8. Nordics
- 3.9. Rest of Europe
-
4. Middle East & Africa
- 4.1. Turkey
- 4.2. Israel
- 4.3. GCC
- 4.4. North Africa
- 4.5. South Africa
- 4.6. Rest of Middle East & Africa
-
5. Asia Pacific
- 5.1. China
- 5.2. India
- 5.3. Japan
- 5.4. South Korea
- 5.5. ASEAN
- 5.6. Oceania
- 5.7. Rest of Asia Pacific
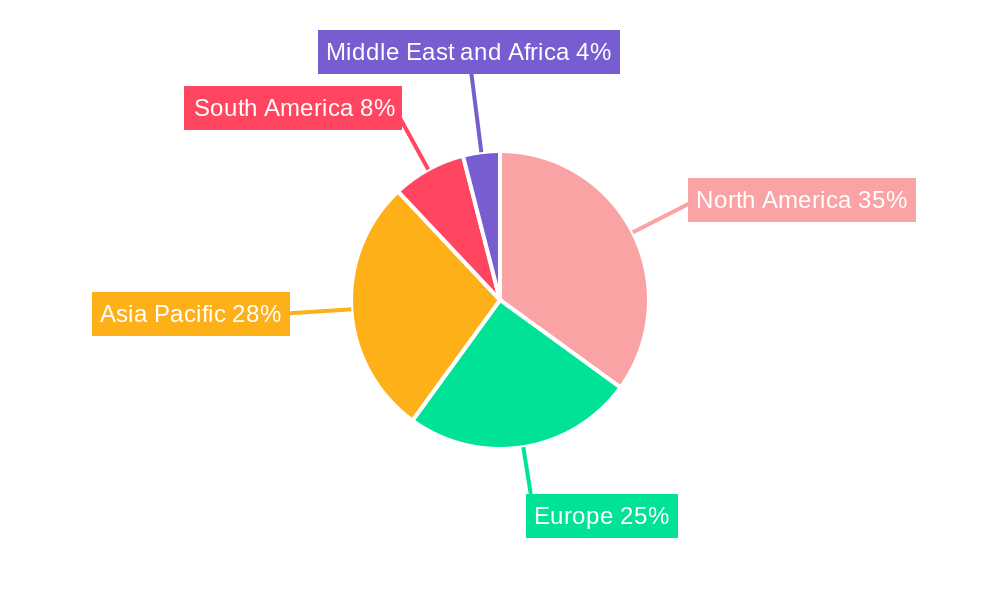
Agriculture Variable Rate Technology Market Regional Market Share
Geographic Coverage of Agriculture Variable Rate Technology Market
Agriculture Variable Rate Technology Market REPORT HIGHLIGHTS
| Aspects | Details |
|---|---|
| Study Period | 2020-2034 |
| Base Year | 2025 |
| Estimated Year | 2026 |
| Forecast Period | 2026-2034 |
| Historical Period | 2020-2025 |
| Growth Rate | CAGR of 9.40% from 2020-2034 |
| Segmentation |
|
Table of Contents
- 1. Introduction
- 1.1. Research Scope
- 1.2. Market Segmentation
- 1.3. Research Objective
- 1.4. Definitions and Assumptions
- 2. Executive Summary
- 2.1. Market Snapshot
- 3. Market Dynamics
- 3.1. Market Drivers
- 3.2. Market Restrains
- 3.3. Market Trends
- 3.4. Market Opportunities
- 4. Market Factor Analysis
- 4.1. Porters Five Forces
- 4.1.1. Bargaining Power of Suppliers
- 4.1.2. Bargaining Power of Buyers
- 4.1.3. Threat of New Entrants
- 4.1.4. Threat of Substitutes
- 4.1.5. Competitive Rivalry
- 4.2. PESTEL analysis
- 4.3. BCG Analysis
- 4.3.1. Stars (High Growth, High Market Share)
- 4.3.2. Cash Cows (Low Growth, High Market Share)
- 4.3.3. Question Mark (High Growth, Low Market Share)
- 4.3.4. Dogs (Low Growth, Low Market Share)
- 4.4. Ansoff Matrix Analysis
- 4.5. Supply Chain Analysis
- 4.6. Regulatory Landscape
- 4.7. Current Market Potential and Opportunity Assessment (TAM–SAM–SOM Framework)
- 4.8. RAX Analyst Note
- 4.1. Porters Five Forces
- 5. Market Analysis, Insights and Forecast 2021-2033
- 5.1. Market Analysis, Insights and Forecast - by Crop Type
- 5.1.1. Cereals & Grains
- 5.1.2. Fruits and Vegetables
- 5.1.3. Oilseeds & Pulses
- 5.1.4. Commercial Crops
- 5.2. Market Analysis, Insights and Forecast - by Application
- 5.2.1. Fertilizers
- 5.2.2. Crop Protection Chemicals
- 5.2.3. Soil Sensing
- 5.2.4. Yield Monitoring
- 5.2.5. Irrigation
- 5.2.6. Others
- 5.3. Market Analysis, Insights and Forecast - by Region
- 5.3.1. North America
- 5.3.2. South America
- 5.3.3. Europe
- 5.3.4. Middle East & Africa
- 5.3.5. Asia Pacific
- 5.1. Market Analysis, Insights and Forecast - by Crop Type
- 6. Global Agriculture Variable Rate Technology Market Analysis, Insights and Forecast, 2021-2033
- 6.1. Market Analysis, Insights and Forecast - by Crop Type
- 6.1.1. Cereals & Grains
- 6.1.2. Fruits and Vegetables
- 6.1.3. Oilseeds & Pulses
- 6.1.4. Commercial Crops
- 6.2. Market Analysis, Insights and Forecast - by Application
- 6.2.1. Fertilizers
- 6.2.2. Crop Protection Chemicals
- 6.2.3. Soil Sensing
- 6.2.4. Yield Monitoring
- 6.2.5. Irrigation
- 6.2.6. Others
- 6.1. Market Analysis, Insights and Forecast - by Crop Type
- 7. North America Agriculture Variable Rate Technology Market Analysis, Insights and Forecast, 2020-2032
- 7.1. Market Analysis, Insights and Forecast - by Crop Type
- 7.1.1. Cereals & Grains
- 7.1.2. Fruits and Vegetables
- 7.1.3. Oilseeds & Pulses
- 7.1.4. Commercial Crops
- 7.2. Market Analysis, Insights and Forecast - by Application
- 7.2.1. Fertilizers
- 7.2.2. Crop Protection Chemicals
- 7.2.3. Soil Sensing
- 7.2.4. Yield Monitoring
- 7.2.5. Irrigation
- 7.2.6. Others
- 7.1. Market Analysis, Insights and Forecast - by Crop Type
- 8. South America Agriculture Variable Rate Technology Market Analysis, Insights and Forecast, 2020-2032
- 8.1. Market Analysis, Insights and Forecast - by Crop Type
- 8.1.1. Cereals & Grains
- 8.1.2. Fruits and Vegetables
- 8.1.3. Oilseeds & Pulses
- 8.1.4. Commercial Crops
- 8.2. Market Analysis, Insights and Forecast - by Application
- 8.2.1. Fertilizers
- 8.2.2. Crop Protection Chemicals
- 8.2.3. Soil Sensing
- 8.2.4. Yield Monitoring
- 8.2.5. Irrigation
- 8.2.6. Others
- 8.1. Market Analysis, Insights and Forecast - by Crop Type
- 9. Europe Agriculture Variable Rate Technology Market Analysis, Insights and Forecast, 2020-2032
- 9.1. Market Analysis, Insights and Forecast - by Crop Type
- 9.1.1. Cereals & Grains
- 9.1.2. Fruits and Vegetables
- 9.1.3. Oilseeds & Pulses
- 9.1.4. Commercial Crops
- 9.2. Market Analysis, Insights and Forecast - by Application
- 9.2.1. Fertilizers
- 9.2.2. Crop Protection Chemicals
- 9.2.3. Soil Sensing
- 9.2.4. Yield Monitoring
- 9.2.5. Irrigation
- 9.2.6. Others
- 9.1. Market Analysis, Insights and Forecast - by Crop Type
- 10. Middle East & Africa Agriculture Variable Rate Technology Market Analysis, Insights and Forecast, 2020-2032
- 10.1. Market Analysis, Insights and Forecast - by Crop Type
- 10.1.1. Cereals & Grains
- 10.1.2. Fruits and Vegetables
- 10.1.3. Oilseeds & Pulses
- 10.1.4. Commercial Crops
- 10.2. Market Analysis, Insights and Forecast - by Application
- 10.2.1. Fertilizers
- 10.2.2. Crop Protection Chemicals
- 10.2.3. Soil Sensing
- 10.2.4. Yield Monitoring
- 10.2.5. Irrigation
- 10.2.6. Others
- 10.1. Market Analysis, Insights and Forecast - by Crop Type
- 11. Asia Pacific Agriculture Variable Rate Technology Market Analysis, Insights and Forecast, 2020-2032
- 11.1. Market Analysis, Insights and Forecast - by Crop Type
- 11.1.1. Cereals & Grains
- 11.1.2. Fruits and Vegetables
- 11.1.3. Oilseeds & Pulses
- 11.1.4. Commercial Crops
- 11.2. Market Analysis, Insights and Forecast - by Application
- 11.2.1. Fertilizers
- 11.2.2. Crop Protection Chemicals
- 11.2.3. Soil Sensing
- 11.2.4. Yield Monitoring
- 11.2.5. Irrigation
- 11.2.6. Others
- 11.1. Market Analysis, Insights and Forecast - by Crop Type
- 12. Competitive Analysis
- 12.1. Company Profiles
- 12.1.1 CNH Industrial N V
- 12.1.1.1. Company Overview
- 12.1.1.2. Products
- 12.1.1.3. Company Financials
- 12.1.1.4. SWOT Analysis
- 12.1.2 AG Leader Technology
- 12.1.2.1. Company Overview
- 12.1.2.2. Products
- 12.1.2.3. Company Financials
- 12.1.2.4. SWOT Analysis
- 12.1.3 Ageagle Aerial Systems
- 12.1.3.1. Company Overview
- 12.1.3.2. Products
- 12.1.3.3. Company Financials
- 12.1.3.4. SWOT Analysis
- 12.1.4 Lindsay Corporation
- 12.1.4.1. Company Overview
- 12.1.4.2. Products
- 12.1.4.3. Company Financials
- 12.1.4.4. SWOT Analysis
- 12.1.5 Deere & Company
- 12.1.5.1. Company Overview
- 12.1.5.2. Products
- 12.1.5.3. Company Financials
- 12.1.5.4. SWOT Analysis
- 12.1.6 Trimble Inc
- 12.1.6.1. Company Overview
- 12.1.6.2. Products
- 12.1.6.3. Company Financials
- 12.1.6.4. SWOT Analysis
- 12.1.7 Topcon Corporation
- 12.1.7.1. Company Overview
- 12.1.7.2. Products
- 12.1.7.3. Company Financials
- 12.1.7.4. SWOT Analysis
- 12.1.8 Valmont Industries Inc
- 12.1.8.1. Company Overview
- 12.1.8.2. Products
- 12.1.8.3. Company Financials
- 12.1.8.4. SWOT Analysis
- 12.1.9 Raven Industries Inc
- 12.1.9.1. Company Overview
- 12.1.9.2. Products
- 12.1.9.3. Company Financials
- 12.1.9.4. SWOT Analysis
- 12.1.10 AGCO Corporation
- 12.1.10.1. Company Overview
- 12.1.10.2. Products
- 12.1.10.3. Company Financials
- 12.1.10.4. SWOT Analysis
- 12.1.1 CNH Industrial N V
- 12.2. Market Entropy
- 12.2.1 Company's Key Areas Served
- 12.2.2 Recent Developments
- 12.3. Company Market Share Analysis 2025
- 12.3.1 Top 5 Companies Market Share Analysis
- 12.3.2 Top 3 Companies Market Share Analysis
- 12.4. List of Potential Customers
- 13. Research Methodology
List of Figures
- Figure 1: Global Agriculture Variable Rate Technology Market Revenue Breakdown (Million, %) by Region 2025 & 2033
- Figure 2: North America Agriculture Variable Rate Technology Market Revenue (Million), by Crop Type 2025 & 2033
- Figure 3: North America Agriculture Variable Rate Technology Market Revenue Share (%), by Crop Type 2025 & 2033
- Figure 4: North America Agriculture Variable Rate Technology Market Revenue (Million), by Application 2025 & 2033
- Figure 5: North America Agriculture Variable Rate Technology Market Revenue Share (%), by Application 2025 & 2033
- Figure 6: North America Agriculture Variable Rate Technology Market Revenue (Million), by Country 2025 & 2033
- Figure 7: North America Agriculture Variable Rate Technology Market Revenue Share (%), by Country 2025 & 2033
- Figure 8: South America Agriculture Variable Rate Technology Market Revenue (Million), by Crop Type 2025 & 2033
- Figure 9: South America Agriculture Variable Rate Technology Market Revenue Share (%), by Crop Type 2025 & 2033
- Figure 10: South America Agriculture Variable Rate Technology Market Revenue (Million), by Application 2025 & 2033
- Figure 11: South America Agriculture Variable Rate Technology Market Revenue Share (%), by Application 2025 & 2033
- Figure 12: South America Agriculture Variable Rate Technology Market Revenue (Million), by Country 2025 & 2033
- Figure 13: South America Agriculture Variable Rate Technology Market Revenue Share (%), by Country 2025 & 2033
- Figure 14: Europe Agriculture Variable Rate Technology Market Revenue (Million), by Crop Type 2025 & 2033
- Figure 15: Europe Agriculture Variable Rate Technology Market Revenue Share (%), by Crop Type 2025 & 2033
- Figure 16: Europe Agriculture Variable Rate Technology Market Revenue (Million), by Application 2025 & 2033
- Figure 17: Europe Agriculture Variable Rate Technology Market Revenue Share (%), by Application 2025 & 2033
- Figure 18: Europe Agriculture Variable Rate Technology Market Revenue (Million), by Country 2025 & 2033
- Figure 19: Europe Agriculture Variable Rate Technology Market Revenue Share (%), by Country 2025 & 2033
- Figure 20: Middle East & Africa Agriculture Variable Rate Technology Market Revenue (Million), by Crop Type 2025 & 2033
- Figure 21: Middle East & Africa Agriculture Variable Rate Technology Market Revenue Share (%), by Crop Type 2025 & 2033
- Figure 22: Middle East & Africa Agriculture Variable Rate Technology Market Revenue (Million), by Application 2025 & 2033
- Figure 23: Middle East & Africa Agriculture Variable Rate Technology Market Revenue Share (%), by Application 2025 & 2033
- Figure 24: Middle East & Africa Agriculture Variable Rate Technology Market Revenue (Million), by Country 2025 & 2033
- Figure 25: Middle East & Africa Agriculture Variable Rate Technology Market Revenue Share (%), by Country 2025 & 2033
- Figure 26: Asia Pacific Agriculture Variable Rate Technology Market Revenue (Million), by Crop Type 2025 & 2033
- Figure 27: Asia Pacific Agriculture Variable Rate Technology Market Revenue Share (%), by Crop Type 2025 & 2033
- Figure 28: Asia Pacific Agriculture Variable Rate Technology Market Revenue (Million), by Application 2025 & 2033
- Figure 29: Asia Pacific Agriculture Variable Rate Technology Market Revenue Share (%), by Application 2025 & 2033
- Figure 30: Asia Pacific Agriculture Variable Rate Technology Market Revenue (Million), by Country 2025 & 2033
- Figure 31: Asia Pacific Agriculture Variable Rate Technology Market Revenue Share (%), by Country 2025 & 2033
List of Tables
- Table 1: Global Agriculture Variable Rate Technology Market Revenue Million Forecast, by Crop Type 2020 & 2033
- Table 2: Global Agriculture Variable Rate Technology Market Revenue Million Forecast, by Application 2020 & 2033
- Table 3: Global Agriculture Variable Rate Technology Market Revenue Million Forecast, by Region 2020 & 2033
- Table 4: Global Agriculture Variable Rate Technology Market Revenue Million Forecast, by Crop Type 2020 & 2033
- Table 5: Global Agriculture Variable Rate Technology Market Revenue Million Forecast, by Application 2020 & 2033
- Table 6: Global Agriculture Variable Rate Technology Market Revenue Million Forecast, by Country 2020 & 2033
- Table 7: United States Agriculture Variable Rate Technology Market Revenue (Million) Forecast, by Application 2020 & 2033
- Table 8: Canada Agriculture Variable Rate Technology Market Revenue (Million) Forecast, by Application 2020 & 2033
- Table 9: Mexico Agriculture Variable Rate Technology Market Revenue (Million) Forecast, by Application 2020 & 2033
- Table 10: Global Agriculture Variable Rate Technology Market Revenue Million Forecast, by Crop Type 2020 & 2033
- Table 11: Global Agriculture Variable Rate Technology Market Revenue Million Forecast, by Application 2020 & 2033
- Table 12: Global Agriculture Variable Rate Technology Market Revenue Million Forecast, by Country 2020 & 2033
- Table 13: Brazil Agriculture Variable Rate Technology Market Revenue (Million) Forecast, by Application 2020 & 2033
- Table 14: Argentina Agriculture Variable Rate Technology Market Revenue (Million) Forecast, by Application 2020 & 2033
- Table 15: Rest of South America Agriculture Variable Rate Technology Market Revenue (Million) Forecast, by Application 2020 & 2033
- Table 16: Global Agriculture Variable Rate Technology Market Revenue Million Forecast, by Crop Type 2020 & 2033
- Table 17: Global Agriculture Variable Rate Technology Market Revenue Million Forecast, by Application 2020 & 2033
- Table 18: Global Agriculture Variable Rate Technology Market Revenue Million Forecast, by Country 2020 & 2033
- Table 19: United Kingdom Agriculture Variable Rate Technology Market Revenue (Million) Forecast, by Application 2020 & 2033
- Table 20: Germany Agriculture Variable Rate Technology Market Revenue (Million) Forecast, by Application 2020 & 2033
- Table 21: France Agriculture Variable Rate Technology Market Revenue (Million) Forecast, by Application 2020 & 2033
- Table 22: Italy Agriculture Variable Rate Technology Market Revenue (Million) Forecast, by Application 2020 & 2033
- Table 23: Spain Agriculture Variable Rate Technology Market Revenue (Million) Forecast, by Application 2020 & 2033
- Table 24: Russia Agriculture Variable Rate Technology Market Revenue (Million) Forecast, by Application 2020 & 2033
- Table 25: Benelux Agriculture Variable Rate Technology Market Revenue (Million) Forecast, by Application 2020 & 2033
- Table 26: Nordics Agriculture Variable Rate Technology Market Revenue (Million) Forecast, by Application 2020 & 2033
- Table 27: Rest of Europe Agriculture Variable Rate Technology Market Revenue (Million) Forecast, by Application 2020 & 2033
- Table 28: Global Agriculture Variable Rate Technology Market Revenue Million Forecast, by Crop Type 2020 & 2033
- Table 29: Global Agriculture Variable Rate Technology Market Revenue Million Forecast, by Application 2020 & 2033
- Table 30: Global Agriculture Variable Rate Technology Market Revenue Million Forecast, by Country 2020 & 2033
- Table 31: Turkey Agriculture Variable Rate Technology Market Revenue (Million) Forecast, by Application 2020 & 2033
- Table 32: Israel Agriculture Variable Rate Technology Market Revenue (Million) Forecast, by Application 2020 & 2033
- Table 33: GCC Agriculture Variable Rate Technology Market Revenue (Million) Forecast, by Application 2020 & 2033
- Table 34: North Africa Agriculture Variable Rate Technology Market Revenue (Million) Forecast, by Application 2020 & 2033
- Table 35: South Africa Agriculture Variable Rate Technology Market Revenue (Million) Forecast, by Application 2020 & 2033
- Table 36: Rest of Middle East & Africa Agriculture Variable Rate Technology Market Revenue (Million) Forecast, by Application 2020 & 2033
- Table 37: Global Agriculture Variable Rate Technology Market Revenue Million Forecast, by Crop Type 2020 & 2033
- Table 38: Global Agriculture Variable Rate Technology Market Revenue Million Forecast, by Application 2020 & 2033
- Table 39: Global Agriculture Variable Rate Technology Market Revenue Million Forecast, by Country 2020 & 2033
- Table 40: China Agriculture Variable Rate Technology Market Revenue (Million) Forecast, by Application 2020 & 2033
- Table 41: India Agriculture Variable Rate Technology Market Revenue (Million) Forecast, by Application 2020 & 2033
- Table 42: Japan Agriculture Variable Rate Technology Market Revenue (Million) Forecast, by Application 2020 & 2033
- Table 43: South Korea Agriculture Variable Rate Technology Market Revenue (Million) Forecast, by Application 2020 & 2033
- Table 44: ASEAN Agriculture Variable Rate Technology Market Revenue (Million) Forecast, by Application 2020 & 2033
- Table 45: Oceania Agriculture Variable Rate Technology Market Revenue (Million) Forecast, by Application 2020 & 2033
- Table 46: Rest of Asia Pacific Agriculture Variable Rate Technology Market Revenue (Million) Forecast, by Application 2020 & 2033
Frequently Asked Questions
1. What is the projected Compound Annual Growth Rate (CAGR) of the Agriculture Variable Rate Technology Market?
The projected CAGR is approximately 9.40%.
2. Which companies are prominent players in the Agriculture Variable Rate Technology Market?
Key companies in the market include CNH Industrial N V, AG Leader Technology, Ageagle Aerial Systems, Lindsay Corporation, Deere & Company, Trimble Inc, Topcon Corporation, Valmont Industries Inc, Raven Industries Inc, AGCO Corporation.
3. What are the main segments of the Agriculture Variable Rate Technology Market?
The market segments include Crop Type, Application.
4. Can you provide details about the market size?
The market size is estimated to be USD 4.31 Million as of 2022.
5. What are some drivers contributing to market growth?
Low Availability of Skilled Labor; Technological Advancements.
6. What are the notable trends driving market growth?
Increasing Adoption of Digital Technologies in the Agricultural Sector.
7. Are there any restraints impacting market growth?
Increasing Farm Expenditure; Security Concerns in Modern Farming Machinery.
8. Can you provide examples of recent developments in the market?
N/A
9. What pricing options are available for accessing the report?
Pricing options include single-user, multi-user, and enterprise licenses priced at USD 3800, USD 4500, and USD 5800 respectively.
10. Is the market size provided in terms of value or volume?
The market size is provided in terms of value, measured in Million.
11. Are there any specific market keywords associated with the report?
Yes, the market keyword associated with the report is "Agriculture Variable Rate Technology Market," which aids in identifying and referencing the specific market segment covered.
12. How do I determine which pricing option suits my needs best?
The pricing options vary based on user requirements and access needs. Individual users may opt for single-user licenses, while businesses requiring broader access may choose multi-user or enterprise licenses for cost-effective access to the report.
13. Are there any additional resources or data provided in the Agriculture Variable Rate Technology Market report?
While the report offers comprehensive insights, it's advisable to review the specific contents or supplementary materials provided to ascertain if additional resources or data are available.
14. How can I stay updated on further developments or reports in the Agriculture Variable Rate Technology Market?
To stay informed about further developments, trends, and reports in the Agriculture Variable Rate Technology Market, consider subscribing to industry newsletters, following relevant companies and organizations, or regularly checking reputable industry news sources and publications.
Methodology
Step 1 - Identification of Relevant Samples Size from Population Database


Step 2 - Approaches for Defining Global Market Size (Value, Volume* & Price*)

Note*: In applicable scenarios
Step 3 - Data Sources
Primary Research
- Web Analytics
- Survey Reports
- Research Institute
- Latest Research Reports
- Opinion Leaders
Secondary Research
- Annual Reports
- White Paper
- Latest Press Release
- Industry Association
- Paid Database
- Investor Presentations

Step 4 - Data Triangulation
Involves using different sources of information in order to increase the validity of a study
These sources are likely to be stakeholders in a program - participants, other researchers, program staff, other community members, and so on.
Then we put all data in single framework & apply various statistical tools to find out the dynamic on the market.
During the analysis stage, feedback from the stakeholder groups would be compared to determine areas of agreement as well as areas of divergence

