Key Insights
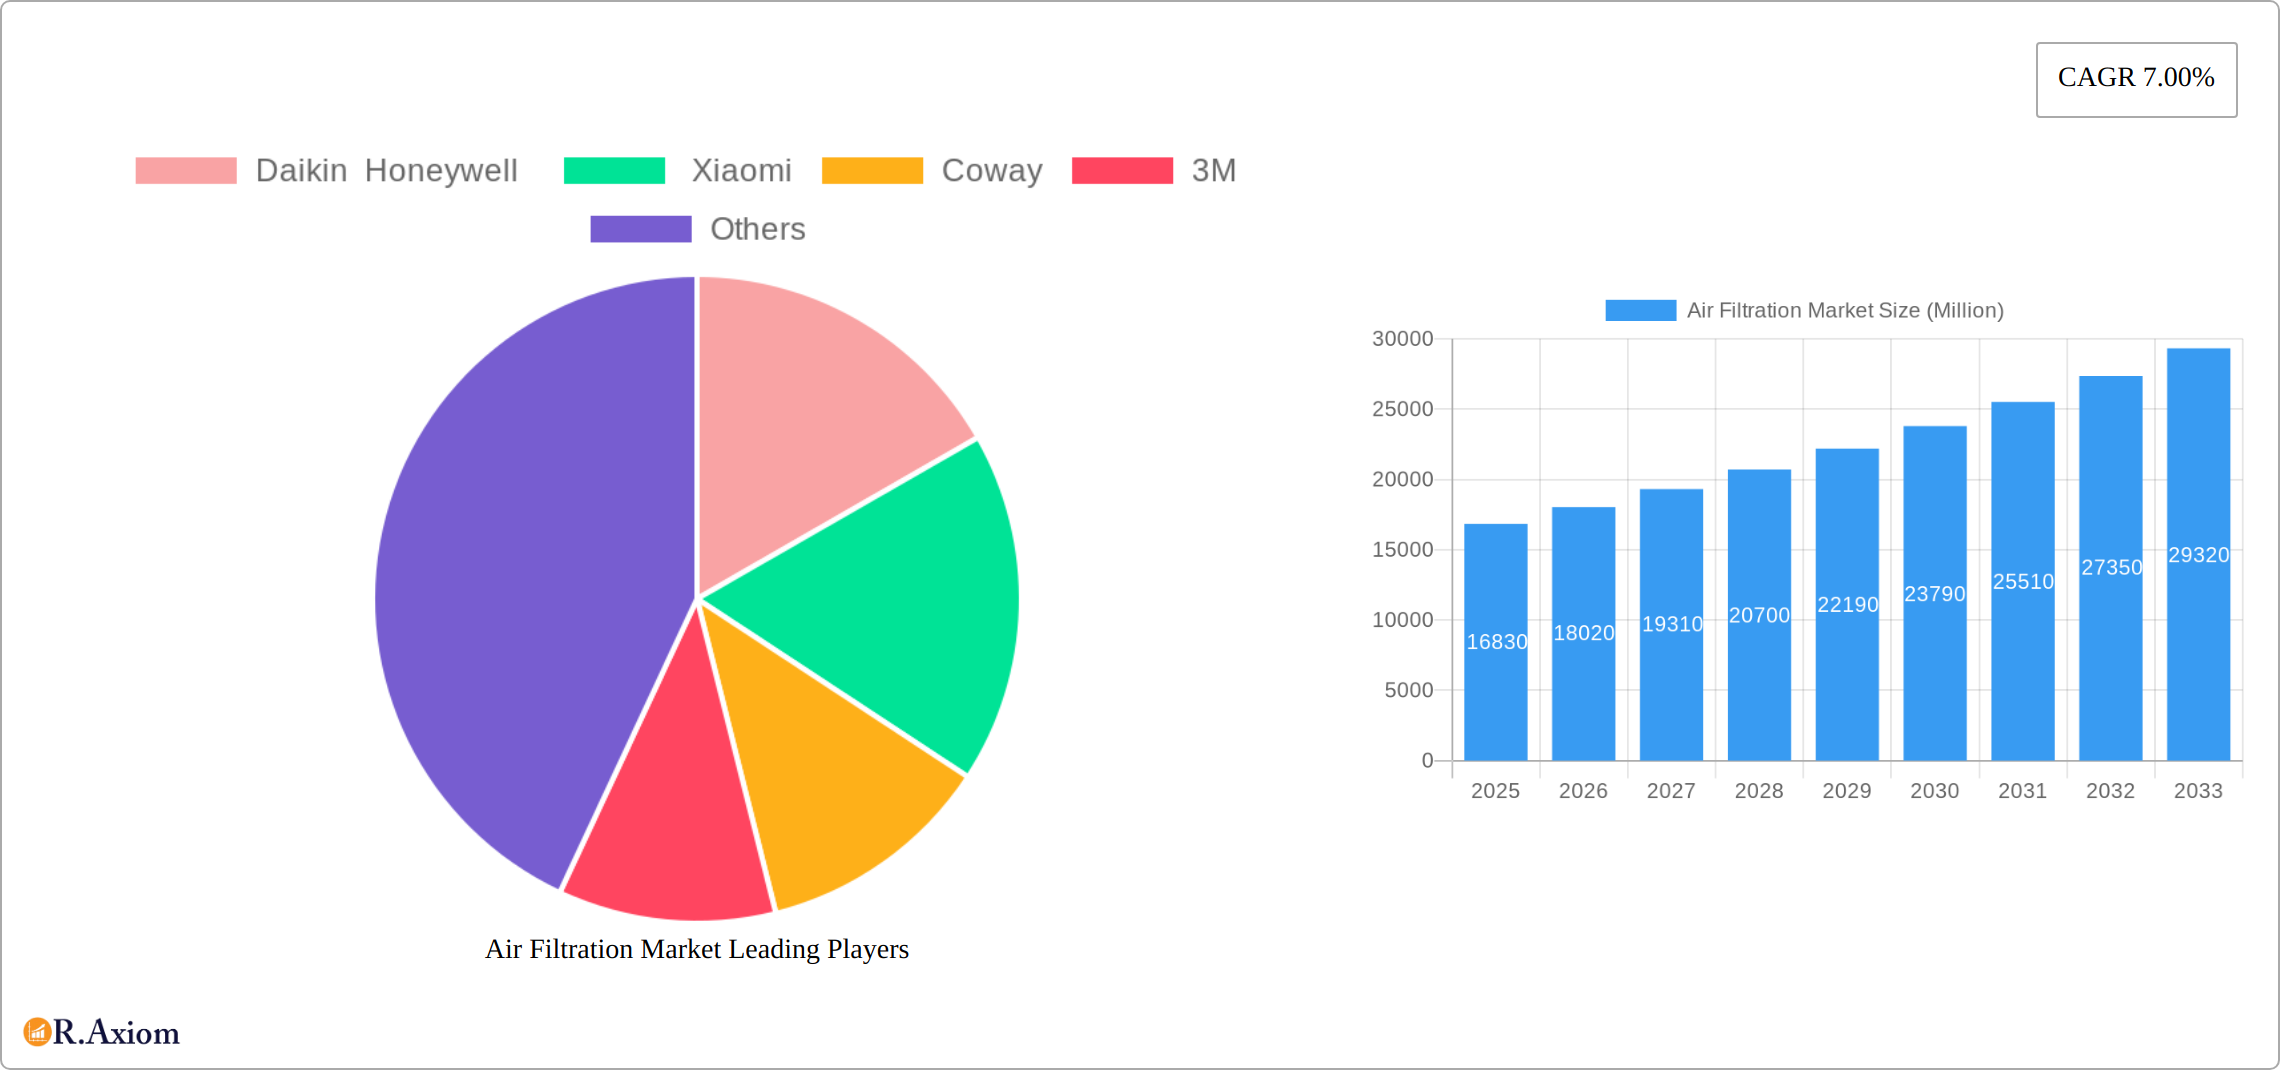
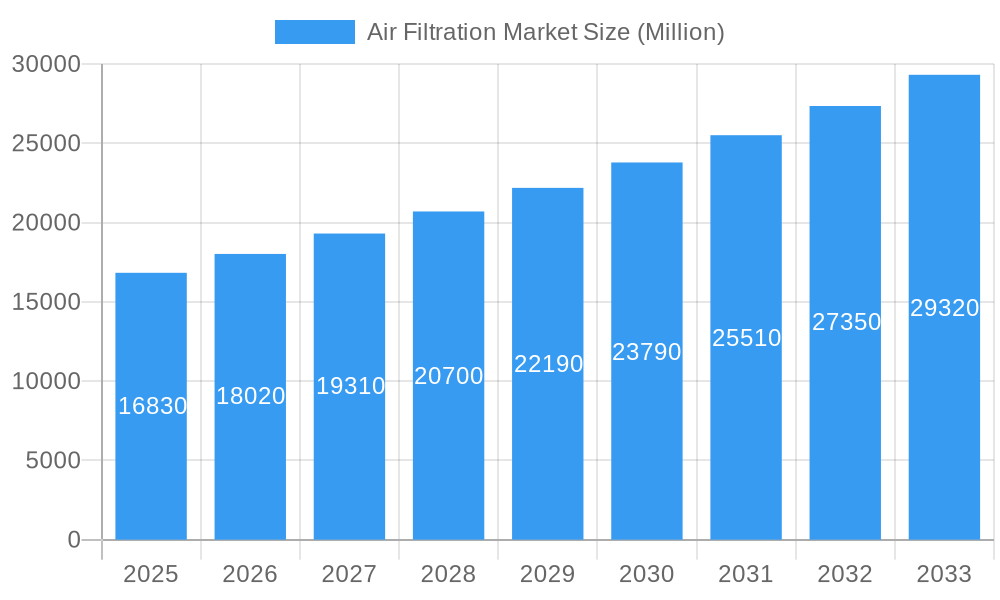
The global air filtration market, valued at $16.83 billion in 2025, is projected to experience robust growth, driven by a compound annual growth rate (CAGR) of 7.00% from 2025 to 2033. This expansion is fueled by several key factors. Increasing awareness of indoor air quality (IAQ) and its impact on health, particularly concerning allergies, asthma, and respiratory illnesses, is a primary driver. The rising prevalence of these conditions, coupled with stricter government regulations on air pollution in both residential and commercial spaces, is stimulating demand for effective air filtration systems. Furthermore, technological advancements in filtration technologies, such as the development of more efficient HEPA filters and the integration of smart home features in air purifiers, are contributing to market growth. The growing adoption of air purifiers in developing economies, spurred by rising disposable incomes and urbanization, is also a significant factor. The commercial sector, particularly offices and healthcare facilities, is experiencing substantial growth due to the emphasis on providing healthy and productive work environments.
Air Filtration Market Market Size (In Billion)
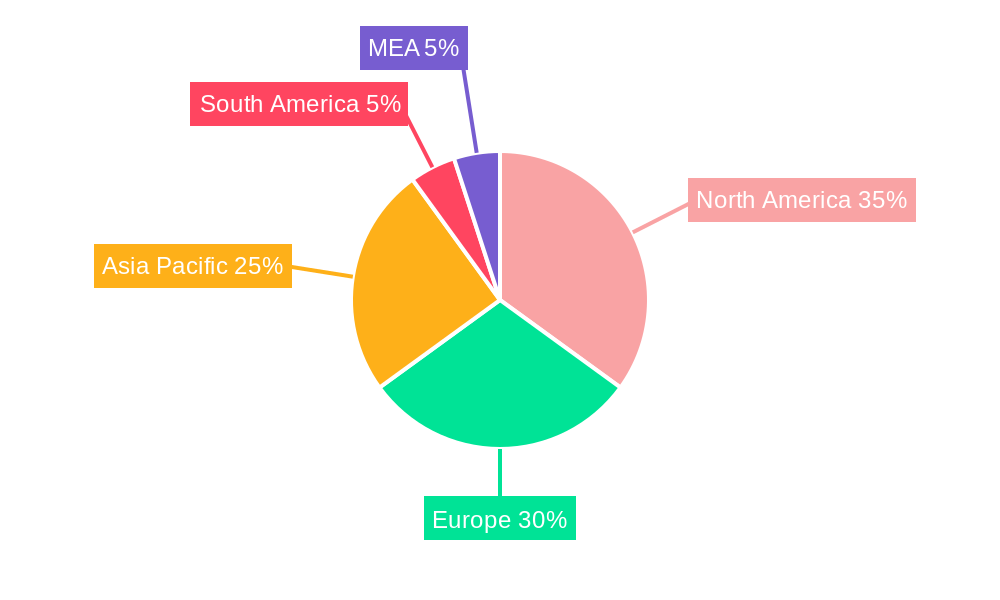
Market segmentation reveals a strong preference for HEPA filtration technology, which dominates the filtration technology segment. Stand-alone units hold a larger market share compared to in-duct systems, reflecting consumer preference for flexibility and ease of installation. The residential segment contributes significantly to overall market size, although the commercial and industrial sectors are experiencing faster growth rates due to increasing investments in IAQ improvement. Key players like Daikin, Honeywell, Xiaomi, Coway, and 3M are actively shaping the market through innovation, product diversification, and strategic acquisitions. Geographic analysis indicates strong market presence in North America and Europe, followed by rapidly expanding markets in Asia-Pacific, driven by increasing urbanization and economic growth in countries like China and India. The South America and MEA regions are expected to show significant growth potential in the coming years due to rising awareness of air quality issues and increased disposable incomes.
Air Filtration Market Company Market Share
Air Filtration Market: A Comprehensive Report (2019-2033)
This detailed report provides a comprehensive analysis of the Air Filtration Market, covering the period 2019-2033, with a focus on market dynamics, key players, and future growth prospects. The report leverages extensive research and data analysis to offer actionable insights for industry stakeholders. The base year for this analysis is 2025, with estimations for 2025 and a forecast period spanning 2025-2033, alongside historical data from 2019-2024. The global Air Filtration Market is valued at xx Million in 2025 and is projected to reach xx Million by 2033, exhibiting a CAGR of xx% during the forecast period.
Air Filtration Market Concentration & Innovation
The Air Filtration Market is characterized by a moderately concentrated landscape with several prominent players holding significant market share. Daikin, Honeywell, Xiaomi, Coway, and 3M are among the leading companies, each employing distinct strategies to maintain competitiveness. Market share distribution amongst these companies in 2025 is estimated as follows: Daikin (xx%), Honeywell (xx%), Xiaomi (xx%), Coway (xx%), 3M (xx%), and Others (xx%). Innovation is a crucial driver, with companies constantly developing advanced filtration technologies to cater to evolving consumer demands and stricter regulatory norms.
- Innovation Drivers: Advancements in HEPA filtration, electrostatic precipitators, and ionizer technologies are key drivers. The emergence of smart air purifiers with IoT capabilities further fuels innovation.
- Regulatory Frameworks: Stringent air quality regulations in various regions are pushing market growth. These regulations impose stricter standards for air purifier performance and emissions.
- Product Substitutes: Natural ventilation and traditional air cleaning methods are potential substitutes but offer limited efficiency compared to advanced air filtration systems.
- End-User Trends: Increasing awareness of indoor air quality and its impact on health is a major driver. The rise of allergy and asthma prevalence also boosts demand, particularly in residential and commercial sectors.
- M&A Activities: Consolidation within the market is anticipated through strategic mergers and acquisitions. While precise M&A deal values are not publicly available for every transaction, the total value of M&A activity in the historical period is estimated at xx Million.
Air Filtration Market Industry Trends & Insights
The Air Filtration Market is experiencing robust growth driven by several factors. Increasing urbanization and industrialization lead to deteriorating air quality, prompting greater demand for air purification solutions. The rising prevalence of respiratory illnesses and allergies fuels consumer preference for improved indoor air quality. Technological advancements, particularly in HEPA filtration and smart technologies, are enhancing product efficacy and convenience. The market's competitive dynamics are characterized by intense rivalry, innovation, and strategic expansions by key players. The market shows a high degree of penetration in developed economies, but developing countries represent significant growth opportunities.
The estimated market size for 2025 is xx Million, projecting a substantial increase to xx Million by 2033, driven primarily by advancements in filtration technologies and the increasing awareness of respiratory health issues. Consumer preference for smart, energy-efficient, and aesthetically pleasing air purifiers is also driving market growth.
Dominant Markets & Segments in Air Filtration Market
The Asia-Pacific region currently dominates the Air Filtration Market, driven by rapid urbanization, rising disposable incomes, and increased awareness of air quality issues in countries like China and India. Within this region, China holds a significant market share due to its large population and high levels of air pollution.
- Filtration Technology: HEPA filtration holds the largest segment share due to its high efficiency in removing particulate matter. Other filtration technologies, such as electrostatic precipitators and ionizers, are growing steadily, driven by their cost-effectiveness in specific applications.
- Type: Stand-alone air purifiers represent the largest market segment, owing to their ease of installation and portability. In-duct systems are gaining traction in commercial and industrial settings due to their ability to purify larger volumes of air.
- End-User: The residential segment is presently the largest, driven by increasing health consciousness. However, the commercial and industrial segments are expected to register robust growth due to stringent regulatory norms and the increasing focus on employee well-being.
Key drivers for regional dominance include favorable government policies promoting clean air initiatives, increasing investments in infrastructure development, and rising health concerns. The market displays substantial growth potential in developing economies, propelled by escalating urbanization, industrial development, and an increasing disposable income.
Air Filtration Market Product Developments
The air filtration market is experiencing a surge in innovation, driven by a growing demand for smart, energy-efficient, and compact air purification solutions. Manufacturers are incorporating cutting-edge technologies to enhance user experience and deliver superior performance. This includes the integration of advanced sensors for real-time air quality monitoring, IoT capabilities for remote control and data analysis, and intuitive user interfaces for seamless operation. A key focus remains on improving filtration efficiency while minimizing noise levels, addressing major consumer concerns. While HEPA filtration remains a cornerstone technology, manufacturers are increasingly integrating other filtration methods, such as activated carbon and UV-C sterilization, to create holistic air purification systems capable of tackling a wider range of pollutants. This strategic diversification allows companies to cater to specific air quality needs and diverse consumer preferences, fostering a highly competitive market landscape.
Report Scope & Segmentation Analysis
This report provides a comprehensive analysis of the Air Filtration Market, segmented by Filtration Technology (HEPA, Other Filtration Technologies), Type (Stand-alone, In-duct), and End-User (Residential, Commercial, Industrial). Each segment is meticulously examined, considering current market size, future growth projections, and prevailing competitive dynamics. Detailed insights are provided to understand the market's structure and potential.
- Filtration Technology: HEPA filtration is anticipated to retain its market leadership due to its proven effectiveness. However, the "Other Filtration Technologies" segment is poised for accelerated growth, fueled by technological advancements resulting in more cost-effective and specialized solutions for specific pollutants.
- Type: Stand-alone air purifiers are projected to dominate sales volume, driven by consumer demand for convenient and versatile solutions. In-duct systems are expected to witness significant growth, particularly in large-scale commercial and industrial settings where integrated air purification is crucial.
- End-User: The residential sector will exhibit steady growth, reflecting increasing consumer awareness of indoor air quality. Meanwhile, the commercial and industrial segments are poised for substantial expansion driven by stringent air quality regulations and a growing understanding of the impact of workplace air quality on employee health and productivity.
Key Drivers of Air Filtration Market Growth
Several factors fuel the growth of the Air Filtration Market. The escalating awareness of indoor air quality's impact on health is a primary driver, leading to increased consumer demand for air purification solutions. Government regulations mandating better air quality standards in public and commercial spaces also stimulate market expansion. Technological improvements in filtration techniques and the integration of smart features in air purifiers further enhance their appeal and efficiency.
Challenges in the Air Filtration Market Sector
The Air Filtration Market faces several key challenges. The high initial cost of advanced air purifiers can limit accessibility, particularly in price-sensitive markets. Furthermore, supply chain disruptions, impacting the availability and cost of raw materials and components, can significantly affect production volumes and pricing. The intensely competitive market necessitates continuous innovation and effective product differentiation to maintain market share. Finally, navigating complex regulatory landscapes, including stringent product testing and certification requirements, presents a significant hurdle for manufacturers.
Emerging Opportunities in Air Filtration Market
Emerging opportunities include the expansion into developing economies with rising air pollution levels, and the growing adoption of smart home technology offering integration with other smart devices. The integration of air purification technologies into HVAC systems also presents a substantial opportunity, and the development of specialized air purifiers tailored to specific allergens and pollutants offers exciting growth avenues.
Key Developments in Air Filtration Market Industry
- March 2023: Xiaomi Corp. launched the MIJIA full-effect air purifier in China, boasting a 12,500-liter/minute air volume and approximately 99% virus removal capacity. This launch is expected to significantly boost sales within the Chinese market.
- March 2023: Blueair introduced the Blue Pure Max air purifier, emphasizing minimal noise, robust design, and improved performance for rooms up to 1,524 square feet within 30 minutes. This product launch reflects the market's focus on enhanced performance and user experience.
Strategic Outlook for Air Filtration Market
The Air Filtration Market exhibits promising growth potential driven by escalating environmental concerns, technological advancements, and increased health awareness. Future market expansion will likely be fueled by the increasing adoption of smart air purifiers, penetration into developing economies, and the integration of air purification systems within larger building management systems. Continuous innovation in filtration technologies and product differentiation will be crucial for maintaining competitiveness within this rapidly evolving market.
Air Filtration Market Segmentation
-
1. Filtration Technology
- 1.1. High-efficiency Particulate Air (HEPA)
- 1.2. Other Fi
-
2. Type
- 2.1. Stand-alone
- 2.2. In-duct
-
3. End User
- 3.1. Residential
- 3.2. Commercial
- 3.3. Industrial
Air Filtration Market Segmentation By Geography
-
1. North America
- 1.1. United States
- 1.2. Canada
- 1.3. Rest of North America
-
2. Europe
- 2.1. United Kingdom
- 2.2. Germany
- 2.3. Spain
- 2.4. NORDIC
- 2.5. Russia
- 2.6. Turkey
- 2.7. Italy
- 2.8. Rest of Europe
-
3. Asia Pacific
- 3.1. China
- 3.2. India
- 3.3. Japan
- 3.4. Malaysia
- 3.5. Thailand
- 3.6. Indonesia
- 3.7. Vietnam
- 3.8. Rest of Asia Pacific
-
4. South America
- 4.1. Brazil
- 4.2. Argentina
- 4.3. Colombia
- 4.4. Rest of South America
-
5. Middle East and Africa
- 5.1. United Arab Emirates
- 5.2. Saudi Arabia
- 5.3. South Africa
- 5.4. Nigeria
- 5.5. Qatar
- 5.6. Egypt
- 5.7. Rest of Middle East and Africa
Air Filtration Market Regional Market Share
Geographic Coverage of Air Filtration Market
Air Filtration Market REPORT HIGHLIGHTS
| Aspects | Details |
|---|---|
| Study Period | 2020-2034 |
| Base Year | 2025 |
| Estimated Year | 2026 |
| Forecast Period | 2026-2034 |
| Historical Period | 2020-2025 |
| Growth Rate | CAGR of 7.00% from 2020-2034 |
| Segmentation |
|
Table of Contents
- 1. Introduction
- 1.1. Research Scope
- 1.2. Market Segmentation
- 1.3. Research Objective
- 1.4. Definitions and Assumptions
- 2. Executive Summary
- 2.1. Market Snapshot
- 3. Market Dynamics
- 3.1. Market Drivers
- 3.2. Market Restrains
- 3.3. Market Trends
- 3.4. Market Opportunities
- 4. Market Factor Analysis
- 4.1. Porters Five Forces
- 4.1.1. Bargaining Power of Suppliers
- 4.1.2. Bargaining Power of Buyers
- 4.1.3. Threat of New Entrants
- 4.1.4. Threat of Substitutes
- 4.1.5. Competitive Rivalry
- 4.2. PESTEL analysis
- 4.3. BCG Analysis
- 4.3.1. Stars (High Growth, High Market Share)
- 4.3.2. Cash Cows (Low Growth, High Market Share)
- 4.3.3. Question Mark (High Growth, Low Market Share)
- 4.3.4. Dogs (Low Growth, Low Market Share)
- 4.4. Ansoff Matrix Analysis
- 4.5. Supply Chain Analysis
- 4.6. Regulatory Landscape
- 4.7. Current Market Potential and Opportunity Assessment (TAM–SAM–SOM Framework)
- 4.8. RAX Analyst Note
- 4.1. Porters Five Forces
- 5. Market Analysis, Insights and Forecast 2021-2033
- 5.1. Market Analysis, Insights and Forecast - by Filtration Technology
- 5.1.1. High-efficiency Particulate Air (HEPA)
- 5.1.2. Other Fi
- 5.2. Market Analysis, Insights and Forecast - by Type
- 5.2.1. Stand-alone
- 5.2.2. In-duct
- 5.3. Market Analysis, Insights and Forecast - by End User
- 5.3.1. Residential
- 5.3.2. Commercial
- 5.3.3. Industrial
- 5.4. Market Analysis, Insights and Forecast - by Region
- 5.4.1. North America
- 5.4.2. Europe
- 5.4.3. Asia Pacific
- 5.4.4. South America
- 5.4.5. Middle East and Africa
- 5.1. Market Analysis, Insights and Forecast - by Filtration Technology
- 6. Global Air Filtration Market Analysis, Insights and Forecast, 2021-2033
- 6.1. Market Analysis, Insights and Forecast - by Filtration Technology
- 6.1.1. High-efficiency Particulate Air (HEPA)
- 6.1.2. Other Fi
- 6.2. Market Analysis, Insights and Forecast - by Type
- 6.2.1. Stand-alone
- 6.2.2. In-duct
- 6.3. Market Analysis, Insights and Forecast - by End User
- 6.3.1. Residential
- 6.3.2. Commercial
- 6.3.3. Industrial
- 6.1. Market Analysis, Insights and Forecast - by Filtration Technology
- 7. North America Air Filtration Market Analysis, Insights and Forecast, 2020-2032
- 7.1. Market Analysis, Insights and Forecast - by Filtration Technology
- 7.1.1. High-efficiency Particulate Air (HEPA)
- 7.1.2. Other Fi
- 7.2. Market Analysis, Insights and Forecast - by Type
- 7.2.1. Stand-alone
- 7.2.2. In-duct
- 7.3. Market Analysis, Insights and Forecast - by End User
- 7.3.1. Residential
- 7.3.2. Commercial
- 7.3.3. Industrial
- 7.1. Market Analysis, Insights and Forecast - by Filtration Technology
- 8. Europe Air Filtration Market Analysis, Insights and Forecast, 2020-2032
- 8.1. Market Analysis, Insights and Forecast - by Filtration Technology
- 8.1.1. High-efficiency Particulate Air (HEPA)
- 8.1.2. Other Fi
- 8.2. Market Analysis, Insights and Forecast - by Type
- 8.2.1. Stand-alone
- 8.2.2. In-duct
- 8.3. Market Analysis, Insights and Forecast - by End User
- 8.3.1. Residential
- 8.3.2. Commercial
- 8.3.3. Industrial
- 8.1. Market Analysis, Insights and Forecast - by Filtration Technology
- 9. Asia Pacific Air Filtration Market Analysis, Insights and Forecast, 2020-2032
- 9.1. Market Analysis, Insights and Forecast - by Filtration Technology
- 9.1.1. High-efficiency Particulate Air (HEPA)
- 9.1.2. Other Fi
- 9.2. Market Analysis, Insights and Forecast - by Type
- 9.2.1. Stand-alone
- 9.2.2. In-duct
- 9.3. Market Analysis, Insights and Forecast - by End User
- 9.3.1. Residential
- 9.3.2. Commercial
- 9.3.3. Industrial
- 9.1. Market Analysis, Insights and Forecast - by Filtration Technology
- 10. South America Air Filtration Market Analysis, Insights and Forecast, 2020-2032
- 10.1. Market Analysis, Insights and Forecast - by Filtration Technology
- 10.1.1. High-efficiency Particulate Air (HEPA)
- 10.1.2. Other Fi
- 10.2. Market Analysis, Insights and Forecast - by Type
- 10.2.1. Stand-alone
- 10.2.2. In-duct
- 10.3. Market Analysis, Insights and Forecast - by End User
- 10.3.1. Residential
- 10.3.2. Commercial
- 10.3.3. Industrial
- 10.1. Market Analysis, Insights and Forecast - by Filtration Technology
- 11. Middle East and Africa Air Filtration Market Analysis, Insights and Forecast, 2020-2032
- 11.1. Market Analysis, Insights and Forecast - by Filtration Technology
- 11.1.1. High-efficiency Particulate Air (HEPA)
- 11.1.2. Other Fi
- 11.2. Market Analysis, Insights and Forecast - by Type
- 11.2.1. Stand-alone
- 11.2.2. In-duct
- 11.3. Market Analysis, Insights and Forecast - by End User
- 11.3.1. Residential
- 11.3.2. Commercial
- 11.3.3. Industrial
- 11.1. Market Analysis, Insights and Forecast - by Filtration Technology
- 12. Competitive Analysis
- 12.1. Company Profiles
- 12.1.1 Daikin Honeywell
- 12.1.1.1. Company Overview
- 12.1.1.2. Products
- 12.1.1.3. Company Financials
- 12.1.1.4. SWOT Analysis
- 12.1.2 Xiaomi
- 12.1.2.1. Company Overview
- 12.1.2.2. Products
- 12.1.2.3. Company Financials
- 12.1.2.4. SWOT Analysis
- 12.1.3 Coway
- 12.1.3.1. Company Overview
- 12.1.3.2. Products
- 12.1.3.3. Company Financials
- 12.1.3.4. SWOT Analysis
- 12.1.4 3M
- 12.1.4.1. Company Overview
- 12.1.4.2. Products
- 12.1.4.3. Company Financials
- 12.1.4.4. SWOT Analysis
- 12.1.1 Daikin Honeywell
- 12.2. Market Entropy
- 12.2.1 Company's Key Areas Served
- 12.2.2 Recent Developments
- 12.3. Company Market Share Analysis 2025
- 12.3.1 Top 5 Companies Market Share Analysis
- 12.3.2 Top 3 Companies Market Share Analysis
- 12.4. List of Potential Customers
- 13. Research Methodology
List of Figures
- Figure 1: Global Air Filtration Market Revenue Breakdown (Million, %) by Region 2025 & 2033
- Figure 2: Global Air Filtration Market Volume Breakdown (K Unit, %) by Region 2025 & 2033
- Figure 3: North America Air Filtration Market Revenue (Million), by Filtration Technology 2025 & 2033
- Figure 4: North America Air Filtration Market Volume (K Unit), by Filtration Technology 2025 & 2033
- Figure 5: North America Air Filtration Market Revenue Share (%), by Filtration Technology 2025 & 2033
- Figure 6: North America Air Filtration Market Volume Share (%), by Filtration Technology 2025 & 2033
- Figure 7: North America Air Filtration Market Revenue (Million), by Type 2025 & 2033
- Figure 8: North America Air Filtration Market Volume (K Unit), by Type 2025 & 2033
- Figure 9: North America Air Filtration Market Revenue Share (%), by Type 2025 & 2033
- Figure 10: North America Air Filtration Market Volume Share (%), by Type 2025 & 2033
- Figure 11: North America Air Filtration Market Revenue (Million), by End User 2025 & 2033
- Figure 12: North America Air Filtration Market Volume (K Unit), by End User 2025 & 2033
- Figure 13: North America Air Filtration Market Revenue Share (%), by End User 2025 & 2033
- Figure 14: North America Air Filtration Market Volume Share (%), by End User 2025 & 2033
- Figure 15: North America Air Filtration Market Revenue (Million), by Country 2025 & 2033
- Figure 16: North America Air Filtration Market Volume (K Unit), by Country 2025 & 2033
- Figure 17: North America Air Filtration Market Revenue Share (%), by Country 2025 & 2033
- Figure 18: North America Air Filtration Market Volume Share (%), by Country 2025 & 2033
- Figure 19: Europe Air Filtration Market Revenue (Million), by Filtration Technology 2025 & 2033
- Figure 20: Europe Air Filtration Market Volume (K Unit), by Filtration Technology 2025 & 2033
- Figure 21: Europe Air Filtration Market Revenue Share (%), by Filtration Technology 2025 & 2033
- Figure 22: Europe Air Filtration Market Volume Share (%), by Filtration Technology 2025 & 2033
- Figure 23: Europe Air Filtration Market Revenue (Million), by Type 2025 & 2033
- Figure 24: Europe Air Filtration Market Volume (K Unit), by Type 2025 & 2033
- Figure 25: Europe Air Filtration Market Revenue Share (%), by Type 2025 & 2033
- Figure 26: Europe Air Filtration Market Volume Share (%), by Type 2025 & 2033
- Figure 27: Europe Air Filtration Market Revenue (Million), by End User 2025 & 2033
- Figure 28: Europe Air Filtration Market Volume (K Unit), by End User 2025 & 2033
- Figure 29: Europe Air Filtration Market Revenue Share (%), by End User 2025 & 2033
- Figure 30: Europe Air Filtration Market Volume Share (%), by End User 2025 & 2033
- Figure 31: Europe Air Filtration Market Revenue (Million), by Country 2025 & 2033
- Figure 32: Europe Air Filtration Market Volume (K Unit), by Country 2025 & 2033
- Figure 33: Europe Air Filtration Market Revenue Share (%), by Country 2025 & 2033
- Figure 34: Europe Air Filtration Market Volume Share (%), by Country 2025 & 2033
- Figure 35: Asia Pacific Air Filtration Market Revenue (Million), by Filtration Technology 2025 & 2033
- Figure 36: Asia Pacific Air Filtration Market Volume (K Unit), by Filtration Technology 2025 & 2033
- Figure 37: Asia Pacific Air Filtration Market Revenue Share (%), by Filtration Technology 2025 & 2033
- Figure 38: Asia Pacific Air Filtration Market Volume Share (%), by Filtration Technology 2025 & 2033
- Figure 39: Asia Pacific Air Filtration Market Revenue (Million), by Type 2025 & 2033
- Figure 40: Asia Pacific Air Filtration Market Volume (K Unit), by Type 2025 & 2033
- Figure 41: Asia Pacific Air Filtration Market Revenue Share (%), by Type 2025 & 2033
- Figure 42: Asia Pacific Air Filtration Market Volume Share (%), by Type 2025 & 2033
- Figure 43: Asia Pacific Air Filtration Market Revenue (Million), by End User 2025 & 2033
- Figure 44: Asia Pacific Air Filtration Market Volume (K Unit), by End User 2025 & 2033
- Figure 45: Asia Pacific Air Filtration Market Revenue Share (%), by End User 2025 & 2033
- Figure 46: Asia Pacific Air Filtration Market Volume Share (%), by End User 2025 & 2033
- Figure 47: Asia Pacific Air Filtration Market Revenue (Million), by Country 2025 & 2033
- Figure 48: Asia Pacific Air Filtration Market Volume (K Unit), by Country 2025 & 2033
- Figure 49: Asia Pacific Air Filtration Market Revenue Share (%), by Country 2025 & 2033
- Figure 50: Asia Pacific Air Filtration Market Volume Share (%), by Country 2025 & 2033
- Figure 51: South America Air Filtration Market Revenue (Million), by Filtration Technology 2025 & 2033
- Figure 52: South America Air Filtration Market Volume (K Unit), by Filtration Technology 2025 & 2033
- Figure 53: South America Air Filtration Market Revenue Share (%), by Filtration Technology 2025 & 2033
- Figure 54: South America Air Filtration Market Volume Share (%), by Filtration Technology 2025 & 2033
- Figure 55: South America Air Filtration Market Revenue (Million), by Type 2025 & 2033
- Figure 56: South America Air Filtration Market Volume (K Unit), by Type 2025 & 2033
- Figure 57: South America Air Filtration Market Revenue Share (%), by Type 2025 & 2033
- Figure 58: South America Air Filtration Market Volume Share (%), by Type 2025 & 2033
- Figure 59: South America Air Filtration Market Revenue (Million), by End User 2025 & 2033
- Figure 60: South America Air Filtration Market Volume (K Unit), by End User 2025 & 2033
- Figure 61: South America Air Filtration Market Revenue Share (%), by End User 2025 & 2033
- Figure 62: South America Air Filtration Market Volume Share (%), by End User 2025 & 2033
- Figure 63: South America Air Filtration Market Revenue (Million), by Country 2025 & 2033
- Figure 64: South America Air Filtration Market Volume (K Unit), by Country 2025 & 2033
- Figure 65: South America Air Filtration Market Revenue Share (%), by Country 2025 & 2033
- Figure 66: South America Air Filtration Market Volume Share (%), by Country 2025 & 2033
- Figure 67: Middle East and Africa Air Filtration Market Revenue (Million), by Filtration Technology 2025 & 2033
- Figure 68: Middle East and Africa Air Filtration Market Volume (K Unit), by Filtration Technology 2025 & 2033
- Figure 69: Middle East and Africa Air Filtration Market Revenue Share (%), by Filtration Technology 2025 & 2033
- Figure 70: Middle East and Africa Air Filtration Market Volume Share (%), by Filtration Technology 2025 & 2033
- Figure 71: Middle East and Africa Air Filtration Market Revenue (Million), by Type 2025 & 2033
- Figure 72: Middle East and Africa Air Filtration Market Volume (K Unit), by Type 2025 & 2033
- Figure 73: Middle East and Africa Air Filtration Market Revenue Share (%), by Type 2025 & 2033
- Figure 74: Middle East and Africa Air Filtration Market Volume Share (%), by Type 2025 & 2033
- Figure 75: Middle East and Africa Air Filtration Market Revenue (Million), by End User 2025 & 2033
- Figure 76: Middle East and Africa Air Filtration Market Volume (K Unit), by End User 2025 & 2033
- Figure 77: Middle East and Africa Air Filtration Market Revenue Share (%), by End User 2025 & 2033
- Figure 78: Middle East and Africa Air Filtration Market Volume Share (%), by End User 2025 & 2033
- Figure 79: Middle East and Africa Air Filtration Market Revenue (Million), by Country 2025 & 2033
- Figure 80: Middle East and Africa Air Filtration Market Volume (K Unit), by Country 2025 & 2033
- Figure 81: Middle East and Africa Air Filtration Market Revenue Share (%), by Country 2025 & 2033
- Figure 82: Middle East and Africa Air Filtration Market Volume Share (%), by Country 2025 & 2033
List of Tables
- Table 1: Global Air Filtration Market Revenue Million Forecast, by Filtration Technology 2020 & 2033
- Table 2: Global Air Filtration Market Volume K Unit Forecast, by Filtration Technology 2020 & 2033
- Table 3: Global Air Filtration Market Revenue Million Forecast, by Type 2020 & 2033
- Table 4: Global Air Filtration Market Volume K Unit Forecast, by Type 2020 & 2033
- Table 5: Global Air Filtration Market Revenue Million Forecast, by End User 2020 & 2033
- Table 6: Global Air Filtration Market Volume K Unit Forecast, by End User 2020 & 2033
- Table 7: Global Air Filtration Market Revenue Million Forecast, by Region 2020 & 2033
- Table 8: Global Air Filtration Market Volume K Unit Forecast, by Region 2020 & 2033
- Table 9: Global Air Filtration Market Revenue Million Forecast, by Filtration Technology 2020 & 2033
- Table 10: Global Air Filtration Market Volume K Unit Forecast, by Filtration Technology 2020 & 2033
- Table 11: Global Air Filtration Market Revenue Million Forecast, by Type 2020 & 2033
- Table 12: Global Air Filtration Market Volume K Unit Forecast, by Type 2020 & 2033
- Table 13: Global Air Filtration Market Revenue Million Forecast, by End User 2020 & 2033
- Table 14: Global Air Filtration Market Volume K Unit Forecast, by End User 2020 & 2033
- Table 15: Global Air Filtration Market Revenue Million Forecast, by Country 2020 & 2033
- Table 16: Global Air Filtration Market Volume K Unit Forecast, by Country 2020 & 2033
- Table 17: United States Air Filtration Market Revenue (Million) Forecast, by Application 2020 & 2033
- Table 18: United States Air Filtration Market Volume (K Unit) Forecast, by Application 2020 & 2033
- Table 19: Canada Air Filtration Market Revenue (Million) Forecast, by Application 2020 & 2033
- Table 20: Canada Air Filtration Market Volume (K Unit) Forecast, by Application 2020 & 2033
- Table 21: Rest of North America Air Filtration Market Revenue (Million) Forecast, by Application 2020 & 2033
- Table 22: Rest of North America Air Filtration Market Volume (K Unit) Forecast, by Application 2020 & 2033
- Table 23: Global Air Filtration Market Revenue Million Forecast, by Filtration Technology 2020 & 2033
- Table 24: Global Air Filtration Market Volume K Unit Forecast, by Filtration Technology 2020 & 2033
- Table 25: Global Air Filtration Market Revenue Million Forecast, by Type 2020 & 2033
- Table 26: Global Air Filtration Market Volume K Unit Forecast, by Type 2020 & 2033
- Table 27: Global Air Filtration Market Revenue Million Forecast, by End User 2020 & 2033
- Table 28: Global Air Filtration Market Volume K Unit Forecast, by End User 2020 & 2033
- Table 29: Global Air Filtration Market Revenue Million Forecast, by Country 2020 & 2033
- Table 30: Global Air Filtration Market Volume K Unit Forecast, by Country 2020 & 2033
- Table 31: United Kingdom Air Filtration Market Revenue (Million) Forecast, by Application 2020 & 2033
- Table 32: United Kingdom Air Filtration Market Volume (K Unit) Forecast, by Application 2020 & 2033
- Table 33: Germany Air Filtration Market Revenue (Million) Forecast, by Application 2020 & 2033
- Table 34: Germany Air Filtration Market Volume (K Unit) Forecast, by Application 2020 & 2033
- Table 35: Spain Air Filtration Market Revenue (Million) Forecast, by Application 2020 & 2033
- Table 36: Spain Air Filtration Market Volume (K Unit) Forecast, by Application 2020 & 2033
- Table 37: NORDIC Air Filtration Market Revenue (Million) Forecast, by Application 2020 & 2033
- Table 38: NORDIC Air Filtration Market Volume (K Unit) Forecast, by Application 2020 & 2033
- Table 39: Russia Air Filtration Market Revenue (Million) Forecast, by Application 2020 & 2033
- Table 40: Russia Air Filtration Market Volume (K Unit) Forecast, by Application 2020 & 2033
- Table 41: Turkey Air Filtration Market Revenue (Million) Forecast, by Application 2020 & 2033
- Table 42: Turkey Air Filtration Market Volume (K Unit) Forecast, by Application 2020 & 2033
- Table 43: Italy Air Filtration Market Revenue (Million) Forecast, by Application 2020 & 2033
- Table 44: Italy Air Filtration Market Volume (K Unit) Forecast, by Application 2020 & 2033
- Table 45: Rest of Europe Air Filtration Market Revenue (Million) Forecast, by Application 2020 & 2033
- Table 46: Rest of Europe Air Filtration Market Volume (K Unit) Forecast, by Application 2020 & 2033
- Table 47: Global Air Filtration Market Revenue Million Forecast, by Filtration Technology 2020 & 2033
- Table 48: Global Air Filtration Market Volume K Unit Forecast, by Filtration Technology 2020 & 2033
- Table 49: Global Air Filtration Market Revenue Million Forecast, by Type 2020 & 2033
- Table 50: Global Air Filtration Market Volume K Unit Forecast, by Type 2020 & 2033
- Table 51: Global Air Filtration Market Revenue Million Forecast, by End User 2020 & 2033
- Table 52: Global Air Filtration Market Volume K Unit Forecast, by End User 2020 & 2033
- Table 53: Global Air Filtration Market Revenue Million Forecast, by Country 2020 & 2033
- Table 54: Global Air Filtration Market Volume K Unit Forecast, by Country 2020 & 2033
- Table 55: China Air Filtration Market Revenue (Million) Forecast, by Application 2020 & 2033
- Table 56: China Air Filtration Market Volume (K Unit) Forecast, by Application 2020 & 2033
- Table 57: India Air Filtration Market Revenue (Million) Forecast, by Application 2020 & 2033
- Table 58: India Air Filtration Market Volume (K Unit) Forecast, by Application 2020 & 2033
- Table 59: Japan Air Filtration Market Revenue (Million) Forecast, by Application 2020 & 2033
- Table 60: Japan Air Filtration Market Volume (K Unit) Forecast, by Application 2020 & 2033
- Table 61: Malaysia Air Filtration Market Revenue (Million) Forecast, by Application 2020 & 2033
- Table 62: Malaysia Air Filtration Market Volume (K Unit) Forecast, by Application 2020 & 2033
- Table 63: Thailand Air Filtration Market Revenue (Million) Forecast, by Application 2020 & 2033
- Table 64: Thailand Air Filtration Market Volume (K Unit) Forecast, by Application 2020 & 2033
- Table 65: Indonesia Air Filtration Market Revenue (Million) Forecast, by Application 2020 & 2033
- Table 66: Indonesia Air Filtration Market Volume (K Unit) Forecast, by Application 2020 & 2033
- Table 67: Vietnam Air Filtration Market Revenue (Million) Forecast, by Application 2020 & 2033
- Table 68: Vietnam Air Filtration Market Volume (K Unit) Forecast, by Application 2020 & 2033
- Table 69: Rest of Asia Pacific Air Filtration Market Revenue (Million) Forecast, by Application 2020 & 2033
- Table 70: Rest of Asia Pacific Air Filtration Market Volume (K Unit) Forecast, by Application 2020 & 2033
- Table 71: Global Air Filtration Market Revenue Million Forecast, by Filtration Technology 2020 & 2033
- Table 72: Global Air Filtration Market Volume K Unit Forecast, by Filtration Technology 2020 & 2033
- Table 73: Global Air Filtration Market Revenue Million Forecast, by Type 2020 & 2033
- Table 74: Global Air Filtration Market Volume K Unit Forecast, by Type 2020 & 2033
- Table 75: Global Air Filtration Market Revenue Million Forecast, by End User 2020 & 2033
- Table 76: Global Air Filtration Market Volume K Unit Forecast, by End User 2020 & 2033
- Table 77: Global Air Filtration Market Revenue Million Forecast, by Country 2020 & 2033
- Table 78: Global Air Filtration Market Volume K Unit Forecast, by Country 2020 & 2033
- Table 79: Brazil Air Filtration Market Revenue (Million) Forecast, by Application 2020 & 2033
- Table 80: Brazil Air Filtration Market Volume (K Unit) Forecast, by Application 2020 & 2033
- Table 81: Argentina Air Filtration Market Revenue (Million) Forecast, by Application 2020 & 2033
- Table 82: Argentina Air Filtration Market Volume (K Unit) Forecast, by Application 2020 & 2033
- Table 83: Colombia Air Filtration Market Revenue (Million) Forecast, by Application 2020 & 2033
- Table 84: Colombia Air Filtration Market Volume (K Unit) Forecast, by Application 2020 & 2033
- Table 85: Rest of South America Air Filtration Market Revenue (Million) Forecast, by Application 2020 & 2033
- Table 86: Rest of South America Air Filtration Market Volume (K Unit) Forecast, by Application 2020 & 2033
- Table 87: Global Air Filtration Market Revenue Million Forecast, by Filtration Technology 2020 & 2033
- Table 88: Global Air Filtration Market Volume K Unit Forecast, by Filtration Technology 2020 & 2033
- Table 89: Global Air Filtration Market Revenue Million Forecast, by Type 2020 & 2033
- Table 90: Global Air Filtration Market Volume K Unit Forecast, by Type 2020 & 2033
- Table 91: Global Air Filtration Market Revenue Million Forecast, by End User 2020 & 2033
- Table 92: Global Air Filtration Market Volume K Unit Forecast, by End User 2020 & 2033
- Table 93: Global Air Filtration Market Revenue Million Forecast, by Country 2020 & 2033
- Table 94: Global Air Filtration Market Volume K Unit Forecast, by Country 2020 & 2033
- Table 95: United Arab Emirates Air Filtration Market Revenue (Million) Forecast, by Application 2020 & 2033
- Table 96: United Arab Emirates Air Filtration Market Volume (K Unit) Forecast, by Application 2020 & 2033
- Table 97: Saudi Arabia Air Filtration Market Revenue (Million) Forecast, by Application 2020 & 2033
- Table 98: Saudi Arabia Air Filtration Market Volume (K Unit) Forecast, by Application 2020 & 2033
- Table 99: South Africa Air Filtration Market Revenue (Million) Forecast, by Application 2020 & 2033
- Table 100: South Africa Air Filtration Market Volume (K Unit) Forecast, by Application 2020 & 2033
- Table 101: Nigeria Air Filtration Market Revenue (Million) Forecast, by Application 2020 & 2033
- Table 102: Nigeria Air Filtration Market Volume (K Unit) Forecast, by Application 2020 & 2033
- Table 103: Qatar Air Filtration Market Revenue (Million) Forecast, by Application 2020 & 2033
- Table 104: Qatar Air Filtration Market Volume (K Unit) Forecast, by Application 2020 & 2033
- Table 105: Egypt Air Filtration Market Revenue (Million) Forecast, by Application 2020 & 2033
- Table 106: Egypt Air Filtration Market Volume (K Unit) Forecast, by Application 2020 & 2033
- Table 107: Rest of Middle East and Africa Air Filtration Market Revenue (Million) Forecast, by Application 2020 & 2033
- Table 108: Rest of Middle East and Africa Air Filtration Market Volume (K Unit) Forecast, by Application 2020 & 2033
Frequently Asked Questions
1. What is the projected Compound Annual Growth Rate (CAGR) of the Air Filtration Market?
The projected CAGR is approximately 7.00%.
2. Which companies are prominent players in the Air Filtration Market?
Key companies in the market include Daikin Honeywell , Xiaomi, Coway, 3M .
3. What are the main segments of the Air Filtration Market?
The market segments include Filtration Technology, Type, End User.
4. Can you provide details about the market size?
The market size is estimated to be USD 16.83 Million as of 2022.
5. What are some drivers contributing to market growth?
4.; Upcoming New Renewable Projects in the Country4.; Expansions of Transmission and Distribution Network.
6. What are the notable trends driving market growth?
The High-efficiency Particulate Air (HEPA) Segment is Expected to Dominate the Market.
7. Are there any restraints impacting market growth?
4.; Lack of Private Participation in the Country's Power Sector.
8. Can you provide examples of recent developments in the market?
March 2023: Xiaomi Corp. announced the launch of the MIJIA full-effect air purifier for the Chinese market. The equipment can produce 12,500 liters of air volume per minute, with an estimated virus removal capacity of approximately 99%. Such an enhanced product feature is expected to increase the sale of air purifiers during the forecast period.
9. What pricing options are available for accessing the report?
Pricing options include single-user, multi-user, and enterprise licenses priced at USD 4750, USD 5250, and USD 8750 respectively.
10. Is the market size provided in terms of value or volume?
The market size is provided in terms of value, measured in Million and volume, measured in K Unit.
11. Are there any specific market keywords associated with the report?
Yes, the market keyword associated with the report is "Air Filtration Market," which aids in identifying and referencing the specific market segment covered.
12. How do I determine which pricing option suits my needs best?
The pricing options vary based on user requirements and access needs. Individual users may opt for single-user licenses, while businesses requiring broader access may choose multi-user or enterprise licenses for cost-effective access to the report.
13. Are there any additional resources or data provided in the Air Filtration Market report?
While the report offers comprehensive insights, it's advisable to review the specific contents or supplementary materials provided to ascertain if additional resources or data are available.
14. How can I stay updated on further developments or reports in the Air Filtration Market?
To stay informed about further developments, trends, and reports in the Air Filtration Market, consider subscribing to industry newsletters, following relevant companies and organizations, or regularly checking reputable industry news sources and publications.
Methodology
Step 1 - Identification of Relevant Samples Size from Population Database


Step 2 - Approaches for Defining Global Market Size (Value, Volume* & Price*)

Note*: In applicable scenarios
Step 3 - Data Sources
Primary Research
- Web Analytics
- Survey Reports
- Research Institute
- Latest Research Reports
- Opinion Leaders
Secondary Research
- Annual Reports
- White Paper
- Latest Press Release
- Industry Association
- Paid Database
- Investor Presentations

Step 4 - Data Triangulation
Involves using different sources of information in order to increase the validity of a study
These sources are likely to be stakeholders in a program - participants, other researchers, program staff, other community members, and so on.
Then we put all data in single framework & apply various statistical tools to find out the dynamic on the market.
During the analysis stage, feedback from the stakeholder groups would be compared to determine areas of agreement as well as areas of divergence

