

Key Insights
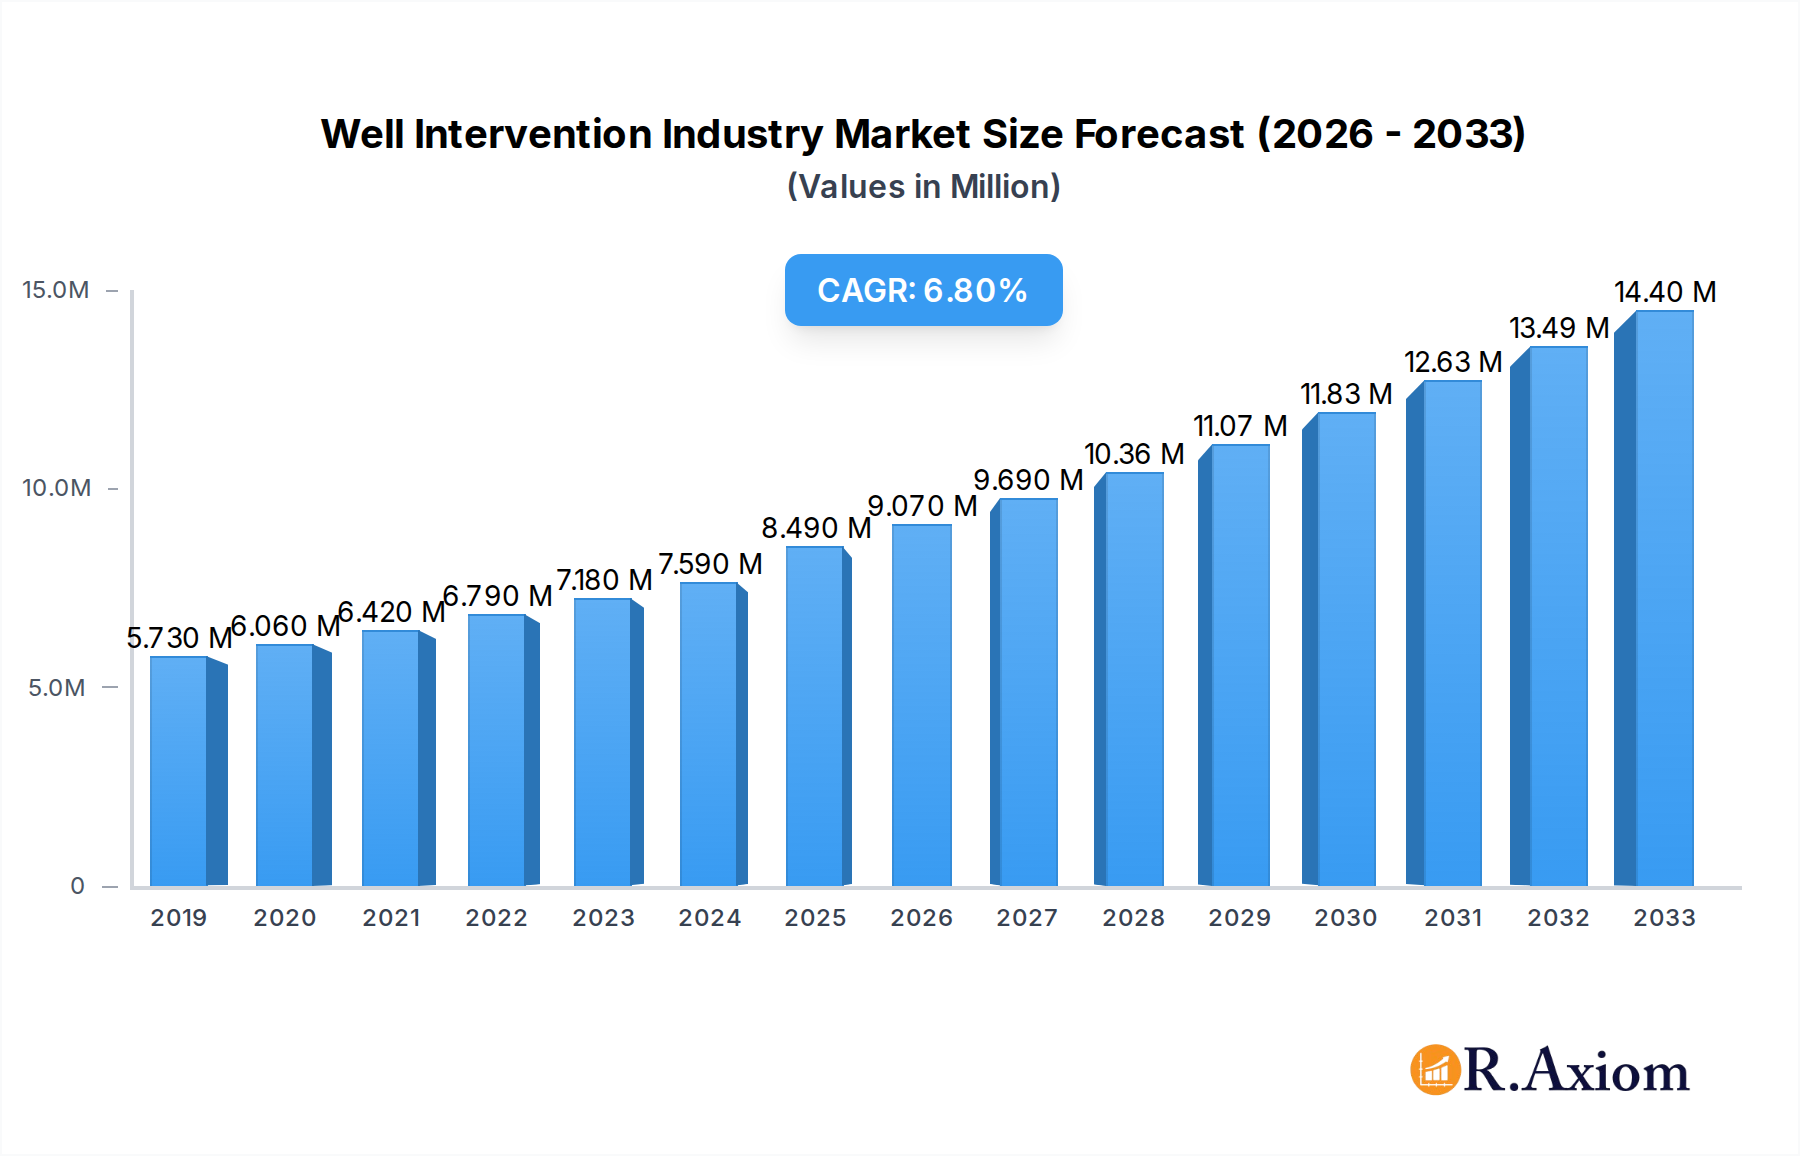
The global Well Intervention Market is projected to experience robust growth, reaching an estimated USD 8.49 Million by 2025, driven by a Compound Annual Growth Rate (CAGR) of 6.80%. This expansion is fueled by increasing demand for enhanced oil recovery (EOR) techniques, particularly in mature fields, where well intervention services are crucial for optimizing production and extending field life. The need to maintain operational efficiency and reduce downtime in existing oil and gas wells, coupled with the strategic imperative to maximize hydrocarbon recovery from dwindling reserves, are key demand catalysts. Furthermore, advancements in intervention technologies, including sophisticated logging tools, advanced artificial lift systems, and innovative fishing and milling techniques, are enhancing the effectiveness and economic viability of these services, thereby propelling market expansion.

Well Intervention Industry Market Size (In Million)
The market's growth trajectory is also shaped by significant trends, including the increasing adoption of digital technologies and automation in well intervention operations to improve safety, efficiency, and data analysis. Furthermore, the growing emphasis on environmental regulations and the need for cost-effective production solutions are influencing the adoption of specialized intervention techniques. While the market benefits from strong drivers, it also faces certain restraints. Fluctuations in global oil prices can impact exploration and production budgets, consequently affecting the demand for well intervention services. Additionally, the complexity and inherent risks associated with some intervention operations, along with the specialized expertise required, can pose challenges. However, the continuous innovation in technology and the strategic importance of maximizing production from existing assets are expected to outweigh these restraints, ensuring sustained market growth.
Well Intervention Industry Company Market Share
This comprehensive report delves into the dynamic Well Intervention Industry, offering in-depth analysis and strategic insights for stakeholders. Covering the study period of 2019–2033, with a base year of 2025 and a forecast period from 2025–2033, this report provides an authoritative view of market trends, competitive landscapes, and future opportunities. Our research methodology encompasses historical data from 2019–2024 to establish a robust foundation for projections. This report is designed for oil and gas operators, service providers, investors, and policymakers seeking to navigate the complexities and capitalize on the growth potential of the global well intervention market, projected to reach multi-million dollar valuations.
Well Intervention Industry Market Concentration & Innovation
The Well Intervention Industry exhibits a moderate to high market concentration, with a few dominant players holding significant market share. Key companies like Schlumberger Limited, Halliburton Company, Baker Hughes Company, and China Oilfield Services Ltd are at the forefront, driving innovation and shaping market dynamics. Innovation in well intervention is primarily fueled by the continuous need for enhanced oil recovery (EOR), mature field life extension, and cost-effective plugging and abandonment (P&A) solutions. Advancements in subsea technologies, artificial lift systems, and data analytics are crucial innovation drivers. Regulatory frameworks, particularly concerning environmental protection and safety standards, play a pivotal role in shaping intervention strategies and product development. The threat of product substitutes, such as advanced drilling techniques that reduce the need for interventions, is present but largely countered by the cost-effectiveness and necessity of interventions in existing wells. End-user trends are shifting towards greener and more efficient intervention methods, with a growing emphasis on minimizing environmental impact and maximizing production from existing reserves. Mergers and acquisitions (M&A) activities, with deal values often in the hundreds of millions, are prevalent as companies seek to consolidate market share, acquire new technologies, and expand their service portfolios. For instance, strategic acquisitions in areas like advanced diagnostics and digital well management are anticipated to reshape the competitive landscape in the coming years.
Well Intervention Industry Industry Trends & Insights
The Well Intervention Industry is poised for robust growth driven by several critical trends and insights. A significant growth driver is the increasing demand for energy coupled with the maturation of existing oil and gas fields, necessitating interventions to sustain or enhance production. The Compound Annual Growth Rate (CAGR) for the well intervention market is projected to be around 5.2% during the forecast period, reflecting this sustained demand. Technological disruptions are at the heart of industry evolution, with advancements in digitalization, automation, and artificial intelligence (AI) revolutionizing intervention operations. Remote monitoring, predictive maintenance, and real-time data analysis are becoming standard, leading to optimized well performance and reduced downtime. The integration of these technologies is estimated to increase operational efficiency by up to 15%. Consumer preferences are increasingly leaning towards sustainable and environmentally responsible practices. This translates into a demand for interventions that minimize environmental footprint, such as riserless light well intervention (RLWI) techniques. Companies are investing heavily in developing eco-friendly solutions, including advanced chemical treatments and biodegradable materials. Competitive dynamics are intensifying, with established players expanding their service offerings and new entrants focusing on niche technological solutions. The market penetration of specialized intervention services, such as advanced coiled tubing operations and intelligent completions, is steadily increasing. Furthermore, the global push towards energy security and the continued reliance on hydrocarbons, albeit with a growing focus on transitioning to cleaner energy sources, ensures a persistent need for efficient well management. The projected market size for well intervention services is expected to surpass $50 Billion by 2033, underscoring the sector's significant economic importance.
Dominant Markets & Segments in Well Intervention Industry
The Well Intervention Industry is segmented by Location of Deployment, primarily categorized into Onshore and Offshore. The Offshore segment is anticipated to dominate the market in terms of revenue and growth potential, driven by the inherent complexities and higher expenditure associated with offshore operations. Factors contributing to offshore dominance include the increasing number of deepwater and ultra-deepwater fields coming online, requiring specialized intervention techniques and high-value services. Economic policies in major oil-producing nations, which often incentivize the maximization of offshore hydrocarbon recovery, further bolster this segment.
- Key Drivers for Offshore Dominance:
- Complex Reservoir Characteristics: Offshore fields often present more challenging geological formations and reservoir conditions, necessitating advanced intervention solutions.
- Aging Infrastructure: Many mature offshore fields require frequent interventions to maintain production levels, leading to consistent demand for services.
- Technological Advancements: Significant investment in subsea technology and remotely operated vehicles (ROVs) supports complex offshore interventions.
- High Production Value: Offshore wells typically yield higher volumes of hydrocarbons, justifying the substantial investment in intervention services.
- Regulatory Incentives: Governments often provide tax incentives and production quotas that encourage the sustained operation of offshore assets.
The Onshore segment, while smaller in overall market share compared to offshore, remains a vital and growing component of the well intervention market. The sheer volume of onshore wells globally, coupled with the need to optimize production from unconventional resources like shale gas and tight oil, ensures sustained demand. Infrastructure development in emerging oil-producing regions and the focus on maximizing recovery from existing onshore fields are key growth drivers for this segment. The economic policies in countries with extensive onshore reserves, such as the United States and Russia, are crucial for this segment's performance.
- Key Drivers for Onshore Growth:
- Vast Number of Wells: The extensive network of onshore wells globally provides a continuous demand for routine and specialized interventions.
- Unconventional Resource Development: The rise of hydraulic fracturing and horizontal drilling in shale plays has created new avenues for well intervention services.
- Cost-Effectiveness: Onshore interventions are generally less capital-intensive than offshore operations, making them more accessible for a wider range of operators.
- Mature Field Revitalization: Many mature onshore fields require interventions to extend their productive life and improve recovery rates.
Geographically, North America and the Middle East are expected to be leading regions due to their significant hydrocarbon reserves and ongoing exploration and production activities. The adoption of advanced technologies and the need for efficient production optimization will continue to drive demand across both onshore and offshore segments globally.
Well Intervention Industry Product Developments
Product developments in the Well Intervention Industry are intensely focused on enhancing efficiency, safety, and environmental sustainability. Innovations include advanced intelligent completion systems that allow for remote control and monitoring of well performance, significantly reducing the need for manual interventions. Furthermore, the development of specialized intervention tools for unconventional wells, such as enhanced fracturing sleeves and dissolvable frac plugs, is gaining traction. The competitive advantage lies in providing solutions that minimize non-productive time (NPT), reduce operational costs, and improve overall well productivity. Digitalization plays a crucial role, with the integration of AI and machine learning enabling predictive maintenance and real-time operational adjustments.
Report Scope & Segmentation Analysis
This report meticulously analyzes the Well Intervention Industry across its key segmentation. The primary segmentation considered is Location of Deployment, encompassing Onshore and Offshore operations.
Onshore Segment: This segment covers well intervention activities conducted on land-based oil and gas wells. It is projected to witness a CAGR of approximately 4.8% during the forecast period, with an estimated market size of $18 Billion by 2033. Key growth drivers include the optimization of unconventional resource production and the revitalization of mature onshore fields. Competitive dynamics in this segment are characterized by a blend of large service providers and specialized onshore specialists.
Offshore Segment: This segment encompasses well intervention services for offshore oil and gas wells, including subsea and platform-based operations. The offshore segment is expected to experience a CAGR of around 5.5%, with an estimated market size reaching $32 Billion by 2033. Dominance is driven by deepwater exploration, aging infrastructure requiring extensive maintenance, and the adoption of advanced subsea intervention technologies. Growth projections are robust, supported by significant capital investments in offshore exploration and production.
Key Drivers of Well Intervention Industry Growth
The Well Intervention Industry is propelled by several powerful growth drivers. The persistent global demand for energy, coupled with the aging of mature oil and gas fields worldwide, necessitates interventions to sustain and enhance production. Technological advancements, particularly in digitalization, AI, and robotics, are enabling more efficient, cost-effective, and safer intervention operations, leading to improved reservoir management and extended field life. Furthermore, increasing investments in unconventional resource development, such as shale oil and gas, require specialized intervention techniques to optimize extraction. Regulatory frameworks that encourage production optimization and extend the economic viability of existing fields also act as significant catalysts.
Challenges in the Well Intervention Industry Sector
Despite its growth prospects, the Well Intervention Industry Sector faces several challenges. Strict environmental regulations and the growing emphasis on sustainability can increase compliance costs and necessitate the adoption of more complex, albeit environmentally friendly, intervention methods. Fluctuations in oil and gas prices can impact exploration and production budgets, indirectly affecting demand for intervention services. Supply chain disruptions and the availability of skilled labor also pose significant hurdles, potentially leading to project delays and increased operational costs. The competitive landscape, characterized by intense price competition, can also pressure profit margins for service providers.
Emerging Opportunities in Well Intervention Industry
The Well Intervention Industry presents numerous emerging opportunities. The increasing focus on extending the life of existing oil and gas assets offers a substantial market for mature field intervention and enhanced oil recovery (EOR) services. The development of advanced digital solutions, including AI-powered predictive analytics and remote monitoring systems, presents opportunities for service providers to offer value-added services and improve operational efficiency. Furthermore, the growing demand for environmentally friendly intervention techniques, such as riserless light well intervention (RLWI), creates new market niches. The global energy transition also presents opportunities for well intervention companies to pivot their expertise towards geothermal energy and carbon capture utilization and storage (CCUS) projects, leveraging their knowledge of subsurface operations.
Leading Players in the Well Intervention Industry Market
- Schlumberger Limited
- Halliburton Company
- Baker Hughes Company
- China Oilfield Services Ltd
- Weatherford International Ltd
- Vallourec SA
- National Oilwell Varco Inc
- Scientific Drilling International Inc
Key Developments in Well Intervention Industry Industry
- May 2023: TechnipFMC secured a contract from Equinor to provide riserless light well intervention (RLWI) services on the Norwegian Continental Shelf. This contract, encompassing production enhancement, production data, and pre-plug-and-abandonment services, is set to run from 2024 to 2025, with options for three subsequent annual extensions, highlighting the growing demand for efficient RLWI solutions.
- March 2023: Petroleum Safety Authority Norway (PSA) granted consent to Norske Shell for the utilization of the Island Constructor vessel for well intervention operations on the Knarr and Gaupe fields, underscoring ongoing activity and regulatory oversight in the North Sea region.
Strategic Outlook for Well Intervention Industry Market
The Well Intervention Industry Market is projected for continued growth, driven by the global imperative to meet energy demands while optimizing existing hydrocarbon reserves. The strategic focus for market participants will be on leveraging technological advancements, particularly in digitalization and automation, to enhance operational efficiency and safety. The increasing emphasis on sustainable practices will foster innovation in eco-friendly intervention solutions. Companies that can offer integrated service packages, from diagnostics to execution and data analysis, will be well-positioned for success. Furthermore, exploring opportunities in emerging markets and adapting to evolving regulatory landscapes will be critical for long-term growth and profitability, ensuring a robust future for this vital sector of the energy industry.
Well Intervention Industry Segmentation
-
1. Location of Deployment
- 1.1. Onshore
- 1.2. Offshore
Well Intervention Industry Segmentation By Geography
-
1. North America
- 1.1. United States of America
- 1.2. Canada
- 1.3. Rest of the North America
-
2. Europe
- 2.1. United Kingdom
- 2.2. France
- 2.3. Germany
- 2.4. Italy
- 2.5. Rest of the Europe
-
3. Asia Pacific
- 3.1. China
- 3.2. India
- 3.3. South Korea
- 3.4. Rest of the Asia Pacific
-
4. South America
- 4.1. Brazil
- 4.2. Argentina
- 4.3. Rest of the South America
-
5. Middle East and Africa
- 5.1. United Arab Emirates
- 5.2. Saudi Arabia
- 5.3. Rest of the Middle East and Africa
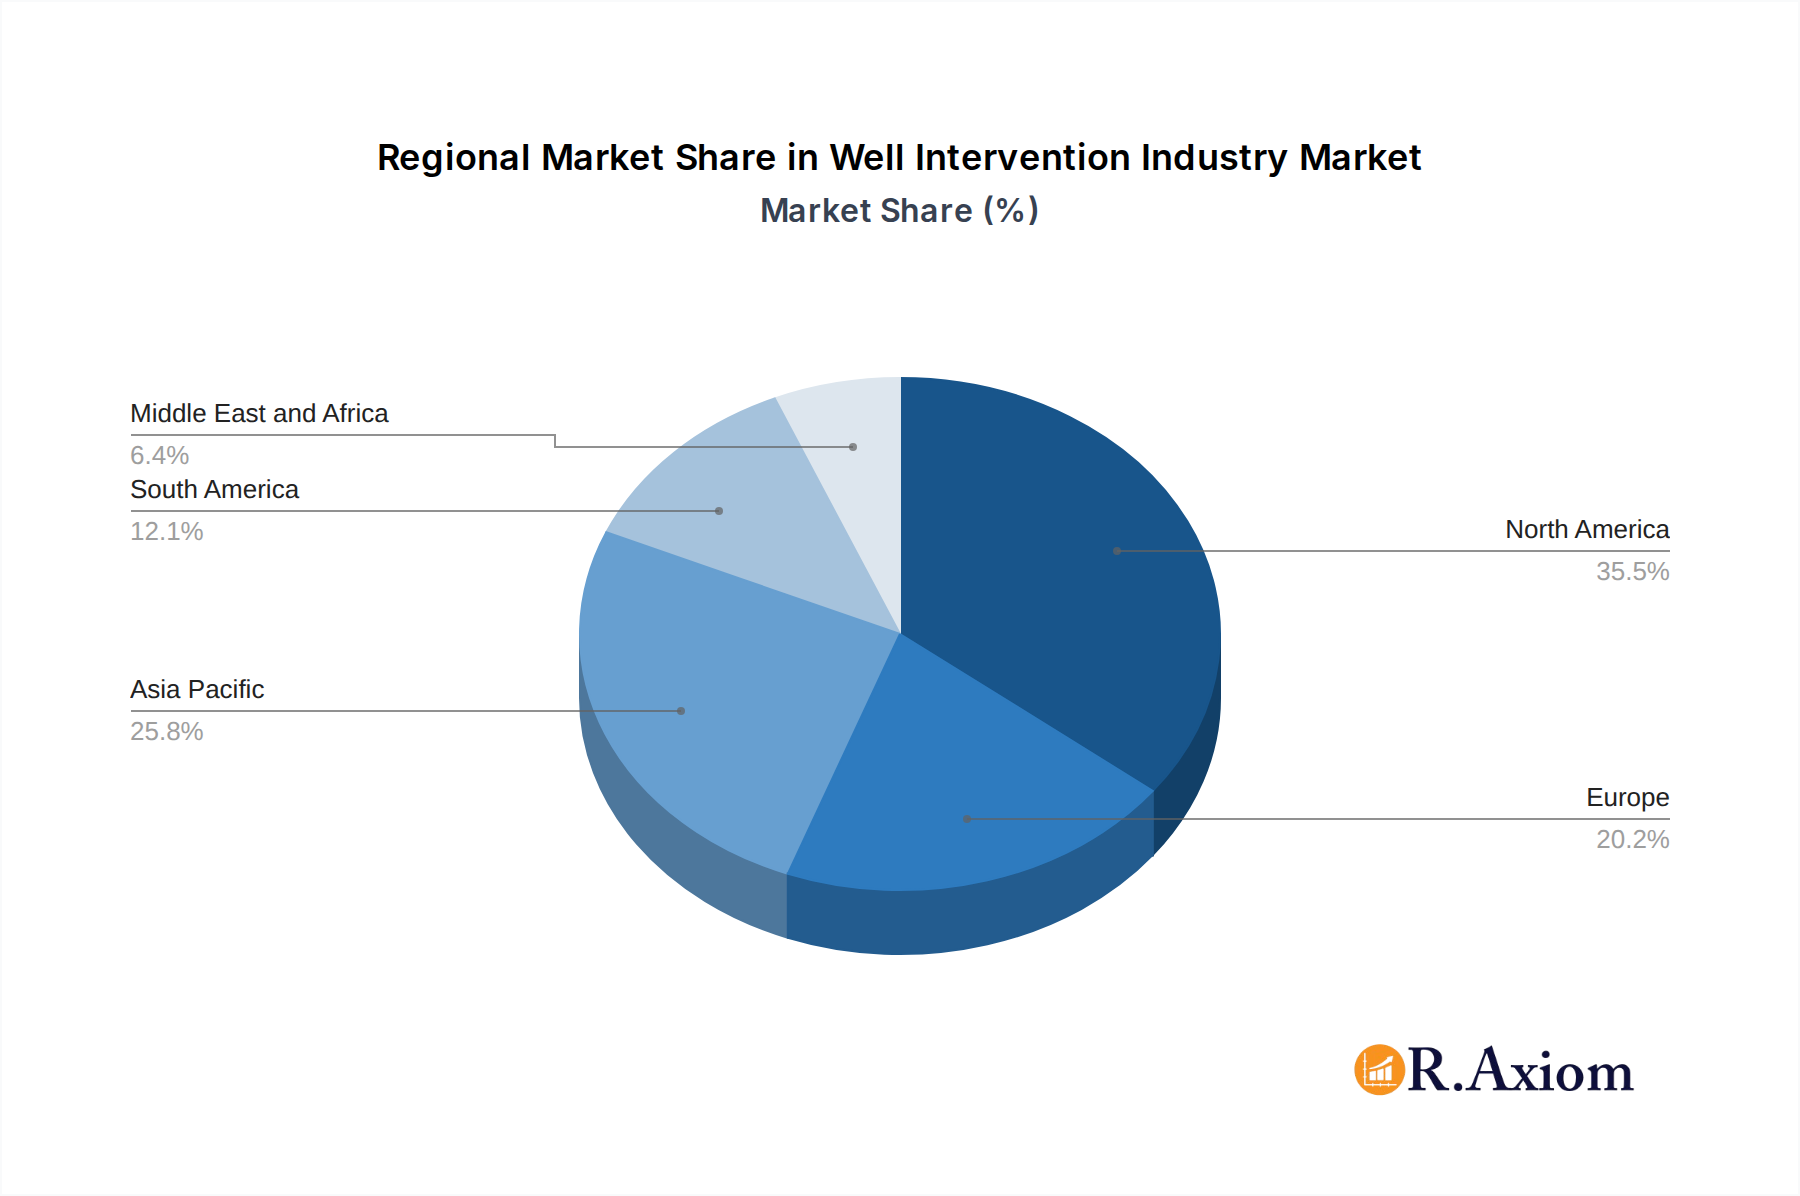
Well Intervention Industry Regional Market Share
Geographic Coverage of Well Intervention Industry
Well Intervention Industry REPORT HIGHLIGHTS
| Aspects | Details |
|---|---|
| Study Period | 2020-2034 |
| Base Year | 2025 |
| Estimated Year | 2026 |
| Forecast Period | 2026-2034 |
| Historical Period | 2020-2025 |
| Growth Rate | CAGR of 6.80% from 2020-2034 |
| Segmentation |
|
Table of Contents
- 1. Introduction
- 1.1. Research Scope
- 1.2. Market Segmentation
- 1.3. Research Objective
- 1.4. Definitions and Assumptions
- 2. Executive Summary
- 2.1. Market Snapshot
- 3. Market Dynamics
- 3.1. Market Drivers
- 3.2. Market Restrains
- 3.3. Market Trends
- 3.4. Market Opportunities
- 4. Market Factor Analysis
- 4.1. Porters Five Forces
- 4.1.1. Bargaining Power of Suppliers
- 4.1.2. Bargaining Power of Buyers
- 4.1.3. Threat of New Entrants
- 4.1.4. Threat of Substitutes
- 4.1.5. Competitive Rivalry
- 4.2. PESTEL analysis
- 4.3. BCG Analysis
- 4.3.1. Stars (High Growth, High Market Share)
- 4.3.2. Cash Cows (Low Growth, High Market Share)
- 4.3.3. Question Mark (High Growth, Low Market Share)
- 4.3.4. Dogs (Low Growth, Low Market Share)
- 4.4. Ansoff Matrix Analysis
- 4.5. Supply Chain Analysis
- 4.6. Regulatory Landscape
- 4.7. Current Market Potential and Opportunity Assessment (TAM–SAM–SOM Framework)
- 4.8. RAX Analyst Note
- 4.1. Porters Five Forces
- 5. Market Analysis, Insights and Forecast 2021-2033
- 5.1. Market Analysis, Insights and Forecast - by Location of Deployment
- 5.1.1. Onshore
- 5.1.2. Offshore
- 5.2. Market Analysis, Insights and Forecast - by Region
- 5.2.1. North America
- 5.2.2. Europe
- 5.2.3. Asia Pacific
- 5.2.4. South America
- 5.2.5. Middle East and Africa
- 5.1. Market Analysis, Insights and Forecast - by Location of Deployment
- 6. Global Well Intervention Industry Analysis, Insights and Forecast, 2021-2033
- 6.1. Market Analysis, Insights and Forecast - by Location of Deployment
- 6.1.1. Onshore
- 6.1.2. Offshore
- 6.1. Market Analysis, Insights and Forecast - by Location of Deployment
- 7. North America Well Intervention Industry Analysis, Insights and Forecast, 2020-2032
- 7.1. Market Analysis, Insights and Forecast - by Location of Deployment
- 7.1.1. Onshore
- 7.1.2. Offshore
- 7.1. Market Analysis, Insights and Forecast - by Location of Deployment
- 8. Europe Well Intervention Industry Analysis, Insights and Forecast, 2020-2032
- 8.1. Market Analysis, Insights and Forecast - by Location of Deployment
- 8.1.1. Onshore
- 8.1.2. Offshore
- 8.1. Market Analysis, Insights and Forecast - by Location of Deployment
- 9. Asia Pacific Well Intervention Industry Analysis, Insights and Forecast, 2020-2032
- 9.1. Market Analysis, Insights and Forecast - by Location of Deployment
- 9.1.1. Onshore
- 9.1.2. Offshore
- 9.1. Market Analysis, Insights and Forecast - by Location of Deployment
- 10. South America Well Intervention Industry Analysis, Insights and Forecast, 2020-2032
- 10.1. Market Analysis, Insights and Forecast - by Location of Deployment
- 10.1.1. Onshore
- 10.1.2. Offshore
- 10.1. Market Analysis, Insights and Forecast - by Location of Deployment
- 11. Middle East and Africa Well Intervention Industry Analysis, Insights and Forecast, 2020-2032
- 11.1. Market Analysis, Insights and Forecast - by Location of Deployment
- 11.1.1. Onshore
- 11.1.2. Offshore
- 11.1. Market Analysis, Insights and Forecast - by Location of Deployment
- 12. Competitive Analysis
- 12.1. Company Profiles
- 12.1.1 China Oilfield Services Ltd
- 12.1.1.1. Company Overview
- 12.1.1.2. Products
- 12.1.1.3. Company Financials
- 12.1.1.4. SWOT Analysis
- 12.1.2 Vallourec SA
- 12.1.2.1. Company Overview
- 12.1.2.2. Products
- 12.1.2.3. Company Financials
- 12.1.2.4. SWOT Analysis
- 12.1.3 National Oilwell Varco Inc
- 12.1.3.1. Company Overview
- 12.1.3.2. Products
- 12.1.3.3. Company Financials
- 12.1.3.4. SWOT Analysis
- 12.1.4 Baker Hughes Company
- 12.1.4.1. Company Overview
- 12.1.4.2. Products
- 12.1.4.3. Company Financials
- 12.1.4.4. SWOT Analysis
- 12.1.5 Halliburton Company
- 12.1.5.1. Company Overview
- 12.1.5.2. Products
- 12.1.5.3. Company Financials
- 12.1.5.4. SWOT Analysis
- 12.1.6 Weatherford International Ltd
- 12.1.6.1. Company Overview
- 12.1.6.2. Products
- 12.1.6.3. Company Financials
- 12.1.6.4. SWOT Analysis
- 12.1.7 Schlumberger Limited
- 12.1.7.1. Company Overview
- 12.1.7.2. Products
- 12.1.7.3. Company Financials
- 12.1.7.4. SWOT Analysis
- 12.1.8 Scientific Drilling International Inc
- 12.1.8.1. Company Overview
- 12.1.8.2. Products
- 12.1.8.3. Company Financials
- 12.1.8.4. SWOT Analysis
- 12.1.1 China Oilfield Services Ltd
- 12.2. Market Entropy
- 12.2.1 Company's Key Areas Served
- 12.2.2 Recent Developments
- 12.3. Company Market Share Analysis 2025
- 12.3.1 Top 5 Companies Market Share Analysis
- 12.3.2 Top 3 Companies Market Share Analysis
- 12.4. List of Potential Customers
- 13. Research Methodology
List of Figures
- Figure 1: Global Well Intervention Industry Revenue Breakdown (Million, %) by Region 2025 & 2033
- Figure 2: North America Well Intervention Industry Revenue (Million), by Location of Deployment 2025 & 2033
- Figure 3: North America Well Intervention Industry Revenue Share (%), by Location of Deployment 2025 & 2033
- Figure 4: North America Well Intervention Industry Revenue (Million), by Country 2025 & 2033
- Figure 5: North America Well Intervention Industry Revenue Share (%), by Country 2025 & 2033
- Figure 6: Europe Well Intervention Industry Revenue (Million), by Location of Deployment 2025 & 2033
- Figure 7: Europe Well Intervention Industry Revenue Share (%), by Location of Deployment 2025 & 2033
- Figure 8: Europe Well Intervention Industry Revenue (Million), by Country 2025 & 2033
- Figure 9: Europe Well Intervention Industry Revenue Share (%), by Country 2025 & 2033
- Figure 10: Asia Pacific Well Intervention Industry Revenue (Million), by Location of Deployment 2025 & 2033
- Figure 11: Asia Pacific Well Intervention Industry Revenue Share (%), by Location of Deployment 2025 & 2033
- Figure 12: Asia Pacific Well Intervention Industry Revenue (Million), by Country 2025 & 2033
- Figure 13: Asia Pacific Well Intervention Industry Revenue Share (%), by Country 2025 & 2033
- Figure 14: South America Well Intervention Industry Revenue (Million), by Location of Deployment 2025 & 2033
- Figure 15: South America Well Intervention Industry Revenue Share (%), by Location of Deployment 2025 & 2033
- Figure 16: South America Well Intervention Industry Revenue (Million), by Country 2025 & 2033
- Figure 17: South America Well Intervention Industry Revenue Share (%), by Country 2025 & 2033
- Figure 18: Middle East and Africa Well Intervention Industry Revenue (Million), by Location of Deployment 2025 & 2033
- Figure 19: Middle East and Africa Well Intervention Industry Revenue Share (%), by Location of Deployment 2025 & 2033
- Figure 20: Middle East and Africa Well Intervention Industry Revenue (Million), by Country 2025 & 2033
- Figure 21: Middle East and Africa Well Intervention Industry Revenue Share (%), by Country 2025 & 2033
List of Tables
- Table 1: Global Well Intervention Industry Revenue Million Forecast, by Location of Deployment 2020 & 2033
- Table 2: Global Well Intervention Industry Revenue Million Forecast, by Region 2020 & 2033
- Table 3: Global Well Intervention Industry Revenue Million Forecast, by Location of Deployment 2020 & 2033
- Table 4: Global Well Intervention Industry Revenue Million Forecast, by Country 2020 & 2033
- Table 5: United States of America Well Intervention Industry Revenue (Million) Forecast, by Application 2020 & 2033
- Table 6: Canada Well Intervention Industry Revenue (Million) Forecast, by Application 2020 & 2033
- Table 7: Rest of the North America Well Intervention Industry Revenue (Million) Forecast, by Application 2020 & 2033
- Table 8: Global Well Intervention Industry Revenue Million Forecast, by Location of Deployment 2020 & 2033
- Table 9: Global Well Intervention Industry Revenue Million Forecast, by Country 2020 & 2033
- Table 10: United Kingdom Well Intervention Industry Revenue (Million) Forecast, by Application 2020 & 2033
- Table 11: France Well Intervention Industry Revenue (Million) Forecast, by Application 2020 & 2033
- Table 12: Germany Well Intervention Industry Revenue (Million) Forecast, by Application 2020 & 2033
- Table 13: Italy Well Intervention Industry Revenue (Million) Forecast, by Application 2020 & 2033
- Table 14: Rest of the Europe Well Intervention Industry Revenue (Million) Forecast, by Application 2020 & 2033
- Table 15: Global Well Intervention Industry Revenue Million Forecast, by Location of Deployment 2020 & 2033
- Table 16: Global Well Intervention Industry Revenue Million Forecast, by Country 2020 & 2033
- Table 17: China Well Intervention Industry Revenue (Million) Forecast, by Application 2020 & 2033
- Table 18: India Well Intervention Industry Revenue (Million) Forecast, by Application 2020 & 2033
- Table 19: South Korea Well Intervention Industry Revenue (Million) Forecast, by Application 2020 & 2033
- Table 20: Rest of the Asia Pacific Well Intervention Industry Revenue (Million) Forecast, by Application 2020 & 2033
- Table 21: Global Well Intervention Industry Revenue Million Forecast, by Location of Deployment 2020 & 2033
- Table 22: Global Well Intervention Industry Revenue Million Forecast, by Country 2020 & 2033
- Table 23: Brazil Well Intervention Industry Revenue (Million) Forecast, by Application 2020 & 2033
- Table 24: Argentina Well Intervention Industry Revenue (Million) Forecast, by Application 2020 & 2033
- Table 25: Rest of the South America Well Intervention Industry Revenue (Million) Forecast, by Application 2020 & 2033
- Table 26: Global Well Intervention Industry Revenue Million Forecast, by Location of Deployment 2020 & 2033
- Table 27: Global Well Intervention Industry Revenue Million Forecast, by Country 2020 & 2033
- Table 28: United Arab Emirates Well Intervention Industry Revenue (Million) Forecast, by Application 2020 & 2033
- Table 29: Saudi Arabia Well Intervention Industry Revenue (Million) Forecast, by Application 2020 & 2033
- Table 30: Rest of the Middle East and Africa Well Intervention Industry Revenue (Million) Forecast, by Application 2020 & 2033
Frequently Asked Questions
1. What is the projected Compound Annual Growth Rate (CAGR) of the Well Intervention Industry?
The projected CAGR is approximately 6.80%.
2. Which companies are prominent players in the Well Intervention Industry?
Key companies in the market include China Oilfield Services Ltd, Vallourec SA, National Oilwell Varco Inc, Baker Hughes Company, Halliburton Company, Weatherford International Ltd, Schlumberger Limited, Scientific Drilling International Inc.
3. What are the main segments of the Well Intervention Industry?
The market segments include Location of Deployment.
4. Can you provide details about the market size?
The market size is estimated to be USD 8.49 Million as of 2022.
5. What are some drivers contributing to market growth?
4.; Increased Drilling and Completion Activities.
6. What are the notable trends driving market growth?
Offshore Segment to have a Significant Market Share.
7. Are there any restraints impacting market growth?
4.; Volatility of Oil Prices.
8. Can you provide examples of recent developments in the market?
In May 2023, TechnipFMC got a contract from Equinor to provide riserless light well intervention (RLWI) services on the Norwegian Continental Shelf. The contract includes production enhancement, production data, and pre-plug-and-abandonment services with a time bond from 2024 to 2025, with options to extend for the three subsequent years.
9. What pricing options are available for accessing the report?
Pricing options include single-user, multi-user, and enterprise licenses priced at USD 4750, USD 5250, and USD 8750 respectively.
10. Is the market size provided in terms of value or volume?
The market size is provided in terms of value, measured in Million.
11. Are there any specific market keywords associated with the report?
Yes, the market keyword associated with the report is "Well Intervention Industry," which aids in identifying and referencing the specific market segment covered.
12. How do I determine which pricing option suits my needs best?
The pricing options vary based on user requirements and access needs. Individual users may opt for single-user licenses, while businesses requiring broader access may choose multi-user or enterprise licenses for cost-effective access to the report.
13. Are there any additional resources or data provided in the Well Intervention Industry report?
While the report offers comprehensive insights, it's advisable to review the specific contents or supplementary materials provided to ascertain if additional resources or data are available.
14. How can I stay updated on further developments or reports in the Well Intervention Industry?
To stay informed about further developments, trends, and reports in the Well Intervention Industry, consider subscribing to industry newsletters, following relevant companies and organizations, or regularly checking reputable industry news sources and publications.
Methodology
Step 1 - Identification of Relevant Samples Size from Population Database


Step 2 - Approaches for Defining Global Market Size (Value, Volume* & Price*)

Note*: In applicable scenarios
Step 3 - Data Sources
Primary Research
- Web Analytics
- Survey Reports
- Research Institute
- Latest Research Reports
- Opinion Leaders
Secondary Research
- Annual Reports
- White Paper
- Latest Press Release
- Industry Association
- Paid Database
- Investor Presentations

Step 4 - Data Triangulation
Involves using different sources of information in order to increase the validity of a study
These sources are likely to be stakeholders in a program - participants, other researchers, program staff, other community members, and so on.
Then we put all data in single framework & apply various statistical tools to find out the dynamic on the market.
During the analysis stage, feedback from the stakeholder groups would be compared to determine areas of agreement as well as areas of divergence