

Key Insights
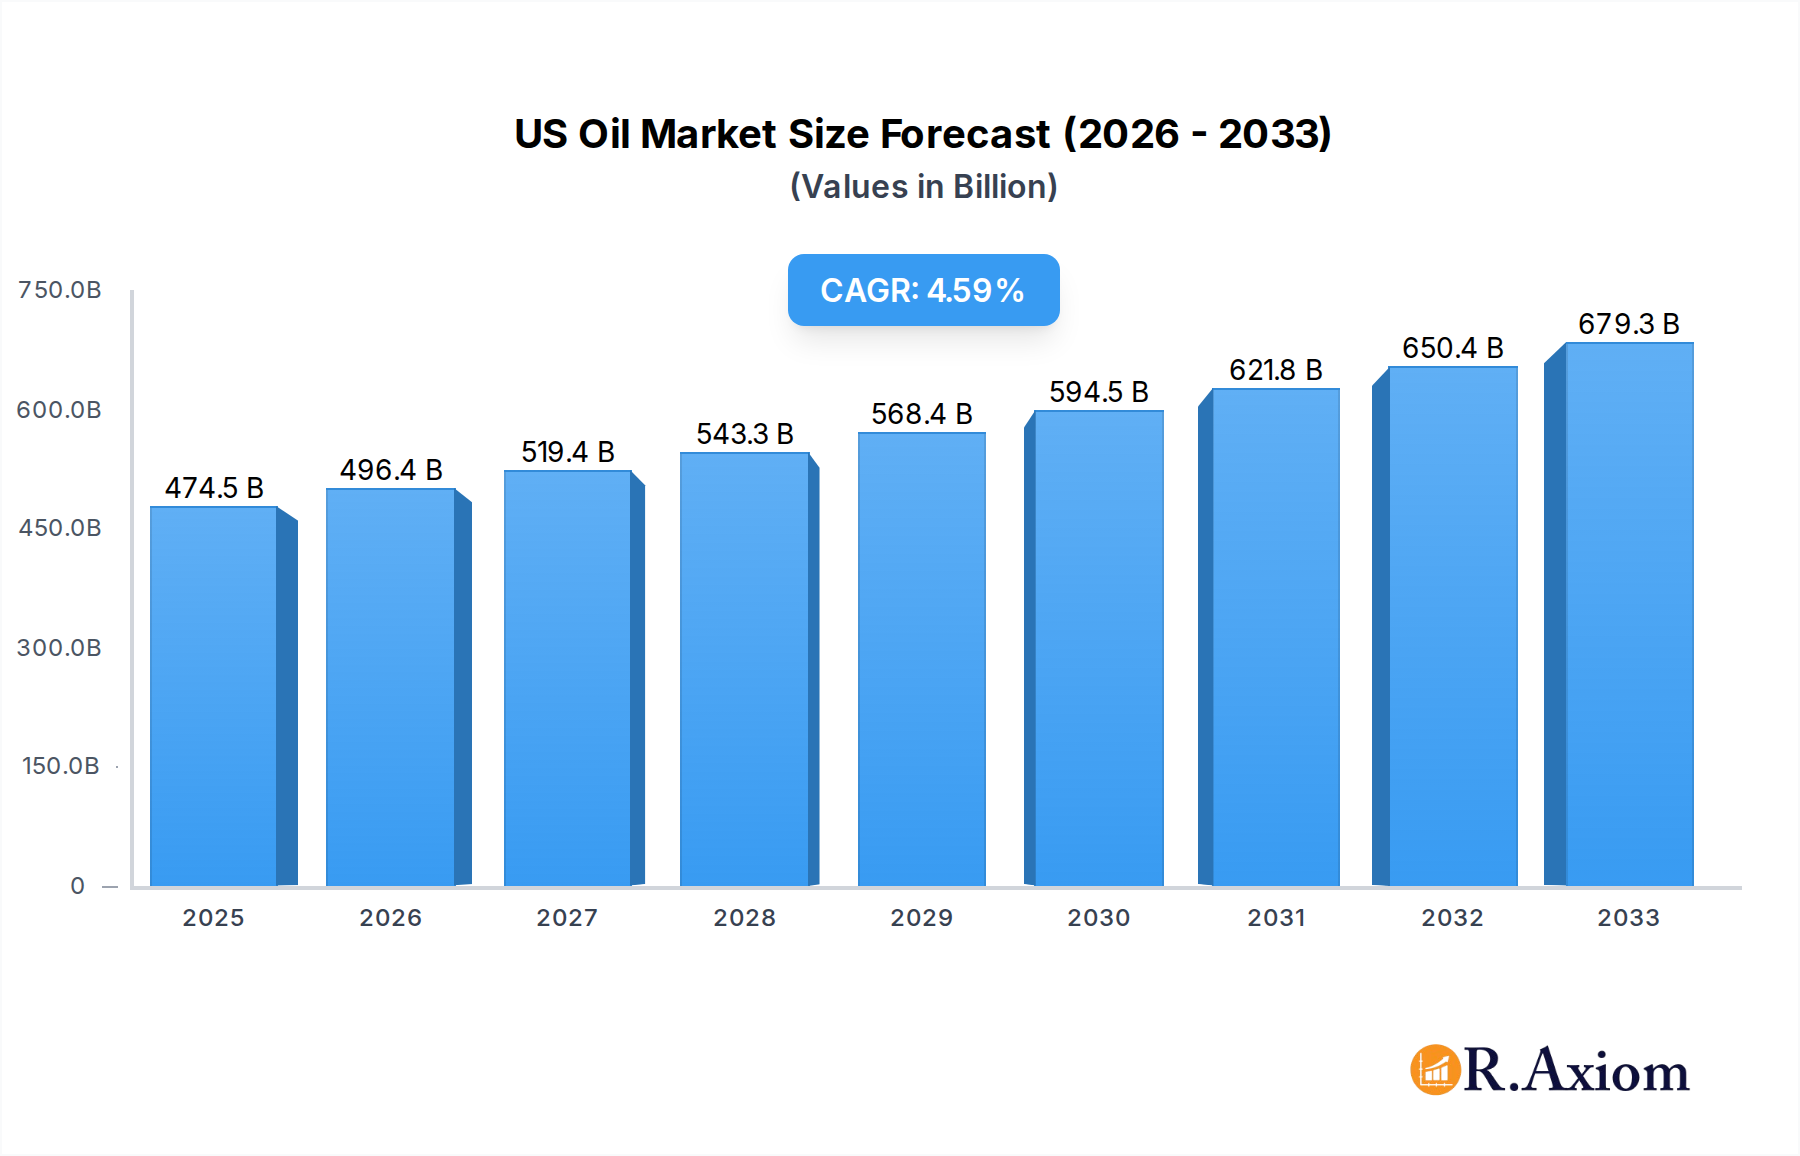
The US Oil & Gas Upstream Market is poised for significant expansion, projected to reach $474.5 billion in 2025, with a compound annual growth rate (CAGR) of 4.7% through 2033. This robust growth trajectory is primarily fueled by increasing global energy demand, particularly from emerging economies, and the ongoing technological advancements in exploration and extraction techniques. The shale revolution continues to be a dominant force, with innovations in hydraulic fracturing and horizontal drilling unlocking vast reserves that were previously inaccessible. Furthermore, strategic investments by major oil and gas corporations in enhanced oil recovery (EOR) methods and the development of unconventional resources will contribute to sustained market expansion. The industry is also witnessing a trend towards greater efficiency and digitalization, with the adoption of AI and IoT technologies to optimize production and reduce operational costs, thereby enhancing profitability.

US Oil & Gas Upstream Market Market Size (In Billion)
Despite the positive outlook, the market faces certain headwinds that could influence its growth pace. Stricter environmental regulations and increasing pressure to transition towards renewable energy sources present a significant restraint. Public perception and investor sentiment are increasingly favoring sustainability, leading to challenges in securing capital for new fossil fuel projects. However, the essential role of oil and gas in the global energy mix, especially for transportation and industrial feedstock, ensures continued demand in the medium term. The market's ability to navigate these challenges will depend on its capacity for innovation, embracing cleaner production technologies, and adapting to evolving geopolitical landscapes and energy policies. Key players like ExxonMobil, Chevron, BP, Shell, Valero Energy, and Saudi Aramco are actively investing in both traditional upstream activities and exploring diversification into lower-carbon solutions to maintain their competitive edge.
US Oil & Gas Upstream Market Company Market Share
US Oil & Gas Upstream Market Market Concentration & Innovation
The US Oil & Gas Upstream Market exhibits moderate to high concentration, with major integrated oil companies and national oil companies dominating a significant portion of the market share. Key players like ExxonMobil, Chevron, BP, Shell, Valero Energy, and Saudi Aramco command substantial production capacities and exploration rights. Innovation in the upstream sector is primarily driven by the pursuit of enhanced recovery techniques, cost optimization through advanced drilling technologies, and the development of digital solutions for operational efficiency. Regulatory frameworks, including environmental standards and permitting processes, significantly influence innovation trajectories and market entry barriers. While direct product substitutes are limited in the context of crude oil and natural gas, advancements in renewable energy technologies present a long-term competitive pressure. End-user trends, particularly the global demand for energy and feedstock, continue to fuel upstream activities. Mergers and acquisitions (M&A) remain a crucial strategy for market consolidation and access to new reserves, with deal values often reaching billions of dollars as companies aim to scale operations and secure future production. For instance, significant M&A activity has been observed in the Permian Basin, impacting market share dynamics and fostering technological adoption to maximize resource extraction.
US Oil & Gas Upstream Market Industry Trends & Insights
The US Oil & Gas Upstream Market is experiencing a dynamic period shaped by evolving global energy demands, technological advancements, and shifting regulatory landscapes. The market's growth is propelled by the insatiable need for crude oil and natural gas as primary energy sources and essential feedstocks for various industries. Technological disruptions are profoundly impacting upstream operations, with the adoption of artificial intelligence (AI), machine learning, and the Internet of Things (IoT) revolutionizing exploration, drilling, and production processes. These technologies enhance efficiency, reduce operational costs, and improve safety. For example, predictive maintenance algorithms are minimizing downtime for critical equipment, and advanced seismic imaging techniques are leading to more accurate resource discovery. Consumer preferences are indirectly influencing the market, with increasing societal and investor pressure for cleaner energy production and a focus on Environmental, Social, and Governance (ESG) factors. This is prompting companies to invest in technologies that reduce emissions and improve their environmental footprint. Competitive dynamics are intensifying, with established giants and agile independent producers vying for market share. The prolific shale plays, particularly the Permian Basin, continue to be a focal point, driving significant production volumes and investment. The market penetration of advanced extraction techniques, such as hydraulic fracturing and horizontal drilling, has been instrumental in unlocking previously inaccessible reserves, leading to a substantial increase in domestic production. The projected Compound Annual Growth Rate (CAGR) for the US Oil & Gas Upstream Market reflects sustained demand, though fluctuations in global commodity prices and geopolitical events introduce inherent volatility. Strategic investments in infrastructure, including pipelines and processing facilities, are crucial for the efficient transport and monetization of extracted resources, further supporting market expansion. The ongoing energy transition also presents a complex trend, as the market balances continued reliance on hydrocarbons with the growing imperative to decarbonize operations and explore lower-carbon energy solutions.
Dominant Markets & Segments in US Oil & Gas Upstream Market
The US Oil & Gas Upstream Market is characterized by distinct dominant regions and segments, driven by resource availability, infrastructure, and economic policies.
Production Analysis:
- Dominant Region: The Permian Basin, spanning West Texas and southeastern New Mexico, stands as the most dominant region for oil and gas production in the United States. Its vast reserves of crude oil and natural gas, coupled with established infrastructure, make it a cornerstone of US energy output.
- Key Drivers:
- Abundant Reserves: The Permian Basin possesses some of the largest and most economically recoverable unconventional oil and gas reserves globally.
- Technological Advancement: Widespread adoption of hydraulic fracturing and horizontal drilling techniques has unlocked vast quantities of previously uneconomical reserves.
- Infrastructure Development: Extensive pipeline networks, processing facilities, and storage terminals facilitate the efficient transport and monetization of produced hydrocarbons.
- Favorable Economic Policies: Historically supportive regulatory environments and tax incentives have encouraged significant investment in the region.
Consumption Analysis:
- Dominant End-Use Sectors: The petrochemical industry and the power generation sector are the largest consumers of crude oil and natural gas, respectively, within the US upstream market.
- Key Drivers:
- Petrochemical Feedstock: Crude oil and natural gas liquids (NGLs) are vital feedstocks for the production of plastics, fertilizers, and a myriad of other chemical products.
- Electricity Generation: Natural gas remains a primary fuel source for electricity generation due to its relatively lower emissions compared to coal and its abundant domestic supply.
- Industrial Processes: Various manufacturing and industrial processes rely on natural gas for heating and as a fuel source.
- Transportation Fuels: Refined products derived from crude oil continue to dominate the transportation sector.
Import Market Analysis (Value & Volume):
- Dominant Import Types: While the US is a net exporter of crude oil and natural gas, imports still play a role, primarily in crude oil to supplement domestic refining needs and in certain specialized natural gas products.
- Key Drivers:
- Refinery Demand: Imports of crude oil are often dictated by the specific grades required by US refineries to optimize their output of refined products.
- Geopolitical Supply Diversification: Maintaining diversified import sources can enhance energy security.
- Regional Supply/Demand Imbalances: Temporary or localized supply shortages can necessitate imports.
Export Market Analysis (Value & Volume):
- Dominant Export Products: Crude oil, liquefied natural gas (LNG), and refined petroleum products are the leading US export categories.
- Key Drivers:
- Shale Revolution: Increased domestic production from shale plays has positioned the US as a major global energy exporter.
- Global Demand for LNG: The growing international demand for cleaner-burning natural gas has fueled the expansion of US LNG export capacity.
- Competitive Pricing: Favorable domestic production costs allow US producers to compete effectively in international markets.
- Strategic Partnerships: Export agreements with allied nations contribute to global energy security.
Price Trend Analysis:
- Dominant Influences: Global supply and demand dynamics, geopolitical events, inventory levels, and macroeconomic factors are the primary drivers of crude oil and natural gas price trends.
- Key Drivers:
- OPEC+ Decisions: Production quotas and policy decisions by the Organization of the Petroleum Exporting Countries and its allies significantly impact global supply.
- Geopolitical Instability: Conflicts and political tensions in major producing regions can disrupt supply chains and lead to price volatility.
- Economic Growth: Global economic expansion fuels energy demand, while downturns can lead to reduced consumption and lower prices.
- Inventory Levels: The amount of crude oil and refined products held in storage provides an indicator of market balance and influences price expectations.
- Weather Patterns: Extreme weather events can impact both supply (e.g., hurricane disruptions) and demand (e.g., heating needs).
US Oil & Gas Upstream Market Product Developments
The US Oil & Gas Upstream Market is witnessing significant product developments centered on enhancing efficiency and reducing environmental impact. Advancements in horizontal drilling and hydraulic fracturing technologies continue to push the boundaries of reserve recovery. Innovations in artificial lift systems, such as advanced electric submersible pumps (ESPs), are optimizing production from mature fields. Furthermore, there's a growing focus on developing and deploying technologies for carbon capture, utilization, and storage (CCUS) to mitigate greenhouse gas emissions. The integration of digital twins and advanced analytics is also leading to the development of more intelligent and responsive operational systems, providing a competitive advantage through optimized resource management and predictive maintenance.
Report Scope & Segmentation Analysis
This report provides a comprehensive analysis of the US Oil & Gas Upstream Market, segmented across key areas for detailed insights. The Production Analysis delves into the volume and value of crude oil and natural gas extracted, examining trends by basin and formation. Consumption Analysis focuses on the demand from various end-use sectors, including petrochemicals and power generation, detailing volumetric and value-based consumption patterns. The Import Market Analysis quantifies the value and volume of crude oil and natural gas products entering the US, identifying key import sources. Conversely, the Export Market Analysis scrutinizes the value and volume of US oil and gas exports, highlighting major destination markets. Finally, the Price Trend Analysis explores historical and forecasted price movements for crude oil and natural gas, analyzing factors influencing price volatility and offering outlooks for future price trajectories.
Key Drivers of US Oil & Gas Upstream Market Growth
The growth of the US Oil & Gas Upstream Market is driven by several pivotal factors. Firstly, technological innovations, particularly in hydraulic fracturing and horizontal drilling, have unlocked vast unconventional reserves, significantly boosting production capacity. Secondly, robust global energy demand, fueled by economic growth and the ongoing need for hydrocarbons as primary energy sources and industrial feedstocks, provides a consistent market. Thirdly, favorable regulatory environments in certain key producing regions, coupled with strategic government policies supporting domestic energy production and infrastructure development, are crucial catalysts. Finally, the increasing export of Liquefied Natural Gas (LNG) to meet international demand presents a significant growth avenue for the natural gas segment.
Challenges in the US Oil & Gas Upstream Market Sector
Despite its growth, the US Oil & Gas Upstream Market faces substantial challenges. Stringent environmental regulations and increasing scrutiny over greenhouse gas emissions pose significant compliance hurdles and can lead to project delays or increased operational costs. Supply chain disruptions, exacerbated by global events and labor shortages, can impact the availability and cost of critical equipment and services, leading to project cost overruns, estimated at billions of dollars annually. Intense competition, both domestically and internationally, puts pressure on profit margins. Furthermore, price volatility in global oil and gas markets, influenced by geopolitical factors and economic cycles, creates uncertainty and can hinder long-term investment planning, impacting project viability and return on investment.
Emerging Opportunities in US Oil & Gas Upstream Market
Emerging opportunities in the US Oil & Gas Upstream Market are centered on sustainability and efficiency. The growing demand for cleaner energy sources presents an opportunity for increased production and export of natural gas, viewed as a transition fuel. Advancements in carbon capture, utilization, and storage (CCUS) technologies offer a pathway to decarbonize existing operations and reduce the environmental footprint, potentially unlocking new revenue streams. Furthermore, the exploration and development of deepwater reserves, particularly in the Gulf of Mexico, represent untapped potential. The application of AI and Big Data analytics in optimizing exploration, production, and reservoir management provides significant efficiency gains and cost reductions. The development of robust export infrastructure for LNG and refined products continues to be a key opportunity for market expansion.
Leading Players in the US Oil & Gas Upstream Market Market
- ExxonMobil
- Chevron
- BP
- Shell
- Valero Energy
- Saudi Aramco
Key Developments in US Oil & Gas Upstream Market Industry
- January 2023: Transocean Ltd announced contract awards or extensions for five drilling rigs. Together the fixtures represent approximately USD 488 million of firm backlog. Deepwater Invictus, an ultra-deepwater drillship, awarded a new three-well contract with an expected 100-day duration in the U.S. Gulf of Mexico with an independent operator. The contract contributes an estimated USD 43 million in backlog and is expected to commence in direct continuation of the rig's current program.
- February 2023: Williams announced that it had executed agreements with Chevron USA Inc to support natural gas development in the prolific Haynesville Basin and the deepwater Gulf of Mexico. The company will provide natural gas collecting services to Chevron's 26,000-acre Haynesville. Additionally, Williams agreed to utilize existing infrastructure to serve increased production from the Blind Faith platform, located 160 miles southeast of New Orleans in the Gulf of Mexico.
Strategic Outlook for US Oil & Gas Upstream Market Market
The strategic outlook for the US Oil & Gas Upstream Market is one of continued resilience and adaptation. The market is poised for sustained growth driven by robust domestic and international demand for oil and gas. Key growth catalysts include ongoing technological innovation, particularly in digitalization and automation, which will enhance operational efficiency and reduce costs, potentially saving billions. Strategic investments in expanding LNG export capacity will further solidify the US's position as a global energy supplier. The market's ability to navigate evolving environmental regulations and embrace decarbonization strategies through technologies like CCUS will be crucial for long-term sustainability and market access, attracting further multi-billion dollar investments in innovative solutions. Companies that effectively balance traditional hydrocarbon production with investments in cleaner energy alternatives will be best positioned for future success.
US Oil & Gas Upstream Market Segmentation
- 1. Production Analysis
- 2. Consumption Analysis
- 3. Import Market Analysis (Value & Volume)
- 4. Export Market Analysis (Value & Volume)
- 5. Price Trend Analysis
US Oil & Gas Upstream Market Segmentation By Geography
-
1. North America
- 1.1. United States
- 1.2. Canada
- 1.3. Mexico
-
2. South America
- 2.1. Brazil
- 2.2. Argentina
- 2.3. Rest of South America
-
3. Europe
- 3.1. United Kingdom
- 3.2. Germany
- 3.3. France
- 3.4. Italy
- 3.5. Spain
- 3.6. Russia
- 3.7. Benelux
- 3.8. Nordics
- 3.9. Rest of Europe
-
4. Middle East & Africa
- 4.1. Turkey
- 4.2. Israel
- 4.3. GCC
- 4.4. North Africa
- 4.5. South Africa
- 4.6. Rest of Middle East & Africa
-
5. Asia Pacific
- 5.1. China
- 5.2. India
- 5.3. Japan
- 5.4. South Korea
- 5.5. ASEAN
- 5.6. Oceania
- 5.7. Rest of Asia Pacific
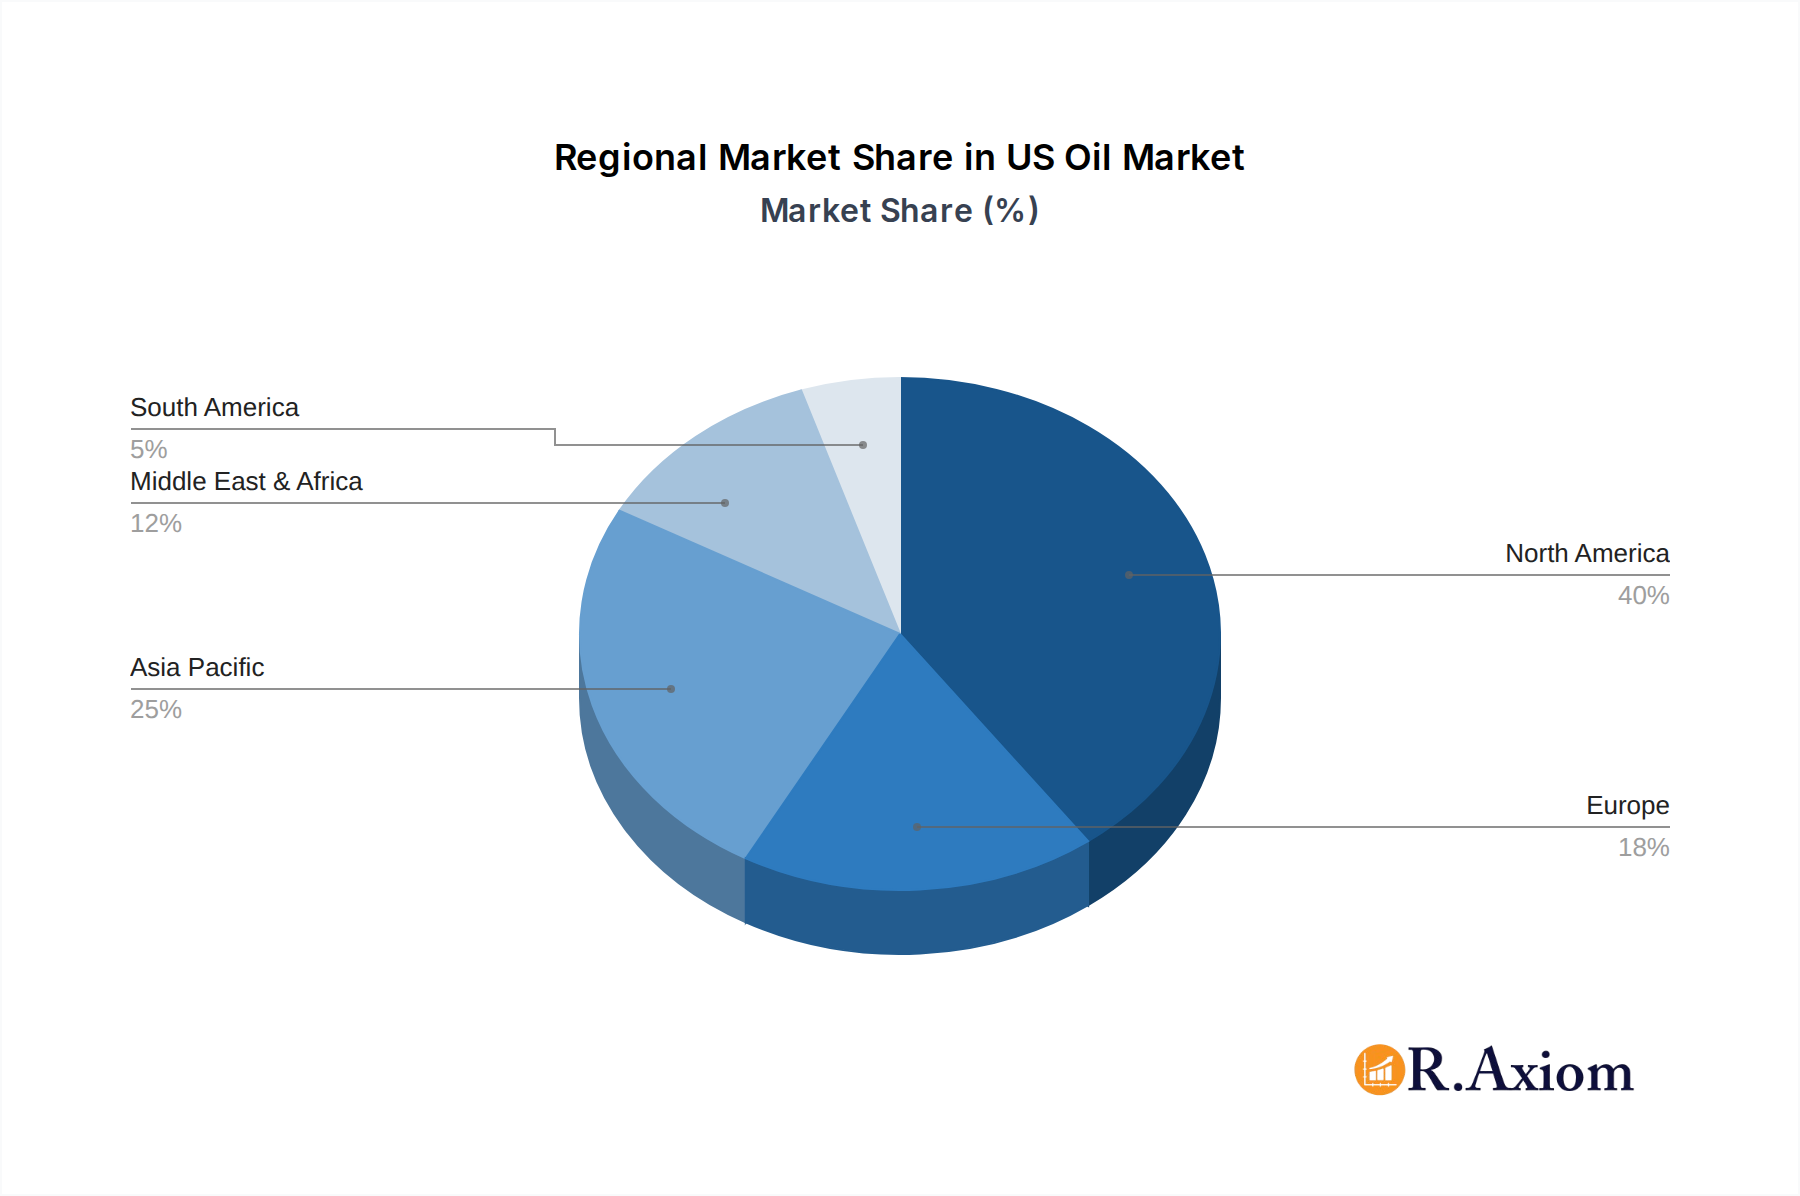
US Oil & Gas Upstream Market Regional Market Share
Geographic Coverage of US Oil & Gas Upstream Market
US Oil & Gas Upstream Market REPORT HIGHLIGHTS
| Aspects | Details |
|---|---|
| Study Period | 2020-2034 |
| Base Year | 2025 |
| Estimated Year | 2026 |
| Forecast Period | 2026-2034 |
| Historical Period | 2020-2025 |
| Growth Rate | CAGR of 4.7% from 2020-2034 |
| Segmentation |
|
Table of Contents
- 1. Introduction
- 1.1. Research Scope
- 1.2. Market Segmentation
- 1.3. Research Objective
- 1.4. Definitions and Assumptions
- 2. Executive Summary
- 2.1. Market Snapshot
- 3. Market Dynamics
- 3.1. Market Drivers
- 3.2. Market Restrains
- 3.3. Market Trends
- 3.4. Market Opportunities
- 4. Market Factor Analysis
- 4.1. Porters Five Forces
- 4.1.1. Bargaining Power of Suppliers
- 4.1.2. Bargaining Power of Buyers
- 4.1.3. Threat of New Entrants
- 4.1.4. Threat of Substitutes
- 4.1.5. Competitive Rivalry
- 4.2. PESTEL analysis
- 4.3. BCG Analysis
- 4.3.1. Stars (High Growth, High Market Share)
- 4.3.2. Cash Cows (Low Growth, High Market Share)
- 4.3.3. Question Mark (High Growth, Low Market Share)
- 4.3.4. Dogs (Low Growth, Low Market Share)
- 4.4. Ansoff Matrix Analysis
- 4.5. Supply Chain Analysis
- 4.6. Regulatory Landscape
- 4.7. Current Market Potential and Opportunity Assessment (TAM–SAM–SOM Framework)
- 4.8. RAX Analyst Note
- 4.1. Porters Five Forces
- 5. Market Analysis, Insights and Forecast 2021-2033
- 5.1. Market Analysis, Insights and Forecast - by Production Analysis
- 5.2. Market Analysis, Insights and Forecast - by Consumption Analysis
- 5.3. Market Analysis, Insights and Forecast - by Import Market Analysis (Value & Volume)
- 5.4. Market Analysis, Insights and Forecast - by Export Market Analysis (Value & Volume)
- 5.5. Market Analysis, Insights and Forecast - by Price Trend Analysis
- 5.6. Market Analysis, Insights and Forecast - by Region
- 5.6.1. North America
- 5.6.2. South America
- 5.6.3. Europe
- 5.6.4. Middle East & Africa
- 5.6.5. Asia Pacific
- 6. Global US Oil & Gas Upstream Market Analysis, Insights and Forecast, 2021-2033
- 6.1. Market Analysis, Insights and Forecast - by Production Analysis
- 6.2. Market Analysis, Insights and Forecast - by Consumption Analysis
- 6.3. Market Analysis, Insights and Forecast - by Import Market Analysis (Value & Volume)
- 6.4. Market Analysis, Insights and Forecast - by Export Market Analysis (Value & Volume)
- 6.5. Market Analysis, Insights and Forecast - by Price Trend Analysis
- 7. North America US Oil & Gas Upstream Market Analysis, Insights and Forecast, 2020-2032
- 7.1. Market Analysis, Insights and Forecast - by Production Analysis
- 7.2. Market Analysis, Insights and Forecast - by Consumption Analysis
- 7.3. Market Analysis, Insights and Forecast - by Import Market Analysis (Value & Volume)
- 7.4. Market Analysis, Insights and Forecast - by Export Market Analysis (Value & Volume)
- 7.5. Market Analysis, Insights and Forecast - by Price Trend Analysis
- 8. South America US Oil & Gas Upstream Market Analysis, Insights and Forecast, 2020-2032
- 8.1. Market Analysis, Insights and Forecast - by Production Analysis
- 8.2. Market Analysis, Insights and Forecast - by Consumption Analysis
- 8.3. Market Analysis, Insights and Forecast - by Import Market Analysis (Value & Volume)
- 8.4. Market Analysis, Insights and Forecast - by Export Market Analysis (Value & Volume)
- 8.5. Market Analysis, Insights and Forecast - by Price Trend Analysis
- 9. Europe US Oil & Gas Upstream Market Analysis, Insights and Forecast, 2020-2032
- 9.1. Market Analysis, Insights and Forecast - by Production Analysis
- 9.2. Market Analysis, Insights and Forecast - by Consumption Analysis
- 9.3. Market Analysis, Insights and Forecast - by Import Market Analysis (Value & Volume)
- 9.4. Market Analysis, Insights and Forecast - by Export Market Analysis (Value & Volume)
- 9.5. Market Analysis, Insights and Forecast - by Price Trend Analysis
- 10. Middle East & Africa US Oil & Gas Upstream Market Analysis, Insights and Forecast, 2020-2032
- 10.1. Market Analysis, Insights and Forecast - by Production Analysis
- 10.2. Market Analysis, Insights and Forecast - by Consumption Analysis
- 10.3. Market Analysis, Insights and Forecast - by Import Market Analysis (Value & Volume)
- 10.4. Market Analysis, Insights and Forecast - by Export Market Analysis (Value & Volume)
- 10.5. Market Analysis, Insights and Forecast - by Price Trend Analysis
- 11. Asia Pacific US Oil & Gas Upstream Market Analysis, Insights and Forecast, 2020-2032
- 11.1. Market Analysis, Insights and Forecast - by Production Analysis
- 11.2. Market Analysis, Insights and Forecast - by Consumption Analysis
- 11.3. Market Analysis, Insights and Forecast - by Import Market Analysis (Value & Volume)
- 11.4. Market Analysis, Insights and Forecast - by Export Market Analysis (Value & Volume)
- 11.5. Market Analysis, Insights and Forecast - by Price Trend Analysis
- 12. Competitive Analysis
- 12.1. Company Profiles
- 12.1.1 ExxonMobil
- 12.1.1.1. Company Overview
- 12.1.1.2. Products
- 12.1.1.3. Company Financials
- 12.1.1.4. SWOT Analysis
- 12.1.2 Chevron
- 12.1.2.1. Company Overview
- 12.1.2.2. Products
- 12.1.2.3. Company Financials
- 12.1.2.4. SWOT Analysis
- 12.1.3 BP
- 12.1.3.1. Company Overview
- 12.1.3.2. Products
- 12.1.3.3. Company Financials
- 12.1.3.4. SWOT Analysis
- 12.1.4 Shell
- 12.1.4.1. Company Overview
- 12.1.4.2. Products
- 12.1.4.3. Company Financials
- 12.1.4.4. SWOT Analysis
- 12.1.5 Valero Energy
- 12.1.5.1. Company Overview
- 12.1.5.2. Products
- 12.1.5.3. Company Financials
- 12.1.5.4. SWOT Analysis
- 12.1.6 Saudi Aramco
- 12.1.6.1. Company Overview
- 12.1.6.2. Products
- 12.1.6.3. Company Financials
- 12.1.6.4. SWOT Analysis
- 12.1.1 ExxonMobil
- 12.2. Market Entropy
- 12.2.1 Company's Key Areas Served
- 12.2.2 Recent Developments
- 12.3. Company Market Share Analysis 2025
- 12.3.1 Top 5 Companies Market Share Analysis
- 12.3.2 Top 3 Companies Market Share Analysis
- 12.4. List of Potential Customers
- 13. Research Methodology
List of Figures
- Figure 1: Global US Oil & Gas Upstream Market Revenue Breakdown (billion, %) by Region 2025 & 2033
- Figure 2: North America US Oil & Gas Upstream Market Revenue (billion), by Production Analysis 2025 & 2033
- Figure 3: North America US Oil & Gas Upstream Market Revenue Share (%), by Production Analysis 2025 & 2033
- Figure 4: North America US Oil & Gas Upstream Market Revenue (billion), by Consumption Analysis 2025 & 2033
- Figure 5: North America US Oil & Gas Upstream Market Revenue Share (%), by Consumption Analysis 2025 & 2033
- Figure 6: North America US Oil & Gas Upstream Market Revenue (billion), by Import Market Analysis (Value & Volume) 2025 & 2033
- Figure 7: North America US Oil & Gas Upstream Market Revenue Share (%), by Import Market Analysis (Value & Volume) 2025 & 2033
- Figure 8: North America US Oil & Gas Upstream Market Revenue (billion), by Export Market Analysis (Value & Volume) 2025 & 2033
- Figure 9: North America US Oil & Gas Upstream Market Revenue Share (%), by Export Market Analysis (Value & Volume) 2025 & 2033
- Figure 10: North America US Oil & Gas Upstream Market Revenue (billion), by Price Trend Analysis 2025 & 2033
- Figure 11: North America US Oil & Gas Upstream Market Revenue Share (%), by Price Trend Analysis 2025 & 2033
- Figure 12: North America US Oil & Gas Upstream Market Revenue (billion), by Country 2025 & 2033
- Figure 13: North America US Oil & Gas Upstream Market Revenue Share (%), by Country 2025 & 2033
- Figure 14: South America US Oil & Gas Upstream Market Revenue (billion), by Production Analysis 2025 & 2033
- Figure 15: South America US Oil & Gas Upstream Market Revenue Share (%), by Production Analysis 2025 & 2033
- Figure 16: South America US Oil & Gas Upstream Market Revenue (billion), by Consumption Analysis 2025 & 2033
- Figure 17: South America US Oil & Gas Upstream Market Revenue Share (%), by Consumption Analysis 2025 & 2033
- Figure 18: South America US Oil & Gas Upstream Market Revenue (billion), by Import Market Analysis (Value & Volume) 2025 & 2033
- Figure 19: South America US Oil & Gas Upstream Market Revenue Share (%), by Import Market Analysis (Value & Volume) 2025 & 2033
- Figure 20: South America US Oil & Gas Upstream Market Revenue (billion), by Export Market Analysis (Value & Volume) 2025 & 2033
- Figure 21: South America US Oil & Gas Upstream Market Revenue Share (%), by Export Market Analysis (Value & Volume) 2025 & 2033
- Figure 22: South America US Oil & Gas Upstream Market Revenue (billion), by Price Trend Analysis 2025 & 2033
- Figure 23: South America US Oil & Gas Upstream Market Revenue Share (%), by Price Trend Analysis 2025 & 2033
- Figure 24: South America US Oil & Gas Upstream Market Revenue (billion), by Country 2025 & 2033
- Figure 25: South America US Oil & Gas Upstream Market Revenue Share (%), by Country 2025 & 2033
- Figure 26: Europe US Oil & Gas Upstream Market Revenue (billion), by Production Analysis 2025 & 2033
- Figure 27: Europe US Oil & Gas Upstream Market Revenue Share (%), by Production Analysis 2025 & 2033
- Figure 28: Europe US Oil & Gas Upstream Market Revenue (billion), by Consumption Analysis 2025 & 2033
- Figure 29: Europe US Oil & Gas Upstream Market Revenue Share (%), by Consumption Analysis 2025 & 2033
- Figure 30: Europe US Oil & Gas Upstream Market Revenue (billion), by Import Market Analysis (Value & Volume) 2025 & 2033
- Figure 31: Europe US Oil & Gas Upstream Market Revenue Share (%), by Import Market Analysis (Value & Volume) 2025 & 2033
- Figure 32: Europe US Oil & Gas Upstream Market Revenue (billion), by Export Market Analysis (Value & Volume) 2025 & 2033
- Figure 33: Europe US Oil & Gas Upstream Market Revenue Share (%), by Export Market Analysis (Value & Volume) 2025 & 2033
- Figure 34: Europe US Oil & Gas Upstream Market Revenue (billion), by Price Trend Analysis 2025 & 2033
- Figure 35: Europe US Oil & Gas Upstream Market Revenue Share (%), by Price Trend Analysis 2025 & 2033
- Figure 36: Europe US Oil & Gas Upstream Market Revenue (billion), by Country 2025 & 2033
- Figure 37: Europe US Oil & Gas Upstream Market Revenue Share (%), by Country 2025 & 2033
- Figure 38: Middle East & Africa US Oil & Gas Upstream Market Revenue (billion), by Production Analysis 2025 & 2033
- Figure 39: Middle East & Africa US Oil & Gas Upstream Market Revenue Share (%), by Production Analysis 2025 & 2033
- Figure 40: Middle East & Africa US Oil & Gas Upstream Market Revenue (billion), by Consumption Analysis 2025 & 2033
- Figure 41: Middle East & Africa US Oil & Gas Upstream Market Revenue Share (%), by Consumption Analysis 2025 & 2033
- Figure 42: Middle East & Africa US Oil & Gas Upstream Market Revenue (billion), by Import Market Analysis (Value & Volume) 2025 & 2033
- Figure 43: Middle East & Africa US Oil & Gas Upstream Market Revenue Share (%), by Import Market Analysis (Value & Volume) 2025 & 2033
- Figure 44: Middle East & Africa US Oil & Gas Upstream Market Revenue (billion), by Export Market Analysis (Value & Volume) 2025 & 2033
- Figure 45: Middle East & Africa US Oil & Gas Upstream Market Revenue Share (%), by Export Market Analysis (Value & Volume) 2025 & 2033
- Figure 46: Middle East & Africa US Oil & Gas Upstream Market Revenue (billion), by Price Trend Analysis 2025 & 2033
- Figure 47: Middle East & Africa US Oil & Gas Upstream Market Revenue Share (%), by Price Trend Analysis 2025 & 2033
- Figure 48: Middle East & Africa US Oil & Gas Upstream Market Revenue (billion), by Country 2025 & 2033
- Figure 49: Middle East & Africa US Oil & Gas Upstream Market Revenue Share (%), by Country 2025 & 2033
- Figure 50: Asia Pacific US Oil & Gas Upstream Market Revenue (billion), by Production Analysis 2025 & 2033
- Figure 51: Asia Pacific US Oil & Gas Upstream Market Revenue Share (%), by Production Analysis 2025 & 2033
- Figure 52: Asia Pacific US Oil & Gas Upstream Market Revenue (billion), by Consumption Analysis 2025 & 2033
- Figure 53: Asia Pacific US Oil & Gas Upstream Market Revenue Share (%), by Consumption Analysis 2025 & 2033
- Figure 54: Asia Pacific US Oil & Gas Upstream Market Revenue (billion), by Import Market Analysis (Value & Volume) 2025 & 2033
- Figure 55: Asia Pacific US Oil & Gas Upstream Market Revenue Share (%), by Import Market Analysis (Value & Volume) 2025 & 2033
- Figure 56: Asia Pacific US Oil & Gas Upstream Market Revenue (billion), by Export Market Analysis (Value & Volume) 2025 & 2033
- Figure 57: Asia Pacific US Oil & Gas Upstream Market Revenue Share (%), by Export Market Analysis (Value & Volume) 2025 & 2033
- Figure 58: Asia Pacific US Oil & Gas Upstream Market Revenue (billion), by Price Trend Analysis 2025 & 2033
- Figure 59: Asia Pacific US Oil & Gas Upstream Market Revenue Share (%), by Price Trend Analysis 2025 & 2033
- Figure 60: Asia Pacific US Oil & Gas Upstream Market Revenue (billion), by Country 2025 & 2033
- Figure 61: Asia Pacific US Oil & Gas Upstream Market Revenue Share (%), by Country 2025 & 2033
List of Tables
- Table 1: Global US Oil & Gas Upstream Market Revenue billion Forecast, by Production Analysis 2020 & 2033
- Table 2: Global US Oil & Gas Upstream Market Revenue billion Forecast, by Consumption Analysis 2020 & 2033
- Table 3: Global US Oil & Gas Upstream Market Revenue billion Forecast, by Import Market Analysis (Value & Volume) 2020 & 2033
- Table 4: Global US Oil & Gas Upstream Market Revenue billion Forecast, by Export Market Analysis (Value & Volume) 2020 & 2033
- Table 5: Global US Oil & Gas Upstream Market Revenue billion Forecast, by Price Trend Analysis 2020 & 2033
- Table 6: Global US Oil & Gas Upstream Market Revenue billion Forecast, by Region 2020 & 2033
- Table 7: Global US Oil & Gas Upstream Market Revenue billion Forecast, by Production Analysis 2020 & 2033
- Table 8: Global US Oil & Gas Upstream Market Revenue billion Forecast, by Consumption Analysis 2020 & 2033
- Table 9: Global US Oil & Gas Upstream Market Revenue billion Forecast, by Import Market Analysis (Value & Volume) 2020 & 2033
- Table 10: Global US Oil & Gas Upstream Market Revenue billion Forecast, by Export Market Analysis (Value & Volume) 2020 & 2033
- Table 11: Global US Oil & Gas Upstream Market Revenue billion Forecast, by Price Trend Analysis 2020 & 2033
- Table 12: Global US Oil & Gas Upstream Market Revenue billion Forecast, by Country 2020 & 2033
- Table 13: United States US Oil & Gas Upstream Market Revenue (billion) Forecast, by Application 2020 & 2033
- Table 14: Canada US Oil & Gas Upstream Market Revenue (billion) Forecast, by Application 2020 & 2033
- Table 15: Mexico US Oil & Gas Upstream Market Revenue (billion) Forecast, by Application 2020 & 2033
- Table 16: Global US Oil & Gas Upstream Market Revenue billion Forecast, by Production Analysis 2020 & 2033
- Table 17: Global US Oil & Gas Upstream Market Revenue billion Forecast, by Consumption Analysis 2020 & 2033
- Table 18: Global US Oil & Gas Upstream Market Revenue billion Forecast, by Import Market Analysis (Value & Volume) 2020 & 2033
- Table 19: Global US Oil & Gas Upstream Market Revenue billion Forecast, by Export Market Analysis (Value & Volume) 2020 & 2033
- Table 20: Global US Oil & Gas Upstream Market Revenue billion Forecast, by Price Trend Analysis 2020 & 2033
- Table 21: Global US Oil & Gas Upstream Market Revenue billion Forecast, by Country 2020 & 2033
- Table 22: Brazil US Oil & Gas Upstream Market Revenue (billion) Forecast, by Application 2020 & 2033
- Table 23: Argentina US Oil & Gas Upstream Market Revenue (billion) Forecast, by Application 2020 & 2033
- Table 24: Rest of South America US Oil & Gas Upstream Market Revenue (billion) Forecast, by Application 2020 & 2033
- Table 25: Global US Oil & Gas Upstream Market Revenue billion Forecast, by Production Analysis 2020 & 2033
- Table 26: Global US Oil & Gas Upstream Market Revenue billion Forecast, by Consumption Analysis 2020 & 2033
- Table 27: Global US Oil & Gas Upstream Market Revenue billion Forecast, by Import Market Analysis (Value & Volume) 2020 & 2033
- Table 28: Global US Oil & Gas Upstream Market Revenue billion Forecast, by Export Market Analysis (Value & Volume) 2020 & 2033
- Table 29: Global US Oil & Gas Upstream Market Revenue billion Forecast, by Price Trend Analysis 2020 & 2033
- Table 30: Global US Oil & Gas Upstream Market Revenue billion Forecast, by Country 2020 & 2033
- Table 31: United Kingdom US Oil & Gas Upstream Market Revenue (billion) Forecast, by Application 2020 & 2033
- Table 32: Germany US Oil & Gas Upstream Market Revenue (billion) Forecast, by Application 2020 & 2033
- Table 33: France US Oil & Gas Upstream Market Revenue (billion) Forecast, by Application 2020 & 2033
- Table 34: Italy US Oil & Gas Upstream Market Revenue (billion) Forecast, by Application 2020 & 2033
- Table 35: Spain US Oil & Gas Upstream Market Revenue (billion) Forecast, by Application 2020 & 2033
- Table 36: Russia US Oil & Gas Upstream Market Revenue (billion) Forecast, by Application 2020 & 2033
- Table 37: Benelux US Oil & Gas Upstream Market Revenue (billion) Forecast, by Application 2020 & 2033
- Table 38: Nordics US Oil & Gas Upstream Market Revenue (billion) Forecast, by Application 2020 & 2033
- Table 39: Rest of Europe US Oil & Gas Upstream Market Revenue (billion) Forecast, by Application 2020 & 2033
- Table 40: Global US Oil & Gas Upstream Market Revenue billion Forecast, by Production Analysis 2020 & 2033
- Table 41: Global US Oil & Gas Upstream Market Revenue billion Forecast, by Consumption Analysis 2020 & 2033
- Table 42: Global US Oil & Gas Upstream Market Revenue billion Forecast, by Import Market Analysis (Value & Volume) 2020 & 2033
- Table 43: Global US Oil & Gas Upstream Market Revenue billion Forecast, by Export Market Analysis (Value & Volume) 2020 & 2033
- Table 44: Global US Oil & Gas Upstream Market Revenue billion Forecast, by Price Trend Analysis 2020 & 2033
- Table 45: Global US Oil & Gas Upstream Market Revenue billion Forecast, by Country 2020 & 2033
- Table 46: Turkey US Oil & Gas Upstream Market Revenue (billion) Forecast, by Application 2020 & 2033
- Table 47: Israel US Oil & Gas Upstream Market Revenue (billion) Forecast, by Application 2020 & 2033
- Table 48: GCC US Oil & Gas Upstream Market Revenue (billion) Forecast, by Application 2020 & 2033
- Table 49: North Africa US Oil & Gas Upstream Market Revenue (billion) Forecast, by Application 2020 & 2033
- Table 50: South Africa US Oil & Gas Upstream Market Revenue (billion) Forecast, by Application 2020 & 2033
- Table 51: Rest of Middle East & Africa US Oil & Gas Upstream Market Revenue (billion) Forecast, by Application 2020 & 2033
- Table 52: Global US Oil & Gas Upstream Market Revenue billion Forecast, by Production Analysis 2020 & 2033
- Table 53: Global US Oil & Gas Upstream Market Revenue billion Forecast, by Consumption Analysis 2020 & 2033
- Table 54: Global US Oil & Gas Upstream Market Revenue billion Forecast, by Import Market Analysis (Value & Volume) 2020 & 2033
- Table 55: Global US Oil & Gas Upstream Market Revenue billion Forecast, by Export Market Analysis (Value & Volume) 2020 & 2033
- Table 56: Global US Oil & Gas Upstream Market Revenue billion Forecast, by Price Trend Analysis 2020 & 2033
- Table 57: Global US Oil & Gas Upstream Market Revenue billion Forecast, by Country 2020 & 2033
- Table 58: China US Oil & Gas Upstream Market Revenue (billion) Forecast, by Application 2020 & 2033
- Table 59: India US Oil & Gas Upstream Market Revenue (billion) Forecast, by Application 2020 & 2033
- Table 60: Japan US Oil & Gas Upstream Market Revenue (billion) Forecast, by Application 2020 & 2033
- Table 61: South Korea US Oil & Gas Upstream Market Revenue (billion) Forecast, by Application 2020 & 2033
- Table 62: ASEAN US Oil & Gas Upstream Market Revenue (billion) Forecast, by Application 2020 & 2033
- Table 63: Oceania US Oil & Gas Upstream Market Revenue (billion) Forecast, by Application 2020 & 2033
- Table 64: Rest of Asia Pacific US Oil & Gas Upstream Market Revenue (billion) Forecast, by Application 2020 & 2033
Frequently Asked Questions
1. What is the projected Compound Annual Growth Rate (CAGR) of the US Oil & Gas Upstream Market?
The projected CAGR is approximately 4.7%.
2. Which companies are prominent players in the US Oil & Gas Upstream Market?
Key companies in the market include ExxonMobil , Chevron , BP, Shell , Valero Energy , Saudi Aramco.
3. What are the main segments of the US Oil & Gas Upstream Market?
The market segments include Production Analysis, Consumption Analysis, Import Market Analysis (Value & Volume), Export Market Analysis (Value & Volume), Price Trend Analysis.
4. Can you provide details about the market size?
The market size is estimated to be USD 474.5 billion as of 2022.
5. What are some drivers contributing to market growth?
4.; Reduction in the Cost of the Drilling Rigs4.; Increasing Discovery of New Oil and Gas Fields Along with Rising Investment in the Sector.
6. What are the notable trends driving market growth?
Onshore Segment to Dominate the Market.
7. Are there any restraints impacting market growth?
4.; Volatility in Oil Prices Along with Comparitively Higher Production Costs.
8. Can you provide examples of recent developments in the market?
January 2023: Transocean Ltd announced contract awards or extensions for five drilling rigs. Together the fixtures represent approximately USD 488 million of firm backlog. Deepwater Invictus, an ultra-deepwater drillship, awarded a new three-well contract with an expected 100-day duration in the U.S. Gulf of Mexico with an independent operator. The contract contributes an estimated USD 43 million in backlog and is expected to commence in direct continuation of the rig's current program.
9. What pricing options are available for accessing the report?
Pricing options include single-user, multi-user, and enterprise licenses priced at USD 3800, USD 4500, and USD 5800 respectively.
10. Is the market size provided in terms of value or volume?
The market size is provided in terms of value, measured in billion.
11. Are there any specific market keywords associated with the report?
Yes, the market keyword associated with the report is "US Oil & Gas Upstream Market," which aids in identifying and referencing the specific market segment covered.
12. How do I determine which pricing option suits my needs best?
The pricing options vary based on user requirements and access needs. Individual users may opt for single-user licenses, while businesses requiring broader access may choose multi-user or enterprise licenses for cost-effective access to the report.
13. Are there any additional resources or data provided in the US Oil & Gas Upstream Market report?
While the report offers comprehensive insights, it's advisable to review the specific contents or supplementary materials provided to ascertain if additional resources or data are available.
14. How can I stay updated on further developments or reports in the US Oil & Gas Upstream Market?
To stay informed about further developments, trends, and reports in the US Oil & Gas Upstream Market, consider subscribing to industry newsletters, following relevant companies and organizations, or regularly checking reputable industry news sources and publications.
Methodology
Step 1 - Identification of Relevant Samples Size from Population Database


Step 2 - Approaches for Defining Global Market Size (Value, Volume* & Price*)

Note*: In applicable scenarios
Step 3 - Data Sources
Primary Research
- Web Analytics
- Survey Reports
- Research Institute
- Latest Research Reports
- Opinion Leaders
Secondary Research
- Annual Reports
- White Paper
- Latest Press Release
- Industry Association
- Paid Database
- Investor Presentations

Step 4 - Data Triangulation
Involves using different sources of information in order to increase the validity of a study
These sources are likely to be stakeholders in a program - participants, other researchers, program staff, other community members, and so on.
Then we put all data in single framework & apply various statistical tools to find out the dynamic on the market.
During the analysis stage, feedback from the stakeholder groups would be compared to determine areas of agreement as well as areas of divergence