

Key Insights
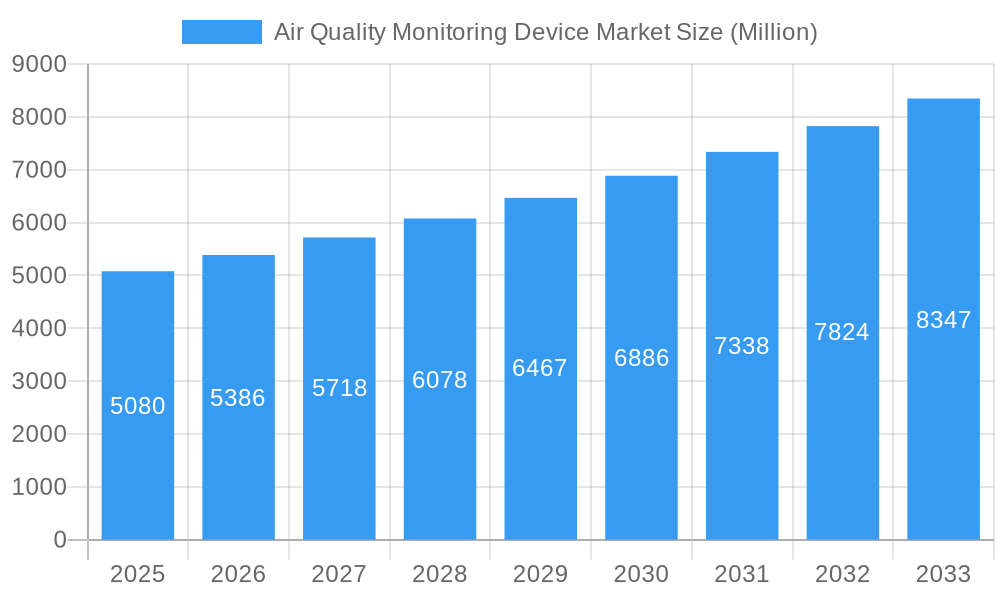
The Air Quality Monitoring Device market is experiencing robust growth, projected to reach \$5.08 billion in 2025 and maintain a Compound Annual Growth Rate (CAGR) of 5.79% from 2025 to 2033. Several factors contribute to this expansion. Increasing environmental concerns and stringent government regulations regarding air quality are driving demand for advanced monitoring systems across residential, commercial, and industrial sectors. The growing prevalence of respiratory illnesses linked to poor air quality further fuels this demand. Technological advancements, such as the development of more compact, portable, and cost-effective sensors, coupled with improved data analytics capabilities for real-time monitoring and predictive modeling, are also key drivers. The market is segmented by product type (indoor and outdoor monitors), sampling method (continuous, manual, intermittent), and end-user (residential, commercial, power generation, petrochemicals, and others). While the market faces some constraints such as high initial investment costs for sophisticated systems and potential challenges related to data accuracy and standardization, the overall growth trajectory remains positive. The increasing integration of IoT technologies and the rise of smart cities are expected to further accelerate market growth in the coming years. North America and Asia Pacific currently represent significant market shares due to robust environmental regulations and industrial activities in these regions; however, growth is anticipated across all regions as awareness and concern for air quality increases globally.
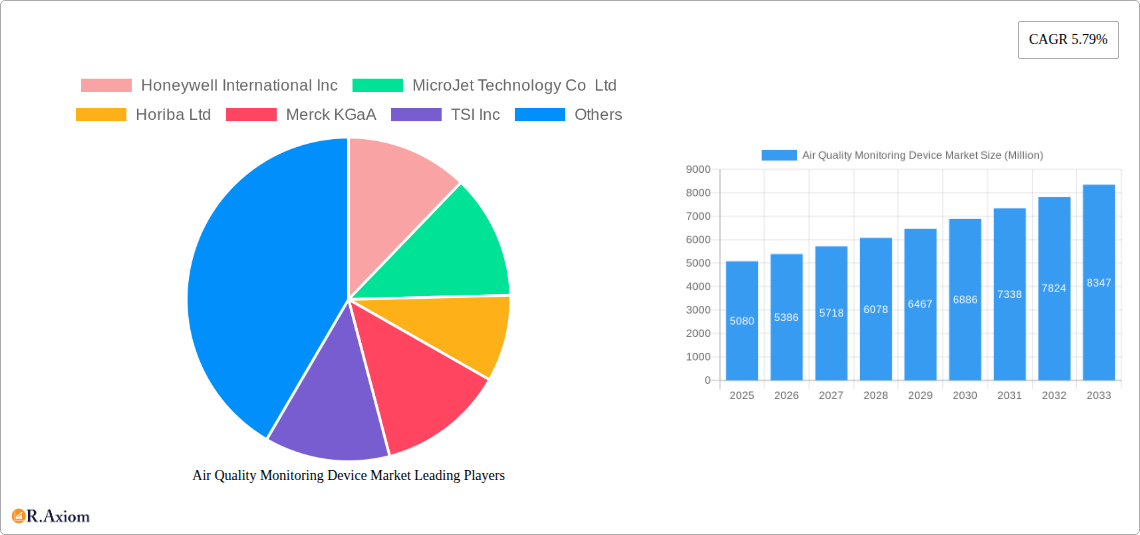
Air Quality Monitoring Device Market Market Size (In Billion)
The leading players in this market—including Honeywell International Inc., MicroJet Technology Co. Ltd., Horiba Ltd., Merck KGaA, and others—are constantly innovating to meet the evolving needs of various sectors. Competition is fierce, with companies focusing on product differentiation through advanced features, superior data analytics, and comprehensive service offerings. Future market growth will likely be driven by advancements in sensor technology, the development of portable and low-cost devices, and the expanding adoption of cloud-based solutions for data management and analysis. The increasing demand for continuous monitoring in densely populated urban areas and industrial zones presents significant opportunities for market expansion. The incorporation of artificial intelligence (AI) and machine learning (ML) for predictive analytics and improved data interpretation is anticipated to significantly enhance the effectiveness of air quality monitoring systems, thus fueling further market expansion in the long term.
Air Quality Monitoring Device Market Company Market Share
Air Quality Monitoring Device Market: A Comprehensive Report (2019-2033)
This detailed report provides a comprehensive analysis of the Air Quality Monitoring Device market, offering invaluable insights for stakeholders across the value chain. Covering the period from 2019 to 2033, with a base year of 2025 and a forecast period of 2025-2033, this report meticulously examines market dynamics, growth drivers, competitive landscapes, and emerging trends. The market is segmented by product type (Indoor Monitor, Outdoor Monitor), sampling method (Continuous, Manual, Intermittent), and end-user (Residential and Commercial, Power Generation, Petrochemicals, Other End Users). The report values are expressed in Millions.
Air Quality Monitoring Device Market Concentration & Innovation
The Air Quality Monitoring Device market exhibits a moderately concentrated landscape, with a handful of established players holding significant market share. Honeywell International Inc., Thermo Fisher Scientific Inc., and TSI Inc. are among the leading companies, collectively accounting for an estimated xx% of the market in 2025. However, the market is witnessing increased competition from smaller, specialized firms offering innovative solutions.
Market concentration is influenced by factors such as:
- Technological advancements: Continuous innovation in sensor technology, data analytics, and connectivity is driving market disruption and creating opportunities for new entrants.
- Regulatory landscape: Stringent environmental regulations globally are mandating higher air quality monitoring standards, creating a robust demand for advanced devices. Compliance costs are significantly affecting market growth.
- Product substitution: The availability of cost-effective, user-friendly monitoring devices is gradually replacing older technologies, fueling market expansion.
- End-user trends: The increasing awareness of air quality issues among consumers and businesses is driving the adoption of air quality monitoring solutions in various sectors.
- Mergers and Acquisitions (M&A): Consolidation within the industry is expected to continue, with larger players acquiring smaller companies to expand their product portfolios and market reach. The total M&A deal value in the past five years is estimated at $xx Million.
Air Quality Monitoring Device Market Industry Trends & Insights
The global Air Quality Monitoring Device market is experiencing robust growth, driven by several factors. The market is projected to witness a CAGR of xx% during the forecast period (2025-2033), reaching a market value of $xx Million by 2033. Several factors fuel this expansion:
Rising concerns over air pollution and its adverse effects on public health are driving significant investments in air quality monitoring infrastructure. This trend is particularly evident in densely populated urban areas and emerging economies experiencing rapid industrialization. Technological advancements, such as the development of smaller, more accurate, and cost-effective sensors, are making air quality monitoring more accessible and affordable. The increasing integration of IoT (Internet of Things) and cloud-based technologies is further enhancing the capabilities of monitoring devices, enabling real-time data analysis and remote monitoring capabilities. Consumer preference is shifting towards smart, connected devices, providing real-time data and insights on indoor and outdoor air quality. Increased government initiatives and investments in smart city infrastructure are fostering the growth of the market, with substantial public funding allocated to air quality improvement programs. The market penetration rate is expected to reach xx% by 2033, indicating significant growth potential. Competitive dynamics are characterized by ongoing innovation, strategic partnerships, and acquisitions, leading to increased product differentiation and a broader range of solutions.
Dominant Markets & Segments in Air Quality Monitoring Device Market
The Asia-Pacific region dominates the Air Quality Monitoring Device market, driven by rapid urbanization, industrial growth, and rising air pollution concerns. China and India are key contributors to this regional dominance.
- Key Drivers in the Asia-Pacific Region:
- Rapid industrialization and urbanization.
- Increasing government initiatives to improve air quality.
- Rising disposable incomes and increased awareness of air pollution health risks.
- Favorable regulatory environment promoting air quality monitoring.
- Development of smart city projects.
Within the product type segment, the Outdoor Monitor segment holds the largest market share, driven by the need for comprehensive air quality assessments in public areas. The Continuous sampling method is the most widely adopted method due to its ability to provide real-time data. The Residential and Commercial end-user segment constitutes a significant portion of the market, reflecting growing individual and business awareness of indoor air quality.
Detailed dominance analysis shows that while the Asia-Pacific region leads in overall volume, North America and Europe show higher average selling prices due to more advanced and specialized technologies implemented.
Air Quality Monitoring Device Market Product Developments
Recent product innovations focus on improving sensor accuracy, miniaturization, and connectivity. Advanced features like real-time data analysis, remote monitoring capabilities, and integration with IoT platforms are enhancing the functionality of these devices. This creates a competitive advantage by providing users with valuable data insights for effective air quality management and pollution mitigation. The market is trending towards more user-friendly and affordable monitoring solutions, making them accessible to a wider consumer base.
Report Scope & Segmentation Analysis
This report comprehensively analyzes the Air Quality Monitoring Device market across various segments:
Product Type:
- Indoor Monitor: This segment is experiencing steady growth, driven by increasing awareness of indoor air quality and the associated health risks. The market size is projected to reach $xx Million by 2033.
- Outdoor Monitor: This segment dominates the market, driven by the need for comprehensive air quality assessments in public spaces. Market size is projected to reach $xx Million by 2033.
Sampling Method:
- Continuous: This method provides real-time data, making it the most widely adopted approach. The market size is projected to reach $xx Million by 2033.
- Manual: Manual sampling methods are employed for specific applications, but their market share is relatively smaller.
- Intermittent: This segment represents a smaller market share but is expected to show some growth in niche applications.
End User:
- Residential and Commercial: This segment is characterized by a high growth rate, driven by increasing consumer awareness. The market size is projected to reach $xx Million by 2033.
- Power Generation: This segment is important due to stringent emission regulations.
- Petrochemicals: Stringent regulations and safety concerns drive demand in this sector.
- Other End Users: This includes various industries and research institutions.
Each segment exhibits unique competitive dynamics and growth projections.
Key Drivers of Air Quality Monitoring Device Market Growth
The market's growth is fueled by several key drivers:
- Stringent environmental regulations: Governments worldwide are enacting stricter emission standards and air quality regulations, mandating the use of air quality monitoring devices.
- Growing awareness of air pollution's health impacts: Increasing public awareness of the detrimental effects of poor air quality on human health is driving demand for monitoring solutions.
- Technological advancements: Innovations in sensor technology, data analytics, and connectivity are continuously improving the accuracy, efficiency, and affordability of air quality monitoring devices.
- Government initiatives and investments: Significant public funding for air quality improvement programs and smart city initiatives are further boosting market growth.
Challenges in the Air Quality Monitoring Device Market Sector
Several challenges hinder market growth:
- High initial investment costs: The cost of advanced air quality monitoring systems can be prohibitive for some users, particularly in developing countries.
- Data interpretation and analysis complexities: The large volume of data generated by monitoring devices can be challenging to interpret and analyze effectively.
- Maintenance and calibration costs: The ongoing maintenance and calibration of air quality monitoring equipment can be expensive.
- Supply chain disruptions: Global supply chain vulnerabilities can impact the availability and cost of components used in manufacturing air quality monitoring devices. This affected the market by approximately xx% in 2022.
Emerging Opportunities in Air Quality Monitoring Device Market
Several emerging opportunities promise significant market growth:
- Development of low-cost, portable devices: Affordable and user-friendly air quality monitors will increase accessibility.
- Integration with smart home and building management systems: Integrating air quality monitoring into existing smart systems will enhance overall system efficiency.
- Expansion into new markets: Untapped markets in developing economies present significant growth potential.
- Advancements in sensor technology: Improved sensor technology enables more accurate and reliable data acquisition.
Leading Players in the Air Quality Monitoring Device Market
- Honeywell International Inc.
- MicroJet Technology Co Ltd
- Horiba Ltd
- Merck KGaA
- TSI Inc
- Thermo Fisher Scientific Inc
- Hawa Dawa GmbH
- Emerson Electric Co
- Siemens AG
- Agilent Technologies Inc
- 3M Co
- Teledyne Technologies Inc
Key Developments in Air Quality Monitoring Device Market Industry
- March 2023: Tyndall National Institute participates in a new European project to improve air quality monitoring, receiving EC funds for research.
- February 2022: Hawadawa partners with Thies Clima to offer a comprehensive solution integrating air quality and weather data analysis.
Strategic Outlook for Air Quality Monitoring Device Market
The Air Quality Monitoring Device market is poised for continued expansion, driven by escalating environmental concerns, technological advancements, and supportive government policies. The market's future potential lies in the development of innovative, cost-effective, and user-friendly monitoring solutions catering to diverse end-user needs. Strategic partnerships, acquisitions, and technological innovations will play a crucial role in shaping the market's future trajectory. Expanding into emerging markets and integrating monitoring systems into broader smart infrastructure initiatives will further enhance market growth.
Air Quality Monitoring Device Market Segmentation
-
1. Product Type
- 1.1. Indoor Monitor
- 1.2. Outdoor Monitor
-
2. Sampling Method
- 2.1. Continuous
- 2.2. Manual
- 2.3. Intermittent
-
3. End User
- 3.1. Residential and Commercial
- 3.2. Power Generation
- 3.3. Petrochemicals
- 3.4. Other End Users
Air Quality Monitoring Device Market Segmentation By Geography
-
1. North America
- 1.1. United States
- 1.2. Canada
- 1.3. Rest of the North America
-
2. Europe
- 2.1. United Kingdom
- 2.2. Spain
- 2.3. Germany
- 2.4. Italy
-
3. Asia
- 3.1. China
- 3.2. Japan
- 3.3. Vietnam
- 3.4. India
- 3.5. Australia and New Zealand
-
4. South America
- 4.1. Brazil
- 4.2. Argentina
-
5. Middle East and Africa
- 5.1. United Arab Emirates
- 5.2. South Africa
- 5.3. Saudi Arabia
- 5.4. Iraq
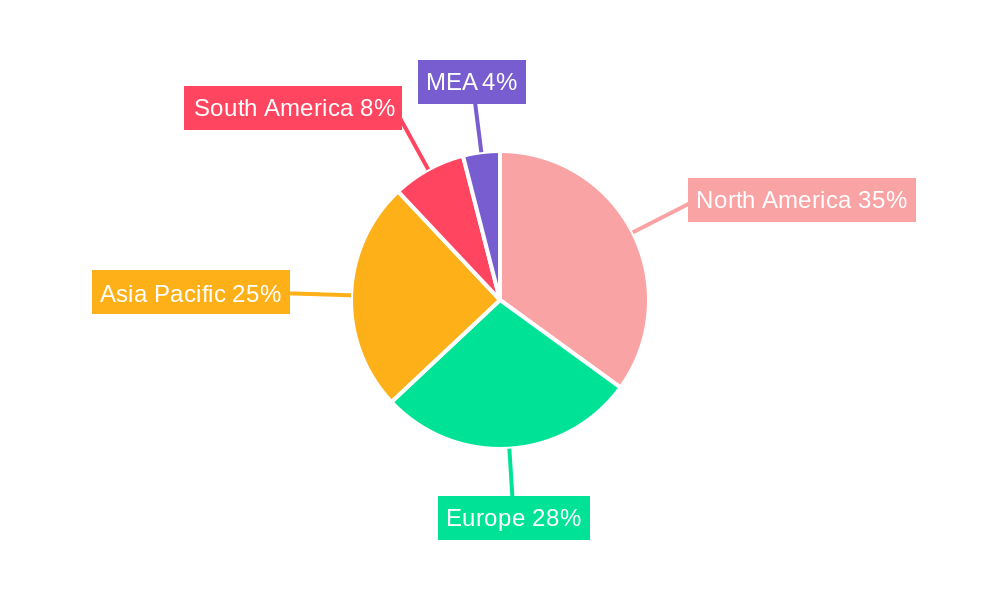
Air Quality Monitoring Device Market Regional Market Share
Geographic Coverage of Air Quality Monitoring Device Market
Air Quality Monitoring Device Market REPORT HIGHLIGHTS
| Aspects | Details |
|---|---|
| Study Period | 2020-2034 |
| Base Year | 2025 |
| Estimated Year | 2026 |
| Forecast Period | 2026-2034 |
| Historical Period | 2020-2025 |
| Growth Rate | CAGR of 5.79% from 2020-2034 |
| Segmentation |
|
Table of Contents
- 1. Introduction
- 1.1. Research Scope
- 1.2. Market Segmentation
- 1.3. Research Objective
- 1.4. Definitions and Assumptions
- 2. Executive Summary
- 2.1. Market Snapshot
- 3. Market Dynamics
- 3.1. Market Drivers
- 3.2. Market Restrains
- 3.3. Market Trends
- 3.4. Market Opportunities
- 4. Market Factor Analysis
- 4.1. Porters Five Forces
- 4.1.1. Bargaining Power of Suppliers
- 4.1.2. Bargaining Power of Buyers
- 4.1.3. Threat of New Entrants
- 4.1.4. Threat of Substitutes
- 4.1.5. Competitive Rivalry
- 4.2. PESTEL analysis
- 4.3. BCG Analysis
- 4.3.1. Stars (High Growth, High Market Share)
- 4.3.2. Cash Cows (Low Growth, High Market Share)
- 4.3.3. Question Mark (High Growth, Low Market Share)
- 4.3.4. Dogs (Low Growth, Low Market Share)
- 4.4. Ansoff Matrix Analysis
- 4.5. Supply Chain Analysis
- 4.6. Regulatory Landscape
- 4.7. Current Market Potential and Opportunity Assessment (TAM–SAM–SOM Framework)
- 4.8. RAX Analyst Note
- 4.1. Porters Five Forces
- 5. Market Analysis, Insights and Forecast 2021-2033
- 5.1. Market Analysis, Insights and Forecast - by Product Type
- 5.1.1. Indoor Monitor
- 5.1.2. Outdoor Monitor
- 5.2. Market Analysis, Insights and Forecast - by Sampling Method
- 5.2.1. Continuous
- 5.2.2. Manual
- 5.2.3. Intermittent
- 5.3. Market Analysis, Insights and Forecast - by End User
- 5.3.1. Residential and Commercial
- 5.3.2. Power Generation
- 5.3.3. Petrochemicals
- 5.3.4. Other End Users
- 5.4. Market Analysis, Insights and Forecast - by Region
- 5.4.1. North America
- 5.4.2. Europe
- 5.4.3. Asia
- 5.4.4. South America
- 5.4.5. Middle East and Africa
- 5.1. Market Analysis, Insights and Forecast - by Product Type
- 6. Global Air Quality Monitoring Device Market Analysis, Insights and Forecast, 2021-2033
- 6.1. Market Analysis, Insights and Forecast - by Product Type
- 6.1.1. Indoor Monitor
- 6.1.2. Outdoor Monitor
- 6.2. Market Analysis, Insights and Forecast - by Sampling Method
- 6.2.1. Continuous
- 6.2.2. Manual
- 6.2.3. Intermittent
- 6.3. Market Analysis, Insights and Forecast - by End User
- 6.3.1. Residential and Commercial
- 6.3.2. Power Generation
- 6.3.3. Petrochemicals
- 6.3.4. Other End Users
- 6.1. Market Analysis, Insights and Forecast - by Product Type
- 7. North America Air Quality Monitoring Device Market Analysis, Insights and Forecast, 2020-2032
- 7.1. Market Analysis, Insights and Forecast - by Product Type
- 7.1.1. Indoor Monitor
- 7.1.2. Outdoor Monitor
- 7.2. Market Analysis, Insights and Forecast - by Sampling Method
- 7.2.1. Continuous
- 7.2.2. Manual
- 7.2.3. Intermittent
- 7.3. Market Analysis, Insights and Forecast - by End User
- 7.3.1. Residential and Commercial
- 7.3.2. Power Generation
- 7.3.3. Petrochemicals
- 7.3.4. Other End Users
- 7.1. Market Analysis, Insights and Forecast - by Product Type
- 8. Europe Air Quality Monitoring Device Market Analysis, Insights and Forecast, 2020-2032
- 8.1. Market Analysis, Insights and Forecast - by Product Type
- 8.1.1. Indoor Monitor
- 8.1.2. Outdoor Monitor
- 8.2. Market Analysis, Insights and Forecast - by Sampling Method
- 8.2.1. Continuous
- 8.2.2. Manual
- 8.2.3. Intermittent
- 8.3. Market Analysis, Insights and Forecast - by End User
- 8.3.1. Residential and Commercial
- 8.3.2. Power Generation
- 8.3.3. Petrochemicals
- 8.3.4. Other End Users
- 8.1. Market Analysis, Insights and Forecast - by Product Type
- 9. Asia Air Quality Monitoring Device Market Analysis, Insights and Forecast, 2020-2032
- 9.1. Market Analysis, Insights and Forecast - by Product Type
- 9.1.1. Indoor Monitor
- 9.1.2. Outdoor Monitor
- 9.2. Market Analysis, Insights and Forecast - by Sampling Method
- 9.2.1. Continuous
- 9.2.2. Manual
- 9.2.3. Intermittent
- 9.3. Market Analysis, Insights and Forecast - by End User
- 9.3.1. Residential and Commercial
- 9.3.2. Power Generation
- 9.3.3. Petrochemicals
- 9.3.4. Other End Users
- 9.1. Market Analysis, Insights and Forecast - by Product Type
- 10. South America Air Quality Monitoring Device Market Analysis, Insights and Forecast, 2020-2032
- 10.1. Market Analysis, Insights and Forecast - by Product Type
- 10.1.1. Indoor Monitor
- 10.1.2. Outdoor Monitor
- 10.2. Market Analysis, Insights and Forecast - by Sampling Method
- 10.2.1. Continuous
- 10.2.2. Manual
- 10.2.3. Intermittent
- 10.3. Market Analysis, Insights and Forecast - by End User
- 10.3.1. Residential and Commercial
- 10.3.2. Power Generation
- 10.3.3. Petrochemicals
- 10.3.4. Other End Users
- 10.1. Market Analysis, Insights and Forecast - by Product Type
- 11. Middle East and Africa Air Quality Monitoring Device Market Analysis, Insights and Forecast, 2020-2032
- 11.1. Market Analysis, Insights and Forecast - by Product Type
- 11.1.1. Indoor Monitor
- 11.1.2. Outdoor Monitor
- 11.2. Market Analysis, Insights and Forecast - by Sampling Method
- 11.2.1. Continuous
- 11.2.2. Manual
- 11.2.3. Intermittent
- 11.3. Market Analysis, Insights and Forecast - by End User
- 11.3.1. Residential and Commercial
- 11.3.2. Power Generation
- 11.3.3. Petrochemicals
- 11.3.4. Other End Users
- 11.1. Market Analysis, Insights and Forecast - by Product Type
- 12. Competitive Analysis
- 12.1. Company Profiles
- 12.1.1 Honeywell International Inc
- 12.1.1.1. Company Overview
- 12.1.1.2. Products
- 12.1.1.3. Company Financials
- 12.1.1.4. SWOT Analysis
- 12.1.2 MicroJet Technology Co Ltd
- 12.1.2.1. Company Overview
- 12.1.2.2. Products
- 12.1.2.3. Company Financials
- 12.1.2.4. SWOT Analysis
- 12.1.3 Horiba Ltd
- 12.1.3.1. Company Overview
- 12.1.3.2. Products
- 12.1.3.3. Company Financials
- 12.1.3.4. SWOT Analysis
- 12.1.4 Merck KGaA
- 12.1.4.1. Company Overview
- 12.1.4.2. Products
- 12.1.4.3. Company Financials
- 12.1.4.4. SWOT Analysis
- 12.1.5 TSI Inc
- 12.1.5.1. Company Overview
- 12.1.5.2. Products
- 12.1.5.3. Company Financials
- 12.1.5.4. SWOT Analysis
- 12.1.6 Thermo Fisher Scientific Inc
- 12.1.6.1. Company Overview
- 12.1.6.2. Products
- 12.1.6.3. Company Financials
- 12.1.6.4. SWOT Analysis
- 12.1.7 Hawa Dawa GmbH
- 12.1.7.1. Company Overview
- 12.1.7.2. Products
- 12.1.7.3. Company Financials
- 12.1.7.4. SWOT Analysis
- 12.1.8 Emerson Electric Co
- 12.1.8.1. Company Overview
- 12.1.8.2. Products
- 12.1.8.3. Company Financials
- 12.1.8.4. SWOT Analysis
- 12.1.9 Siemens AG
- 12.1.9.1. Company Overview
- 12.1.9.2. Products
- 12.1.9.3. Company Financials
- 12.1.9.4. SWOT Analysis
- 12.1.10 Agilent Technologies Inc
- 12.1.10.1. Company Overview
- 12.1.10.2. Products
- 12.1.10.3. Company Financials
- 12.1.10.4. SWOT Analysis
- 12.1.11 3M Co
- 12.1.11.1. Company Overview
- 12.1.11.2. Products
- 12.1.11.3. Company Financials
- 12.1.11.4. SWOT Analysis
- 12.1.12 Teledyne Technologies Inc
- 12.1.12.1. Company Overview
- 12.1.12.2. Products
- 12.1.12.3. Company Financials
- 12.1.12.4. SWOT Analysis
- 12.1.1 Honeywell International Inc
- 12.2. Market Entropy
- 12.2.1 Company's Key Areas Served
- 12.2.2 Recent Developments
- 12.3. Company Market Share Analysis 2025
- 12.3.1 Top 5 Companies Market Share Analysis
- 12.3.2 Top 3 Companies Market Share Analysis
- 12.4. List of Potential Customers
- 13. Research Methodology
List of Figures
- Figure 1: Global Air Quality Monitoring Device Market Revenue Breakdown (Million, %) by Region 2025 & 2033
- Figure 2: Global Air Quality Monitoring Device Market Volume Breakdown (K Units, %) by Region 2025 & 2033
- Figure 3: North America Air Quality Monitoring Device Market Revenue (Million), by Product Type 2025 & 2033
- Figure 4: North America Air Quality Monitoring Device Market Volume (K Units), by Product Type 2025 & 2033
- Figure 5: North America Air Quality Monitoring Device Market Revenue Share (%), by Product Type 2025 & 2033
- Figure 6: North America Air Quality Monitoring Device Market Volume Share (%), by Product Type 2025 & 2033
- Figure 7: North America Air Quality Monitoring Device Market Revenue (Million), by Sampling Method 2025 & 2033
- Figure 8: North America Air Quality Monitoring Device Market Volume (K Units), by Sampling Method 2025 & 2033
- Figure 9: North America Air Quality Monitoring Device Market Revenue Share (%), by Sampling Method 2025 & 2033
- Figure 10: North America Air Quality Monitoring Device Market Volume Share (%), by Sampling Method 2025 & 2033
- Figure 11: North America Air Quality Monitoring Device Market Revenue (Million), by End User 2025 & 2033
- Figure 12: North America Air Quality Monitoring Device Market Volume (K Units), by End User 2025 & 2033
- Figure 13: North America Air Quality Monitoring Device Market Revenue Share (%), by End User 2025 & 2033
- Figure 14: North America Air Quality Monitoring Device Market Volume Share (%), by End User 2025 & 2033
- Figure 15: North America Air Quality Monitoring Device Market Revenue (Million), by Country 2025 & 2033
- Figure 16: North America Air Quality Monitoring Device Market Volume (K Units), by Country 2025 & 2033
- Figure 17: North America Air Quality Monitoring Device Market Revenue Share (%), by Country 2025 & 2033
- Figure 18: North America Air Quality Monitoring Device Market Volume Share (%), by Country 2025 & 2033
- Figure 19: Europe Air Quality Monitoring Device Market Revenue (Million), by Product Type 2025 & 2033
- Figure 20: Europe Air Quality Monitoring Device Market Volume (K Units), by Product Type 2025 & 2033
- Figure 21: Europe Air Quality Monitoring Device Market Revenue Share (%), by Product Type 2025 & 2033
- Figure 22: Europe Air Quality Monitoring Device Market Volume Share (%), by Product Type 2025 & 2033
- Figure 23: Europe Air Quality Monitoring Device Market Revenue (Million), by Sampling Method 2025 & 2033
- Figure 24: Europe Air Quality Monitoring Device Market Volume (K Units), by Sampling Method 2025 & 2033
- Figure 25: Europe Air Quality Monitoring Device Market Revenue Share (%), by Sampling Method 2025 & 2033
- Figure 26: Europe Air Quality Monitoring Device Market Volume Share (%), by Sampling Method 2025 & 2033
- Figure 27: Europe Air Quality Monitoring Device Market Revenue (Million), by End User 2025 & 2033
- Figure 28: Europe Air Quality Monitoring Device Market Volume (K Units), by End User 2025 & 2033
- Figure 29: Europe Air Quality Monitoring Device Market Revenue Share (%), by End User 2025 & 2033
- Figure 30: Europe Air Quality Monitoring Device Market Volume Share (%), by End User 2025 & 2033
- Figure 31: Europe Air Quality Monitoring Device Market Revenue (Million), by Country 2025 & 2033
- Figure 32: Europe Air Quality Monitoring Device Market Volume (K Units), by Country 2025 & 2033
- Figure 33: Europe Air Quality Monitoring Device Market Revenue Share (%), by Country 2025 & 2033
- Figure 34: Europe Air Quality Monitoring Device Market Volume Share (%), by Country 2025 & 2033
- Figure 35: Asia Air Quality Monitoring Device Market Revenue (Million), by Product Type 2025 & 2033
- Figure 36: Asia Air Quality Monitoring Device Market Volume (K Units), by Product Type 2025 & 2033
- Figure 37: Asia Air Quality Monitoring Device Market Revenue Share (%), by Product Type 2025 & 2033
- Figure 38: Asia Air Quality Monitoring Device Market Volume Share (%), by Product Type 2025 & 2033
- Figure 39: Asia Air Quality Monitoring Device Market Revenue (Million), by Sampling Method 2025 & 2033
- Figure 40: Asia Air Quality Monitoring Device Market Volume (K Units), by Sampling Method 2025 & 2033
- Figure 41: Asia Air Quality Monitoring Device Market Revenue Share (%), by Sampling Method 2025 & 2033
- Figure 42: Asia Air Quality Monitoring Device Market Volume Share (%), by Sampling Method 2025 & 2033
- Figure 43: Asia Air Quality Monitoring Device Market Revenue (Million), by End User 2025 & 2033
- Figure 44: Asia Air Quality Monitoring Device Market Volume (K Units), by End User 2025 & 2033
- Figure 45: Asia Air Quality Monitoring Device Market Revenue Share (%), by End User 2025 & 2033
- Figure 46: Asia Air Quality Monitoring Device Market Volume Share (%), by End User 2025 & 2033
- Figure 47: Asia Air Quality Monitoring Device Market Revenue (Million), by Country 2025 & 2033
- Figure 48: Asia Air Quality Monitoring Device Market Volume (K Units), by Country 2025 & 2033
- Figure 49: Asia Air Quality Monitoring Device Market Revenue Share (%), by Country 2025 & 2033
- Figure 50: Asia Air Quality Monitoring Device Market Volume Share (%), by Country 2025 & 2033
- Figure 51: South America Air Quality Monitoring Device Market Revenue (Million), by Product Type 2025 & 2033
- Figure 52: South America Air Quality Monitoring Device Market Volume (K Units), by Product Type 2025 & 2033
- Figure 53: South America Air Quality Monitoring Device Market Revenue Share (%), by Product Type 2025 & 2033
- Figure 54: South America Air Quality Monitoring Device Market Volume Share (%), by Product Type 2025 & 2033
- Figure 55: South America Air Quality Monitoring Device Market Revenue (Million), by Sampling Method 2025 & 2033
- Figure 56: South America Air Quality Monitoring Device Market Volume (K Units), by Sampling Method 2025 & 2033
- Figure 57: South America Air Quality Monitoring Device Market Revenue Share (%), by Sampling Method 2025 & 2033
- Figure 58: South America Air Quality Monitoring Device Market Volume Share (%), by Sampling Method 2025 & 2033
- Figure 59: South America Air Quality Monitoring Device Market Revenue (Million), by End User 2025 & 2033
- Figure 60: South America Air Quality Monitoring Device Market Volume (K Units), by End User 2025 & 2033
- Figure 61: South America Air Quality Monitoring Device Market Revenue Share (%), by End User 2025 & 2033
- Figure 62: South America Air Quality Monitoring Device Market Volume Share (%), by End User 2025 & 2033
- Figure 63: South America Air Quality Monitoring Device Market Revenue (Million), by Country 2025 & 2033
- Figure 64: South America Air Quality Monitoring Device Market Volume (K Units), by Country 2025 & 2033
- Figure 65: South America Air Quality Monitoring Device Market Revenue Share (%), by Country 2025 & 2033
- Figure 66: South America Air Quality Monitoring Device Market Volume Share (%), by Country 2025 & 2033
- Figure 67: Middle East and Africa Air Quality Monitoring Device Market Revenue (Million), by Product Type 2025 & 2033
- Figure 68: Middle East and Africa Air Quality Monitoring Device Market Volume (K Units), by Product Type 2025 & 2033
- Figure 69: Middle East and Africa Air Quality Monitoring Device Market Revenue Share (%), by Product Type 2025 & 2033
- Figure 70: Middle East and Africa Air Quality Monitoring Device Market Volume Share (%), by Product Type 2025 & 2033
- Figure 71: Middle East and Africa Air Quality Monitoring Device Market Revenue (Million), by Sampling Method 2025 & 2033
- Figure 72: Middle East and Africa Air Quality Monitoring Device Market Volume (K Units), by Sampling Method 2025 & 2033
- Figure 73: Middle East and Africa Air Quality Monitoring Device Market Revenue Share (%), by Sampling Method 2025 & 2033
- Figure 74: Middle East and Africa Air Quality Monitoring Device Market Volume Share (%), by Sampling Method 2025 & 2033
- Figure 75: Middle East and Africa Air Quality Monitoring Device Market Revenue (Million), by End User 2025 & 2033
- Figure 76: Middle East and Africa Air Quality Monitoring Device Market Volume (K Units), by End User 2025 & 2033
- Figure 77: Middle East and Africa Air Quality Monitoring Device Market Revenue Share (%), by End User 2025 & 2033
- Figure 78: Middle East and Africa Air Quality Monitoring Device Market Volume Share (%), by End User 2025 & 2033
- Figure 79: Middle East and Africa Air Quality Monitoring Device Market Revenue (Million), by Country 2025 & 2033
- Figure 80: Middle East and Africa Air Quality Monitoring Device Market Volume (K Units), by Country 2025 & 2033
- Figure 81: Middle East and Africa Air Quality Monitoring Device Market Revenue Share (%), by Country 2025 & 2033
- Figure 82: Middle East and Africa Air Quality Monitoring Device Market Volume Share (%), by Country 2025 & 2033
List of Tables
- Table 1: Global Air Quality Monitoring Device Market Revenue Million Forecast, by Product Type 2020 & 2033
- Table 2: Global Air Quality Monitoring Device Market Volume K Units Forecast, by Product Type 2020 & 2033
- Table 3: Global Air Quality Monitoring Device Market Revenue Million Forecast, by Sampling Method 2020 & 2033
- Table 4: Global Air Quality Monitoring Device Market Volume K Units Forecast, by Sampling Method 2020 & 2033
- Table 5: Global Air Quality Monitoring Device Market Revenue Million Forecast, by End User 2020 & 2033
- Table 6: Global Air Quality Monitoring Device Market Volume K Units Forecast, by End User 2020 & 2033
- Table 7: Global Air Quality Monitoring Device Market Revenue Million Forecast, by Region 2020 & 2033
- Table 8: Global Air Quality Monitoring Device Market Volume K Units Forecast, by Region 2020 & 2033
- Table 9: Global Air Quality Monitoring Device Market Revenue Million Forecast, by Product Type 2020 & 2033
- Table 10: Global Air Quality Monitoring Device Market Volume K Units Forecast, by Product Type 2020 & 2033
- Table 11: Global Air Quality Monitoring Device Market Revenue Million Forecast, by Sampling Method 2020 & 2033
- Table 12: Global Air Quality Monitoring Device Market Volume K Units Forecast, by Sampling Method 2020 & 2033
- Table 13: Global Air Quality Monitoring Device Market Revenue Million Forecast, by End User 2020 & 2033
- Table 14: Global Air Quality Monitoring Device Market Volume K Units Forecast, by End User 2020 & 2033
- Table 15: Global Air Quality Monitoring Device Market Revenue Million Forecast, by Country 2020 & 2033
- Table 16: Global Air Quality Monitoring Device Market Volume K Units Forecast, by Country 2020 & 2033
- Table 17: United States Air Quality Monitoring Device Market Revenue (Million) Forecast, by Application 2020 & 2033
- Table 18: United States Air Quality Monitoring Device Market Volume (K Units) Forecast, by Application 2020 & 2033
- Table 19: Canada Air Quality Monitoring Device Market Revenue (Million) Forecast, by Application 2020 & 2033
- Table 20: Canada Air Quality Monitoring Device Market Volume (K Units) Forecast, by Application 2020 & 2033
- Table 21: Rest of the North America Air Quality Monitoring Device Market Revenue (Million) Forecast, by Application 2020 & 2033
- Table 22: Rest of the North America Air Quality Monitoring Device Market Volume (K Units) Forecast, by Application 2020 & 2033
- Table 23: Global Air Quality Monitoring Device Market Revenue Million Forecast, by Product Type 2020 & 2033
- Table 24: Global Air Quality Monitoring Device Market Volume K Units Forecast, by Product Type 2020 & 2033
- Table 25: Global Air Quality Monitoring Device Market Revenue Million Forecast, by Sampling Method 2020 & 2033
- Table 26: Global Air Quality Monitoring Device Market Volume K Units Forecast, by Sampling Method 2020 & 2033
- Table 27: Global Air Quality Monitoring Device Market Revenue Million Forecast, by End User 2020 & 2033
- Table 28: Global Air Quality Monitoring Device Market Volume K Units Forecast, by End User 2020 & 2033
- Table 29: Global Air Quality Monitoring Device Market Revenue Million Forecast, by Country 2020 & 2033
- Table 30: Global Air Quality Monitoring Device Market Volume K Units Forecast, by Country 2020 & 2033
- Table 31: United Kingdom Air Quality Monitoring Device Market Revenue (Million) Forecast, by Application 2020 & 2033
- Table 32: United Kingdom Air Quality Monitoring Device Market Volume (K Units) Forecast, by Application 2020 & 2033
- Table 33: Spain Air Quality Monitoring Device Market Revenue (Million) Forecast, by Application 2020 & 2033
- Table 34: Spain Air Quality Monitoring Device Market Volume (K Units) Forecast, by Application 2020 & 2033
- Table 35: Germany Air Quality Monitoring Device Market Revenue (Million) Forecast, by Application 2020 & 2033
- Table 36: Germany Air Quality Monitoring Device Market Volume (K Units) Forecast, by Application 2020 & 2033
- Table 37: Italy Air Quality Monitoring Device Market Revenue (Million) Forecast, by Application 2020 & 2033
- Table 38: Italy Air Quality Monitoring Device Market Volume (K Units) Forecast, by Application 2020 & 2033
- Table 39: Global Air Quality Monitoring Device Market Revenue Million Forecast, by Product Type 2020 & 2033
- Table 40: Global Air Quality Monitoring Device Market Volume K Units Forecast, by Product Type 2020 & 2033
- Table 41: Global Air Quality Monitoring Device Market Revenue Million Forecast, by Sampling Method 2020 & 2033
- Table 42: Global Air Quality Monitoring Device Market Volume K Units Forecast, by Sampling Method 2020 & 2033
- Table 43: Global Air Quality Monitoring Device Market Revenue Million Forecast, by End User 2020 & 2033
- Table 44: Global Air Quality Monitoring Device Market Volume K Units Forecast, by End User 2020 & 2033
- Table 45: Global Air Quality Monitoring Device Market Revenue Million Forecast, by Country 2020 & 2033
- Table 46: Global Air Quality Monitoring Device Market Volume K Units Forecast, by Country 2020 & 2033
- Table 47: China Air Quality Monitoring Device Market Revenue (Million) Forecast, by Application 2020 & 2033
- Table 48: China Air Quality Monitoring Device Market Volume (K Units) Forecast, by Application 2020 & 2033
- Table 49: Japan Air Quality Monitoring Device Market Revenue (Million) Forecast, by Application 2020 & 2033
- Table 50: Japan Air Quality Monitoring Device Market Volume (K Units) Forecast, by Application 2020 & 2033
- Table 51: Vietnam Air Quality Monitoring Device Market Revenue (Million) Forecast, by Application 2020 & 2033
- Table 52: Vietnam Air Quality Monitoring Device Market Volume (K Units) Forecast, by Application 2020 & 2033
- Table 53: India Air Quality Monitoring Device Market Revenue (Million) Forecast, by Application 2020 & 2033
- Table 54: India Air Quality Monitoring Device Market Volume (K Units) Forecast, by Application 2020 & 2033
- Table 55: Australia and New Zealand Air Quality Monitoring Device Market Revenue (Million) Forecast, by Application 2020 & 2033
- Table 56: Australia and New Zealand Air Quality Monitoring Device Market Volume (K Units) Forecast, by Application 2020 & 2033
- Table 57: Global Air Quality Monitoring Device Market Revenue Million Forecast, by Product Type 2020 & 2033
- Table 58: Global Air Quality Monitoring Device Market Volume K Units Forecast, by Product Type 2020 & 2033
- Table 59: Global Air Quality Monitoring Device Market Revenue Million Forecast, by Sampling Method 2020 & 2033
- Table 60: Global Air Quality Monitoring Device Market Volume K Units Forecast, by Sampling Method 2020 & 2033
- Table 61: Global Air Quality Monitoring Device Market Revenue Million Forecast, by End User 2020 & 2033
- Table 62: Global Air Quality Monitoring Device Market Volume K Units Forecast, by End User 2020 & 2033
- Table 63: Global Air Quality Monitoring Device Market Revenue Million Forecast, by Country 2020 & 2033
- Table 64: Global Air Quality Monitoring Device Market Volume K Units Forecast, by Country 2020 & 2033
- Table 65: Brazil Air Quality Monitoring Device Market Revenue (Million) Forecast, by Application 2020 & 2033
- Table 66: Brazil Air Quality Monitoring Device Market Volume (K Units) Forecast, by Application 2020 & 2033
- Table 67: Argentina Air Quality Monitoring Device Market Revenue (Million) Forecast, by Application 2020 & 2033
- Table 68: Argentina Air Quality Monitoring Device Market Volume (K Units) Forecast, by Application 2020 & 2033
- Table 69: Global Air Quality Monitoring Device Market Revenue Million Forecast, by Product Type 2020 & 2033
- Table 70: Global Air Quality Monitoring Device Market Volume K Units Forecast, by Product Type 2020 & 2033
- Table 71: Global Air Quality Monitoring Device Market Revenue Million Forecast, by Sampling Method 2020 & 2033
- Table 72: Global Air Quality Monitoring Device Market Volume K Units Forecast, by Sampling Method 2020 & 2033
- Table 73: Global Air Quality Monitoring Device Market Revenue Million Forecast, by End User 2020 & 2033
- Table 74: Global Air Quality Monitoring Device Market Volume K Units Forecast, by End User 2020 & 2033
- Table 75: Global Air Quality Monitoring Device Market Revenue Million Forecast, by Country 2020 & 2033
- Table 76: Global Air Quality Monitoring Device Market Volume K Units Forecast, by Country 2020 & 2033
- Table 77: United Arab Emirates Air Quality Monitoring Device Market Revenue (Million) Forecast, by Application 2020 & 2033
- Table 78: United Arab Emirates Air Quality Monitoring Device Market Volume (K Units) Forecast, by Application 2020 & 2033
- Table 79: South Africa Air Quality Monitoring Device Market Revenue (Million) Forecast, by Application 2020 & 2033
- Table 80: South Africa Air Quality Monitoring Device Market Volume (K Units) Forecast, by Application 2020 & 2033
- Table 81: Saudi Arabia Air Quality Monitoring Device Market Revenue (Million) Forecast, by Application 2020 & 2033
- Table 82: Saudi Arabia Air Quality Monitoring Device Market Volume (K Units) Forecast, by Application 2020 & 2033
- Table 83: Iraq Air Quality Monitoring Device Market Revenue (Million) Forecast, by Application 2020 & 2033
- Table 84: Iraq Air Quality Monitoring Device Market Volume (K Units) Forecast, by Application 2020 & 2033
Frequently Asked Questions
1. What is the projected Compound Annual Growth Rate (CAGR) of the Air Quality Monitoring Device Market?
The projected CAGR is approximately 5.79%.
2. Which companies are prominent players in the Air Quality Monitoring Device Market?
Key companies in the market include Honeywell International Inc, MicroJet Technology Co Ltd, Horiba Ltd, Merck KGaA, TSI Inc, Thermo Fisher Scientific Inc, Hawa Dawa GmbH, Emerson Electric Co, Siemens AG, Agilent Technologies Inc, 3M Co, Teledyne Technologies Inc.
3. What are the main segments of the Air Quality Monitoring Device Market?
The market segments include Product Type, Sampling Method, End User.
4. Can you provide details about the market size?
The market size is estimated to be USD 5.08 Million as of 2022.
5. What are some drivers contributing to market growth?
4.; Supportive Government Policies to Regulate Air Pollution4.; Expansion of Industrialization Across the World.
6. What are the notable trends driving market growth?
The Outdoor Monitor Segment is Expected to be the Fastest-growing Segment.
7. Are there any restraints impacting market growth?
4.; The Penetration of Cleaner Energy Sources Like Renewables and Nuclear Power.
8. Can you provide examples of recent developments in the market?
In March 2023, Tyndall participated in a new European project aiming to improve air quality monitoring. It is a group member that has received EC (European Commission) funds to research air quality monitoring. The Tyndall National Institute for Research and Development in Microtechnologies (IMT) in Bucharest will lead the initiative, which will benefit from the experience of research institutions in Ireland and Italy.
9. What pricing options are available for accessing the report?
Pricing options include single-user, multi-user, and enterprise licenses priced at USD 4750, USD 5250, and USD 8750 respectively.
10. Is the market size provided in terms of value or volume?
The market size is provided in terms of value, measured in Million and volume, measured in K Units.
11. Are there any specific market keywords associated with the report?
Yes, the market keyword associated with the report is "Air Quality Monitoring Device Market," which aids in identifying and referencing the specific market segment covered.
12. How do I determine which pricing option suits my needs best?
The pricing options vary based on user requirements and access needs. Individual users may opt for single-user licenses, while businesses requiring broader access may choose multi-user or enterprise licenses for cost-effective access to the report.
13. Are there any additional resources or data provided in the Air Quality Monitoring Device Market report?
While the report offers comprehensive insights, it's advisable to review the specific contents or supplementary materials provided to ascertain if additional resources or data are available.
14. How can I stay updated on further developments or reports in the Air Quality Monitoring Device Market?
To stay informed about further developments, trends, and reports in the Air Quality Monitoring Device Market, consider subscribing to industry newsletters, following relevant companies and organizations, or regularly checking reputable industry news sources and publications.
Methodology
Step 1 - Identification of Relevant Samples Size from Population Database


Step 2 - Approaches for Defining Global Market Size (Value, Volume* & Price*)

Note*: In applicable scenarios
Step 3 - Data Sources
Primary Research
- Web Analytics
- Survey Reports
- Research Institute
- Latest Research Reports
- Opinion Leaders
Secondary Research
- Annual Reports
- White Paper
- Latest Press Release
- Industry Association
- Paid Database
- Investor Presentations

Step 4 - Data Triangulation
Involves using different sources of information in order to increase the validity of a study
These sources are likely to be stakeholders in a program - participants, other researchers, program staff, other community members, and so on.
Then we put all data in single framework & apply various statistical tools to find out the dynamic on the market.
During the analysis stage, feedback from the stakeholder groups would be compared to determine areas of agreement as well as areas of divergence