

Key Insights
The air taxi industry is poised for explosive growth, projected to reach a market size of $1.41 billion in 2025 and experience a compound annual growth rate (CAGR) of 23.32% from 2025 to 2033. Several factors are driving this expansion. Increasing urbanization and traffic congestion in major metropolitan areas are fueling demand for faster and more efficient transportation solutions. Technological advancements in electric vertical takeoff and landing (eVTOL) aircraft, coupled with the development of robust air traffic management systems, are overcoming previous limitations and making air taxis a viable reality. Furthermore, the rising adoption of autonomous flight technology promises to further reduce costs and enhance safety, attracting both passengers and investors. While regulatory hurdles and high initial investment costs remain challenges, ongoing collaboration between governments, manufacturers, and technology companies is paving the way for broader commercialization. The industry is segmented by mode of operation, with piloted and autonomous options vying for market share. North America and Europe are currently leading the market, but rapid development in Asia-Pacific suggests significant future growth in this region, driven by burgeoning economies and large populations in dense urban areas. The key players in this dynamic market include established aerospace giants like Boeing and Airbus, as well as innovative startups like Lilium and Joby Aviation, demonstrating the breadth of innovation and competition.
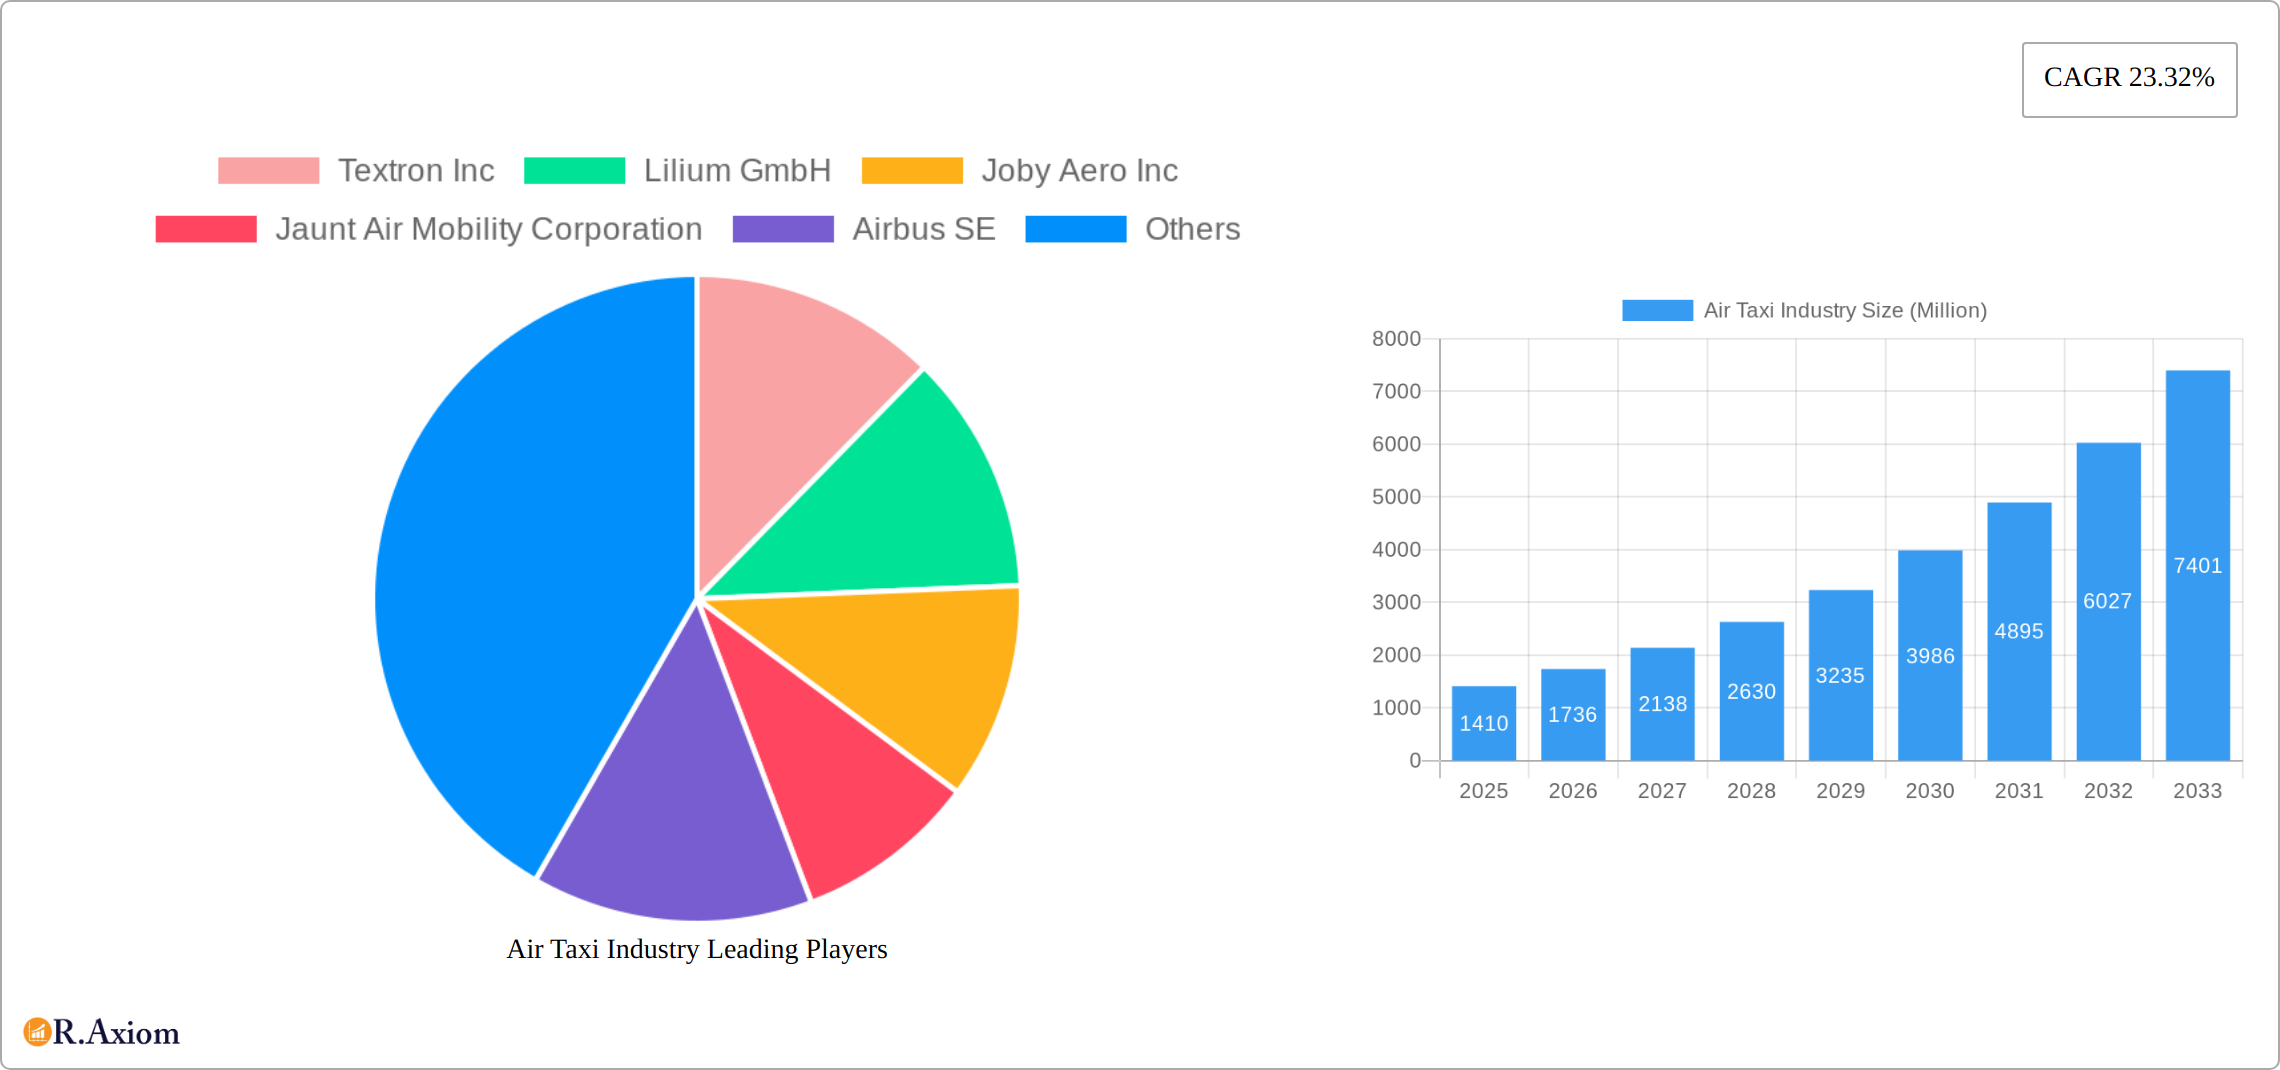
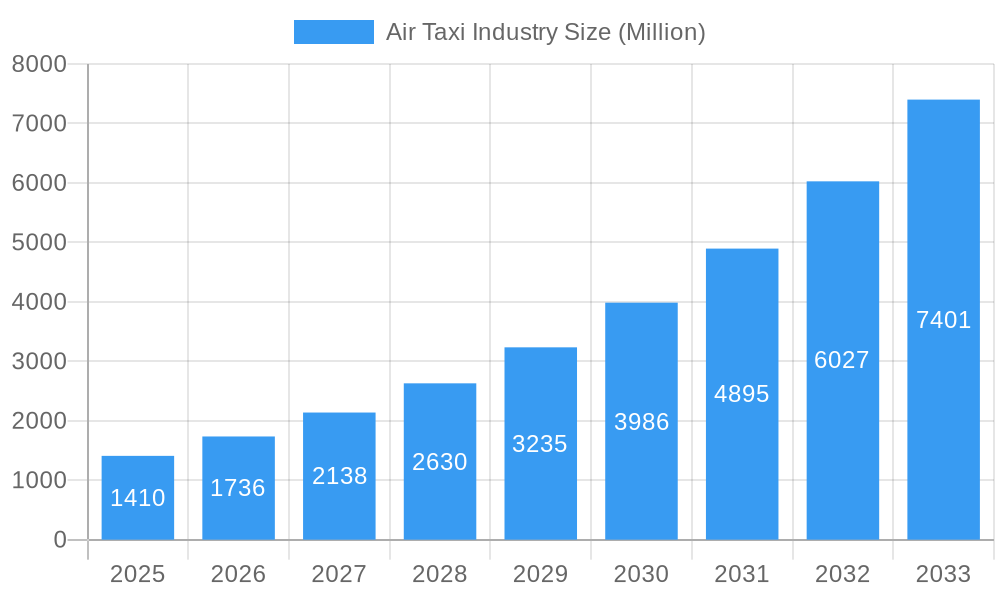
Air Taxi Industry Market Size (In Billion)
The forecast period (2025-2033) will witness a substantial increase in the number of air taxi operations, spurred by increasing investment in infrastructure and technological maturation. The transition from piloted to autonomous operations will be a major factor influencing market growth, presenting both opportunities and challenges. Autonomous operations promise greater efficiency and cost reductions, but necessitate overcoming significant safety and regulatory concerns. Regional variations in regulatory landscapes and infrastructure development will impact the pace of adoption, with regions featuring supportive regulatory environments and robust investment in charging infrastructure experiencing faster growth. Competitive pressures will drive innovation in aircraft design, battery technology, and operational efficiency, leading to a more affordable and accessible air taxi service. Continued focus on safety protocols and public perception will be critical to ensuring the sustainable and successful development of this transformative transportation sector.
Air Taxi Industry Company Market Share
This comprehensive report provides an in-depth analysis of the burgeoning air taxi industry, projecting robust growth from 2025 to 2033. We delve into market concentration, technological advancements, regulatory landscapes, and key players shaping this transformative sector. The report is invaluable for investors, industry stakeholders, and anyone seeking to understand the future of urban and regional air mobility.
Air Taxi Industry Market Concentration & Innovation
This section analyzes the competitive landscape of the air taxi industry, encompassing market concentration, innovation drivers, regulatory frameworks, and M&A activities. The study period covers 2019-2033, with 2025 as the base and estimated year. The market exhibits moderate concentration, with several key players vying for dominance. While precise market share figures for each player fluctuate, Textron Inc, Joby Aero Inc, Airbus SE, and The Boeing Company currently hold significant portions of the market. Lilium GmbH, Volocopter GmbH, and Wisk Aero LL are also emerging as major forces. Guangzhou EHang Intelligent Technology Co Ltd and Hyundai Motor Company are further expanding their presence.
- Innovation Drivers: Advancements in battery technology, autonomous flight systems, and vertical takeoff and landing (VTOL) aircraft design are key drivers of innovation.
- Regulatory Frameworks: The evolving regulatory landscape plays a significant role, with varying certifications and airspace management policies across regions.
- Product Substitutes: Helicopters and traditional air travel remain substitutes, though air taxis offer the potential for faster, more convenient, and potentially cheaper point-to-point travel.
- End-User Trends: Growing urban populations, increasing demand for faster commute options, and rising disposable incomes are fueling end-user demand.
- M&A Activities: The industry has witnessed significant M&A activity, with deal values exceeding $xx Million in the historical period (2019-2024). This trend is expected to continue, driving consolidation and technological integration.
Air Taxi Industry Industry Trends & Insights
The air taxi industry is poised for explosive growth, fueled by advancements in technology and a shift in consumer preferences towards faster, more convenient, and sustainable urban transportation. While market penetration remains relatively low, projections indicate a substantial Compound Annual Growth Rate (CAGR) of [Insert Projected CAGR]% from 2025 to 2033. This anticipated surge is contingent upon the development of robust infrastructure and the streamlining of regulatory approvals.
Several key factors are driving this market expansion:
- Technological Disruptions: The development of electric Vertical Take-Off and Landing (eVTOL) aircraft, sophisticated autonomous flight systems, and increasingly efficient battery technology are revolutionizing air travel. Improvements in these areas are crucial to reducing operating costs and increasing flight range and reliability.
- Evolving Consumer Preferences: In densely populated urban areas grappling with significant traffic congestion, the demand for rapid, convenient, and environmentally friendly transportation options is rapidly increasing. Air taxis offer a compelling solution to this challenge.
- Competitive Landscape: A dynamic competitive landscape, characterized by both established aerospace giants and innovative startups, is fostering a culture of rapid innovation and cost reduction. Strategic alliances and collaborative partnerships are becoming increasingly prevalent, accelerating technological advancements and market penetration.
- Economic Factors: Rising disposable incomes in urban centers, coupled with the escalating costs of ground-based transportation, further fuel the demand for air taxi services. This makes air taxis a potentially cost-effective alternative for time-sensitive commuters.
- Regulatory Support: Government initiatives promoting Urban Air Mobility (UAM) and offering incentives for technological innovation are accelerating the adoption of air taxi services. Clearer regulatory frameworks are also essential for building public confidence and ensuring safety standards.
Dominant Markets & Segments in Air Taxi Industry
The North American and European markets are currently leading in air taxi adoption, driven by robust investor interest and supportive regulatory environments. However, Asia-Pacific is poised for significant growth. Within the operating modes, the Piloted segment is currently dominant, though the Autonomous segment is expected to see substantial growth towards the latter half of the forecast period.
Key Drivers for Dominance:
- North America: Strong government support for innovation, substantial venture capital investment, and a well-established aerospace ecosystem.
- Europe: Focus on sustainable urban air mobility (UAM) initiatives, supportive regulatory frameworks (though still evolving), and growing environmental awareness.
- Asia-Pacific: Rapid urbanization, rising disposable incomes, and government initiatives promoting technological advancement.
Mode of Operation:
- Piloted: The current market leader due to safety concerns and regulatory requirements. However, its growth rate is expected to decelerate as the autonomous sector advances.
- Autonomous: Shows significant potential for future growth, offering reduced operational costs and potentially increased efficiency. However, regulatory hurdles and safety considerations need to be addressed before widespread adoption.
Air Taxi Industry Product Developments
Significant advancements are being made in air taxi technology, including improved battery technology for longer flight ranges, enhanced autonomous flight control systems, and quieter, more efficient propulsion systems. This leads to increased safety, lower operating costs, and better passenger experience. Moreover, air taxi designs are evolving to incorporate features enhancing comfort, passenger capacity, and overall flight performance, to cater to various market needs.
Report Scope & Segmentation Analysis
This report segments the air taxi market by Mode of Operation: Piloted and Autonomous. The Piloted segment is currently larger, with a market size of $xx Million in 2025, while the Autonomous segment is at $xx Million, projected to increase rapidly during the forecast period (2025-2033). Competition is intense in both segments, but the Autonomous segment offers considerable growth potential, attracting significant investment and technological advancements. The competitive dynamics are shaped by technological capabilities, regulatory approvals, and access to capital.
Key Drivers of Air Taxi Industry Growth
Several key factors are driving the growth of the air taxi industry:
- Technological advancements: Improvements in battery technology, VTOL aircraft design, and autonomous flight systems are crucial.
- Economic factors: Rising disposable incomes in urban areas and the high cost of ground transportation are fueling demand.
- Regulatory support: Government initiatives promoting UAM and providing incentives for innovation are accelerating adoption.
Challenges in the Air Taxi Industry Sector
Despite the promising outlook, several challenges hinder the widespread adoption of air taxi services:
- Regulatory Hurdles: The development of comprehensive safety regulations and advanced air traffic management systems is critical to ensuring the safe and efficient operation of air taxis. Harmonizing regulations across different jurisdictions remains a significant obstacle.
- Supply Chain Constraints: Securing a reliable supply of essential components and a skilled workforce is crucial for scaling production and meeting growing demand. The industry faces potential bottlenecks in sourcing specialized materials and trained personnel.
- High Initial Investment Costs: The development and deployment of air taxi technology require substantial financial investment. This high capital expenditure can create a barrier to entry for smaller companies and limit market expansion.
- Infrastructure Development: The establishment of vertiports and other necessary infrastructure is essential for the operational viability of air taxi services. This requires significant upfront investment and careful urban planning.
- Public Perception and Acceptance: Building public trust and acceptance of air taxi technology is essential for widespread adoption. Addressing concerns about noise pollution, safety, and environmental impact is crucial.
Emerging Opportunities in Air Taxi Industry
The air taxi industry presents a wealth of exciting opportunities for future growth and expansion:
- Expansion into New Markets: Developing economies with rapidly expanding urban populations represent significant untapped potential for air taxi services. These markets offer opportunities for growth and innovation.
- Integration with Existing Transportation Networks: Seamless integration with existing public transportation systems, such as metro lines and bus networks, can greatly enhance the efficiency and convenience of air taxi services.
- Development of New Applications: Beyond passenger transport, air taxis have the potential to revolutionize various sectors, including medical transportation, package delivery, and tourism, offering unique advantages in speed and accessibility.
- Advanced Air Mobility Ecosystem: The development of a comprehensive Advanced Air Mobility (AAM) ecosystem encompassing vertiports, air traffic management systems, and maintenance infrastructure will accelerate the industry's growth and maturation.
Leading Players in the Air Taxi Industry Market
- Textron Inc
- Lilium GmbH
- Joby Aero Inc
- Jaunt Air Mobility Corporation
- Airbus SE
- Hyundai Motor Company
- Volocopter GmbH
- Wisk Aero LL
- Guangzhou EHang Intelligent Technology Co Ltd
- The Boeing Company
Key Developments in Air Taxi Industry Industry
- 2022-03: Joby Aero secures FAA approval for its electric VTOL aircraft design.
- 2023-06: Volocopter conducts a successful public air taxi demonstration flight.
- 2024-10: Airbus partners with several cities to develop air taxi infrastructure.
- 2025-02: Lilium GmbH announces a significant order of its electric VTOL aircraft from a major airline.
Strategic Outlook for Air Taxi Industry Market
The air taxi industry is poised for substantial growth, driven by technological innovation and increasing demand for efficient urban transportation. The focus will be on overcoming regulatory hurdles, improving safety standards, optimizing operational efficiency, and scaling production to meet growing demand. Partnerships across the industry and integration with other transportation modes will be key strategies for market success. This is expected to lead to the development of a sustainable and economically viable air taxi ecosystem over the next decade.
Air Taxi Industry Segmentation
-
1. Mode of Operation
- 1.1. Piloted
- 1.2. Autonomous
Air Taxi Industry Segmentation By Geography
-
1. North America
- 1.1. United States
- 1.2. Canada
-
2. Europe
- 2.1. Germany
- 2.2. United Kingdom
- 2.3. France
- 2.4. Russia
- 2.5. Rest of Europe
-
3. Asia Pacific
- 3.1. India
- 3.2. China
- 3.3. Japan
- 3.4. South Korea
- 3.5. Australia
- 3.6. Rest of Asia Pacific
-
4. Latin America
- 4.1. Brazil
- 4.2. Mexico
- 4.3. Rest of Latin America
-
5. Middle East and Africa
- 5.1. Saudi Arabia
- 5.2. Egypt
- 5.3. Israel
- 5.4. Rest of Middle East and Africa
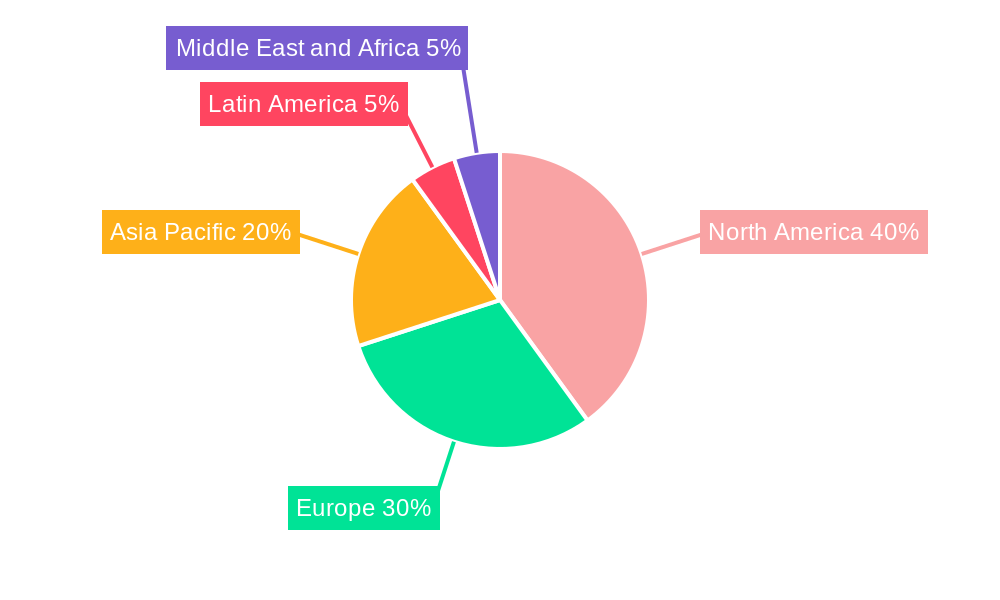
Air Taxi Industry Regional Market Share
Geographic Coverage of Air Taxi Industry
Air Taxi Industry REPORT HIGHLIGHTS
| Aspects | Details |
|---|---|
| Study Period | 2020-2034 |
| Base Year | 2025 |
| Estimated Year | 2026 |
| Forecast Period | 2026-2034 |
| Historical Period | 2020-2025 |
| Growth Rate | CAGR of 23.32% from 2020-2034 |
| Segmentation |
|
Table of Contents
- 1. Introduction
- 1.1. Research Scope
- 1.2. Market Segmentation
- 1.3. Research Objective
- 1.4. Definitions and Assumptions
- 2. Executive Summary
- 2.1. Market Snapshot
- 3. Market Dynamics
- 3.1. Market Drivers
- 3.2. Market Restrains
- 3.3. Market Trends
- 3.4. Market Opportunities
- 4. Market Factor Analysis
- 4.1. Porters Five Forces
- 4.1.1. Bargaining Power of Suppliers
- 4.1.2. Bargaining Power of Buyers
- 4.1.3. Threat of New Entrants
- 4.1.4. Threat of Substitutes
- 4.1.5. Competitive Rivalry
- 4.2. PESTEL analysis
- 4.3. BCG Analysis
- 4.3.1. Stars (High Growth, High Market Share)
- 4.3.2. Cash Cows (Low Growth, High Market Share)
- 4.3.3. Question Mark (High Growth, Low Market Share)
- 4.3.4. Dogs (Low Growth, Low Market Share)
- 4.4. Ansoff Matrix Analysis
- 4.5. Supply Chain Analysis
- 4.6. Regulatory Landscape
- 4.7. Current Market Potential and Opportunity Assessment (TAM–SAM–SOM Framework)
- 4.8. RAX Analyst Note
- 4.1. Porters Five Forces
- 5. Market Analysis, Insights and Forecast 2021-2033
- 5.1. Market Analysis, Insights and Forecast - by Mode of Operation
- 5.1.1. Piloted
- 5.1.2. Autonomous
- 5.2. Market Analysis, Insights and Forecast - by Region
- 5.2.1. North America
- 5.2.2. Europe
- 5.2.3. Asia Pacific
- 5.2.4. Latin America
- 5.2.5. Middle East and Africa
- 5.1. Market Analysis, Insights and Forecast - by Mode of Operation
- 6. Global Air Taxi Industry Analysis, Insights and Forecast, 2021-2033
- 6.1. Market Analysis, Insights and Forecast - by Mode of Operation
- 6.1.1. Piloted
- 6.1.2. Autonomous
- 6.1. Market Analysis, Insights and Forecast - by Mode of Operation
- 7. North America Air Taxi Industry Analysis, Insights and Forecast, 2020-2032
- 7.1. Market Analysis, Insights and Forecast - by Mode of Operation
- 7.1.1. Piloted
- 7.1.2. Autonomous
- 7.1. Market Analysis, Insights and Forecast - by Mode of Operation
- 8. Europe Air Taxi Industry Analysis, Insights and Forecast, 2020-2032
- 8.1. Market Analysis, Insights and Forecast - by Mode of Operation
- 8.1.1. Piloted
- 8.1.2. Autonomous
- 8.1. Market Analysis, Insights and Forecast - by Mode of Operation
- 9. Asia Pacific Air Taxi Industry Analysis, Insights and Forecast, 2020-2032
- 9.1. Market Analysis, Insights and Forecast - by Mode of Operation
- 9.1.1. Piloted
- 9.1.2. Autonomous
- 9.1. Market Analysis, Insights and Forecast - by Mode of Operation
- 10. Latin America Air Taxi Industry Analysis, Insights and Forecast, 2020-2032
- 10.1. Market Analysis, Insights and Forecast - by Mode of Operation
- 10.1.1. Piloted
- 10.1.2. Autonomous
- 10.1. Market Analysis, Insights and Forecast - by Mode of Operation
- 11. Middle East and Africa Air Taxi Industry Analysis, Insights and Forecast, 2020-2032
- 11.1. Market Analysis, Insights and Forecast - by Mode of Operation
- 11.1.1. Piloted
- 11.1.2. Autonomous
- 11.1. Market Analysis, Insights and Forecast - by Mode of Operation
- 12. Competitive Analysis
- 12.1. Company Profiles
- 12.1.1 Textron Inc
- 12.1.1.1. Company Overview
- 12.1.1.2. Products
- 12.1.1.3. Company Financials
- 12.1.1.4. SWOT Analysis
- 12.1.2 Lilium GmbH
- 12.1.2.1. Company Overview
- 12.1.2.2. Products
- 12.1.2.3. Company Financials
- 12.1.2.4. SWOT Analysis
- 12.1.3 Joby Aero Inc
- 12.1.3.1. Company Overview
- 12.1.3.2. Products
- 12.1.3.3. Company Financials
- 12.1.3.4. SWOT Analysis
- 12.1.4 Jaunt Air Mobility Corporation
- 12.1.4.1. Company Overview
- 12.1.4.2. Products
- 12.1.4.3. Company Financials
- 12.1.4.4. SWOT Analysis
- 12.1.5 Airbus SE
- 12.1.5.1. Company Overview
- 12.1.5.2. Products
- 12.1.5.3. Company Financials
- 12.1.5.4. SWOT Analysis
- 12.1.6 Hyundai Motor Company
- 12.1.6.1. Company Overview
- 12.1.6.2. Products
- 12.1.6.3. Company Financials
- 12.1.6.4. SWOT Analysis
- 12.1.7 Volocopter GmbH
- 12.1.7.1. Company Overview
- 12.1.7.2. Products
- 12.1.7.3. Company Financials
- 12.1.7.4. SWOT Analysis
- 12.1.8 Wisk Aero LL
- 12.1.8.1. Company Overview
- 12.1.8.2. Products
- 12.1.8.3. Company Financials
- 12.1.8.4. SWOT Analysis
- 12.1.9 Guangzhou EHang Intelligent Technology Co Ltd
- 12.1.9.1. Company Overview
- 12.1.9.2. Products
- 12.1.9.3. Company Financials
- 12.1.9.4. SWOT Analysis
- 12.1.10 The Boeing Company
- 12.1.10.1. Company Overview
- 12.1.10.2. Products
- 12.1.10.3. Company Financials
- 12.1.10.4. SWOT Analysis
- 12.1.1 Textron Inc
- 12.2. Market Entropy
- 12.2.1 Company's Key Areas Served
- 12.2.2 Recent Developments
- 12.3. Company Market Share Analysis 2025
- 12.3.1 Top 5 Companies Market Share Analysis
- 12.3.2 Top 3 Companies Market Share Analysis
- 12.4. List of Potential Customers
- 13. Research Methodology
List of Figures
- Figure 1: Global Air Taxi Industry Revenue Breakdown (Million, %) by Region 2025 & 2033
- Figure 2: North America Air Taxi Industry Revenue (Million), by Mode of Operation 2025 & 2033
- Figure 3: North America Air Taxi Industry Revenue Share (%), by Mode of Operation 2025 & 2033
- Figure 4: North America Air Taxi Industry Revenue (Million), by Country 2025 & 2033
- Figure 5: North America Air Taxi Industry Revenue Share (%), by Country 2025 & 2033
- Figure 6: Europe Air Taxi Industry Revenue (Million), by Mode of Operation 2025 & 2033
- Figure 7: Europe Air Taxi Industry Revenue Share (%), by Mode of Operation 2025 & 2033
- Figure 8: Europe Air Taxi Industry Revenue (Million), by Country 2025 & 2033
- Figure 9: Europe Air Taxi Industry Revenue Share (%), by Country 2025 & 2033
- Figure 10: Asia Pacific Air Taxi Industry Revenue (Million), by Mode of Operation 2025 & 2033
- Figure 11: Asia Pacific Air Taxi Industry Revenue Share (%), by Mode of Operation 2025 & 2033
- Figure 12: Asia Pacific Air Taxi Industry Revenue (Million), by Country 2025 & 2033
- Figure 13: Asia Pacific Air Taxi Industry Revenue Share (%), by Country 2025 & 2033
- Figure 14: Latin America Air Taxi Industry Revenue (Million), by Mode of Operation 2025 & 2033
- Figure 15: Latin America Air Taxi Industry Revenue Share (%), by Mode of Operation 2025 & 2033
- Figure 16: Latin America Air Taxi Industry Revenue (Million), by Country 2025 & 2033
- Figure 17: Latin America Air Taxi Industry Revenue Share (%), by Country 2025 & 2033
- Figure 18: Middle East and Africa Air Taxi Industry Revenue (Million), by Mode of Operation 2025 & 2033
- Figure 19: Middle East and Africa Air Taxi Industry Revenue Share (%), by Mode of Operation 2025 & 2033
- Figure 20: Middle East and Africa Air Taxi Industry Revenue (Million), by Country 2025 & 2033
- Figure 21: Middle East and Africa Air Taxi Industry Revenue Share (%), by Country 2025 & 2033
List of Tables
- Table 1: Global Air Taxi Industry Revenue Million Forecast, by Mode of Operation 2020 & 2033
- Table 2: Global Air Taxi Industry Revenue Million Forecast, by Region 2020 & 2033
- Table 3: Global Air Taxi Industry Revenue Million Forecast, by Mode of Operation 2020 & 2033
- Table 4: Global Air Taxi Industry Revenue Million Forecast, by Country 2020 & 2033
- Table 5: United States Air Taxi Industry Revenue (Million) Forecast, by Application 2020 & 2033
- Table 6: Canada Air Taxi Industry Revenue (Million) Forecast, by Application 2020 & 2033
- Table 7: Global Air Taxi Industry Revenue Million Forecast, by Mode of Operation 2020 & 2033
- Table 8: Global Air Taxi Industry Revenue Million Forecast, by Country 2020 & 2033
- Table 9: Germany Air Taxi Industry Revenue (Million) Forecast, by Application 2020 & 2033
- Table 10: United Kingdom Air Taxi Industry Revenue (Million) Forecast, by Application 2020 & 2033
- Table 11: France Air Taxi Industry Revenue (Million) Forecast, by Application 2020 & 2033
- Table 12: Russia Air Taxi Industry Revenue (Million) Forecast, by Application 2020 & 2033
- Table 13: Rest of Europe Air Taxi Industry Revenue (Million) Forecast, by Application 2020 & 2033
- Table 14: Global Air Taxi Industry Revenue Million Forecast, by Mode of Operation 2020 & 2033
- Table 15: Global Air Taxi Industry Revenue Million Forecast, by Country 2020 & 2033
- Table 16: India Air Taxi Industry Revenue (Million) Forecast, by Application 2020 & 2033
- Table 17: China Air Taxi Industry Revenue (Million) Forecast, by Application 2020 & 2033
- Table 18: Japan Air Taxi Industry Revenue (Million) Forecast, by Application 2020 & 2033
- Table 19: South Korea Air Taxi Industry Revenue (Million) Forecast, by Application 2020 & 2033
- Table 20: Australia Air Taxi Industry Revenue (Million) Forecast, by Application 2020 & 2033
- Table 21: Rest of Asia Pacific Air Taxi Industry Revenue (Million) Forecast, by Application 2020 & 2033
- Table 22: Global Air Taxi Industry Revenue Million Forecast, by Mode of Operation 2020 & 2033
- Table 23: Global Air Taxi Industry Revenue Million Forecast, by Country 2020 & 2033
- Table 24: Brazil Air Taxi Industry Revenue (Million) Forecast, by Application 2020 & 2033
- Table 25: Mexico Air Taxi Industry Revenue (Million) Forecast, by Application 2020 & 2033
- Table 26: Rest of Latin America Air Taxi Industry Revenue (Million) Forecast, by Application 2020 & 2033
- Table 27: Global Air Taxi Industry Revenue Million Forecast, by Mode of Operation 2020 & 2033
- Table 28: Global Air Taxi Industry Revenue Million Forecast, by Country 2020 & 2033
- Table 29: Saudi Arabia Air Taxi Industry Revenue (Million) Forecast, by Application 2020 & 2033
- Table 30: Egypt Air Taxi Industry Revenue (Million) Forecast, by Application 2020 & 2033
- Table 31: Israel Air Taxi Industry Revenue (Million) Forecast, by Application 2020 & 2033
- Table 32: Rest of Middle East and Africa Air Taxi Industry Revenue (Million) Forecast, by Application 2020 & 2033
Frequently Asked Questions
1. What is the projected Compound Annual Growth Rate (CAGR) of the Air Taxi Industry?
The projected CAGR is approximately 23.32%.
2. Which companies are prominent players in the Air Taxi Industry?
Key companies in the market include Textron Inc, Lilium GmbH, Joby Aero Inc, Jaunt Air Mobility Corporation, Airbus SE, Hyundai Motor Company, Volocopter GmbH, Wisk Aero LL, Guangzhou EHang Intelligent Technology Co Ltd, The Boeing Company.
3. What are the main segments of the Air Taxi Industry?
The market segments include Mode of Operation.
4. Can you provide details about the market size?
The market size is estimated to be USD 1.41 Million as of 2022.
5. What are some drivers contributing to market growth?
N/A
6. What are the notable trends driving market growth?
Piloted Segment to Dominate Market Share During the Forecast Period.
7. Are there any restraints impacting market growth?
N/A
8. Can you provide examples of recent developments in the market?
N/A
9. What pricing options are available for accessing the report?
Pricing options include single-user, multi-user, and enterprise licenses priced at USD 4750, USD 5250, and USD 8750 respectively.
10. Is the market size provided in terms of value or volume?
The market size is provided in terms of value, measured in Million.
11. Are there any specific market keywords associated with the report?
Yes, the market keyword associated with the report is "Air Taxi Industry," which aids in identifying and referencing the specific market segment covered.
12. How do I determine which pricing option suits my needs best?
The pricing options vary based on user requirements and access needs. Individual users may opt for single-user licenses, while businesses requiring broader access may choose multi-user or enterprise licenses for cost-effective access to the report.
13. Are there any additional resources or data provided in the Air Taxi Industry report?
While the report offers comprehensive insights, it's advisable to review the specific contents or supplementary materials provided to ascertain if additional resources or data are available.
14. How can I stay updated on further developments or reports in the Air Taxi Industry?
To stay informed about further developments, trends, and reports in the Air Taxi Industry, consider subscribing to industry newsletters, following relevant companies and organizations, or regularly checking reputable industry news sources and publications.
Methodology
Step 1 - Identification of Relevant Samples Size from Population Database


Step 2 - Approaches for Defining Global Market Size (Value, Volume* & Price*)

Note*: In applicable scenarios
Step 3 - Data Sources
Primary Research
- Web Analytics
- Survey Reports
- Research Institute
- Latest Research Reports
- Opinion Leaders
Secondary Research
- Annual Reports
- White Paper
- Latest Press Release
- Industry Association
- Paid Database
- Investor Presentations

Step 4 - Data Triangulation
Involves using different sources of information in order to increase the validity of a study
These sources are likely to be stakeholders in a program - participants, other researchers, program staff, other community members, and so on.
Then we put all data in single framework & apply various statistical tools to find out the dynamic on the market.
During the analysis stage, feedback from the stakeholder groups would be compared to determine areas of agreement as well as areas of divergence