
Key Insights
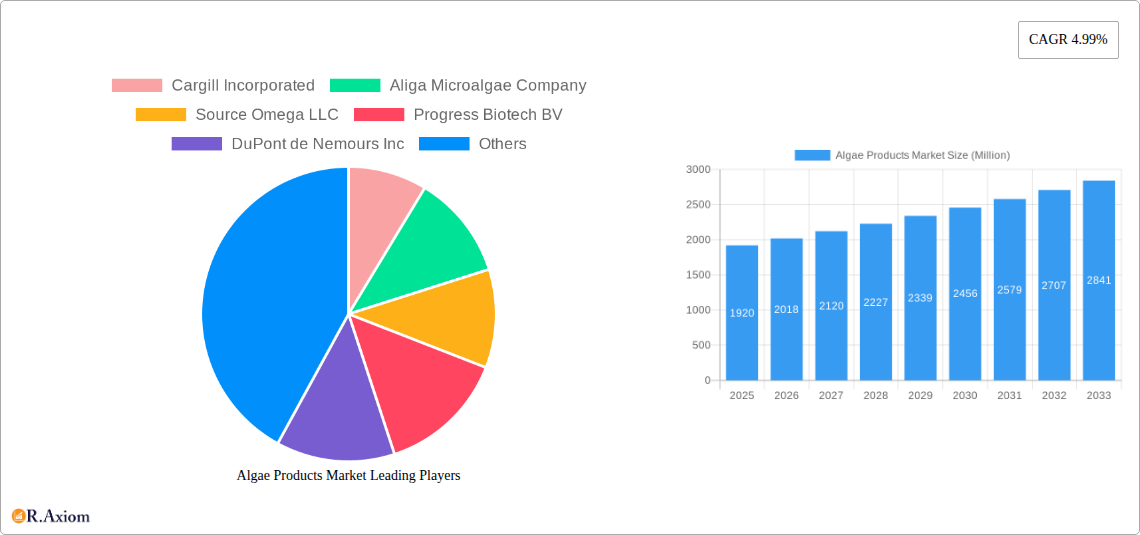
The global algae products market, valued at $1.92 billion in 2025, is projected to experience robust growth, driven by a compound annual growth rate (CAGR) of 4.99% from 2025 to 2033. This expansion is fueled by several key factors. The increasing demand for sustainable and eco-friendly ingredients across diverse sectors, including food and beverage, personal care, and pharmaceuticals, is a major catalyst. Algal-based products offer a compelling alternative to traditional sources, providing a rich source of protein, lipids, and other valuable biomolecules. Furthermore, growing consumer awareness of health and wellness, coupled with the rising popularity of plant-based diets and dietary supplements, is further bolstering market demand. Technological advancements in algae cultivation and extraction techniques are also contributing to improved efficiency and reduced production costs, making algal products more accessible and competitive.
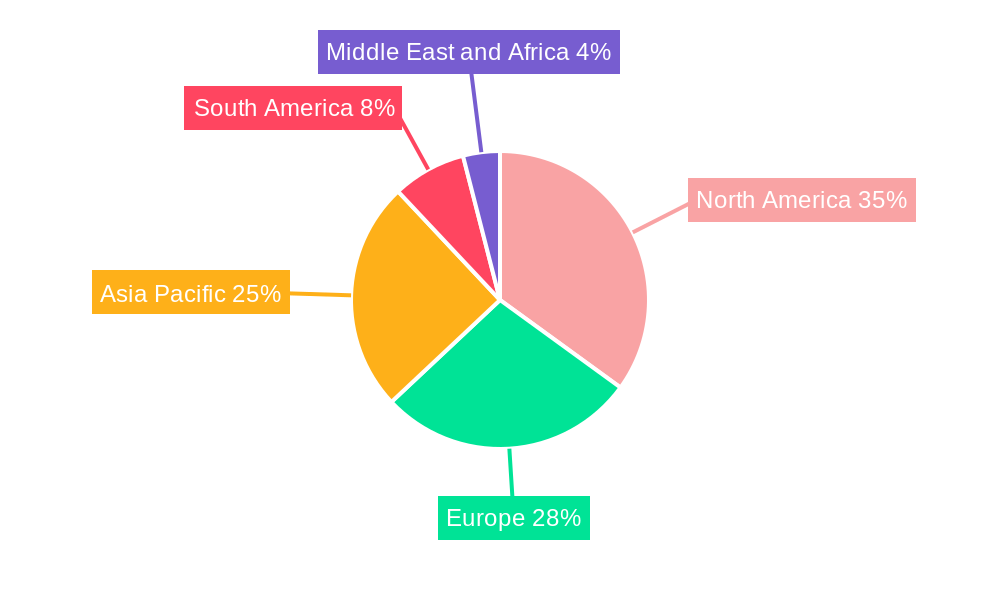
Specific application segments like dietary supplements and personal care are expected to witness particularly strong growth, driven by the functional benefits of algal ingredients and the increasing preference for natural and organic products. Geographical distribution reveals significant market potential in North America and Asia Pacific, regions characterized by high disposable incomes, established health-conscious consumer bases, and burgeoning research and development activities within the algae industry. However, challenges remain, including the relatively high cost of algae cultivation compared to conventional sources and the need for further research to optimize the scalability and efficiency of algae-based production processes. Nevertheless, the long-term outlook for the algae products market remains highly positive, suggesting substantial growth opportunities for existing players and new entrants alike.
Algae Products Market: A Comprehensive Report (2019-2033)
This comprehensive report provides an in-depth analysis of the Algae Products Market, offering valuable insights for industry stakeholders, investors, and researchers. Covering the period from 2019 to 2033, with a focus on 2025, this report meticulously examines market dynamics, segment performance, key players, and future growth prospects. The report utilizes extensive data and analysis to predict market trends and opportunities, aiding strategic decision-making in this rapidly evolving sector. The total market size in 2025 is estimated at xx Million.
Algae Products Market Concentration & Innovation
This section analyzes the Algae Products Market's competitive landscape, focusing on market concentration, innovation drivers, regulatory frameworks, and M&A activities. The market exhibits a moderately consolidated structure with key players like Cargill Incorporated, Cargill Incorporated, Aliga Microalgae Company, Source Omega LLC, Progress Biotech BV, DuPont de Nemours Inc, Archer Daniels Midland Company, BASF SE, Koninklijke DSM N V, Algenol Biotech LLC, Yemoja Ltd, and ACCEL Carrageenan Corporation holding significant market share. However, the presence of numerous smaller players indicates a dynamic market with continuous innovation.
Market Concentration: The top 5 players account for approximately xx% of the global market share in 2025. This signifies a relatively concentrated market. However, a fragmented landscape exists, with several niche players contributing to overall growth.
Innovation Drivers: Technological advancements in algae cultivation, extraction, and processing techniques are crucial innovation drivers. Growing consumer demand for sustainable and healthy products fuels the development of novel algae-based ingredients.
Regulatory Frameworks: Government regulations regarding food safety, environmental sustainability, and the use of algae-derived products significantly impact market growth. Varied regulations across different regions create both opportunities and challenges.
Product Substitutes: The market faces competition from traditional sources of similar products, such as fish oil for omega-3 fatty acids. However, the unique properties of algae-based products, including sustainability and functionality, are key differentiators.
End-User Trends: Increasing consumer awareness of health benefits, coupled with a growing preference for natural and sustainable products, drives demand across various applications.
M&A Activities: Recent mergers and acquisitions, such as Aliga Microalgae's acquisition of a chlorella algae facility in 2022, demonstrate the strategic importance of expanding production capacities and market reach. The total value of M&A deals within the last five years is estimated to be xx Million.
Algae Products Market Industry Trends & Insights
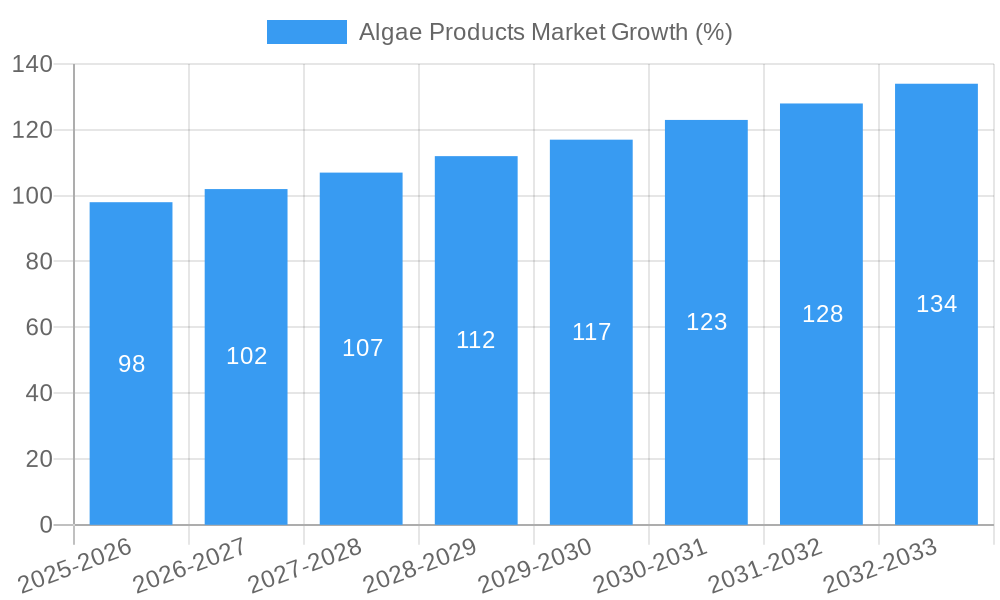
The Algae Products Market is experiencing robust growth, driven by a confluence of factors. The rising global population and increased disposable incomes in emerging economies fuel demand for nutritious food and dietary supplements. Technological advancements in algae cultivation, processing, and downstream applications continue to enhance product quality, efficiency, and cost-effectiveness, leading to wider adoption across various sectors. Consumer preferences for natural and sustainable products are pushing the market toward greener and more eco-friendly algae cultivation methods. The increasing popularity of vegan and vegetarian diets is bolstering the demand for algal protein as a sustainable alternative to animal-based protein sources. The market is expected to exhibit a Compound Annual Growth Rate (CAGR) of xx% during the forecast period (2025-2033), reaching a market size of xx Million by 2033. Market penetration of algae-based products remains relatively low in several application segments, presenting significant future growth opportunities. The competitive dynamics are characterized by both intense competition and strategic collaborations, as companies strive to consolidate their market positions and expand their product portfolios.
Dominant Markets & Segments in Algae Products Market
The Algae Products Market displays considerable regional variation. Asia-Pacific is currently the dominant region, fueled by rapid economic growth, expanding food and beverage industry, and a strong focus on health and wellness.
Key Drivers by Segment:
Source: Brown algae dominates the market due to its high alginate content, widely used as a thickening and gelling agent in various applications.
Product Type: Algal protein is witnessing significant growth owing to its nutritional profile and sustainability benefits. Carrageenan and alginate remain significant market segments due to their wide-ranging applications.
Application: The Food and Beverage segment is currently the largest application area, driven by the increasing demand for functional foods and beverages. However, the Personal Care and Dietary Supplements segments are also exhibiting robust growth.
Dominance Analysis:
The dominance of the Asia-Pacific region is attributed to several factors, including:
- Favorable government policies supporting sustainable agriculture and the development of bio-based industries.
- Extensive infrastructure for food processing and packaging.
- High population density and rising per capita income.
Similarly, the dominance of specific product types and applications is driven by factors such as the unique properties of different algae species, cost-effectiveness, and consumer preferences. Further detailed analysis is provided within the complete report.
Algae Products Market Product Developments
The Algae Products Market is witnessing continuous product innovation, with the development of novel algae-based ingredients and applications. Companies are focusing on improving the scalability and cost-effectiveness of algae cultivation and extraction processes, while enhancing product functionality and expanding into new application areas. Key trends include the development of customized algal protein blends with enhanced nutritional properties, and the incorporation of algae-derived ingredients into innovative food products. The emphasis on sustainability further fuels the development of eco-friendly production methods. These developments are leading to increased market penetration across various sectors.
Report Scope & Segmentation Analysis
This report segments the Algae Products Market based on source (Brown Algae, Red Algae, Green Algae, Blue-green Algae), product type (Algal Protein, Alginate, Carrageenan, Carotenoids, Lipids, Other Product Types), and application (Personal Care, Food and Beverage, Dietary Supplements, Pharmaceuticals, Animal Feed, Other Applications). Each segment's growth projections, market size, and competitive dynamics are thoroughly analyzed. For instance, the Algal Protein segment is projected to experience significant growth due to its potential as a sustainable protein source. The Food and Beverage application segment is expected to remain the largest, driven by increased demand for functional food products. Detailed projections and analysis are provided for each segment in the full report.
Key Drivers of Algae Products Market Growth
The Algae Products Market is driven by several key factors. Firstly, the growing global population and rising demand for nutritious and sustainable food sources create a significant impetus for growth. Secondly, increasing consumer awareness of the health benefits of algae-based products is boosting demand across various applications. Thirdly, technological advancements in algae cultivation, processing, and extraction techniques are improving product quality, efficiency, and cost-effectiveness. Finally, supportive government policies and regulations promoting sustainable agriculture and the development of bio-based industries are furthering market expansion.
Challenges in the Algae Products Market Sector
Despite its growth potential, the Algae Products Market faces several challenges. High production costs associated with algae cultivation and processing remain a major barrier to wider adoption. Fluctuations in raw material prices and inconsistencies in algae quality can impact market stability. Furthermore, the need for rigorous quality control measures to ensure product safety and consistency presents challenges. Finally, competition from traditional sources of similar products necessitates continuous innovation and product differentiation. The potential for adverse weather conditions and unpredictable algae growth also affect production consistency, causing pricing fluctuations.
Emerging Opportunities in Algae Products Market
The Algae Products Market presents several emerging opportunities. The development of novel algae-based products with enhanced functionalities, such as improved digestibility and bioavailability, opens new avenues for market expansion. The exploration of new applications in areas like pharmaceuticals and biofuel production presents further growth potentials. Furthermore, the increasing demand for sustainable and eco-friendly products creates a conducive environment for algae-based solutions. The rising popularity of algae as a sustainable ingredient across various consumer product categories opens up new avenues for market penetration.
Leading Players in the Algae Products Market Market
- Cargill Incorporated
- Aliga Microalgae Company
- Source Omega LLC
- Progress Biotech BV
- DuPont de Nemours Inc
- Archer Daniels Midland Company
- BASF SE
- Koninklijke DSM N V
- Algenol Biotech LLC
- Yemoja Ltd
- ACCEL Carrageenan Corporation
Key Developments in Algae Products Market Industry
- September 2022: Aliga Microalgae acquired a large chlorella algae facility in the Netherlands, expanding its production capacity.
- April 2022: Koninklijke DSM N.V. expanded its 'life' range of algal-sourced omega-3 products with two line extensions.
- September 2021: AAK announced a strategic partnership with Progress Biotech to supply algae-based DHA for infant formula.
Strategic Outlook for Algae Products Market Market
The Algae Products Market is poised for significant growth in the coming years, driven by the confluence of factors discussed throughout this report. Continuous innovation, increasing consumer demand, and supportive government policies will all contribute to market expansion. Companies that can effectively manage production costs, ensure product quality, and cater to evolving consumer preferences will be best positioned to capitalize on the market's potential. The growing focus on sustainability and the exploration of new applications will further fuel market growth and innovation.
Algae Products Market Segmentation
-
1. Source
- 1.1. Brown Algae
- 1.2. Red Algae
- 1.3. Green Algae
- 1.4. Blue-green Algae
-
2. Product Type
- 2.1. Algal Protein
- 2.2. Alginate
- 2.3. Carrageenan
- 2.4. Carotenoids
- 2.5. Lipids
- 2.6. Other Product Types
-
3. Application
- 3.1. Personal Care
- 3.2. Food and Beverage
- 3.3. Dietary Supplements
- 3.4. Pharmaceuticals
- 3.5. Animal Feed
- 3.6. Other Applications
Algae Products Market Segmentation By Geography
-
1. North America
- 1.1. United States
- 1.2. Canada
- 1.3. Mexico
- 1.4. Rest of North America
-
2. Europe
- 2.1. Spain
- 2.2. United Kingdom
- 2.3. Germany
- 2.4. France
- 2.5. Italy
- 2.6. Russia
- 2.7. Rest of Europe
-
3. Asia Pacific
- 3.1. China
- 3.2. Japan
- 3.3. India
- 3.4. Australia
- 3.5. Rest of Asia Pacific
-
4. South America
- 4.1. Brazil
- 4.2. Argentina
- 4.3. Rest of South America
-
5. Middle East and Africa
- 5.1. South Africa
- 5.2. United Arab Emirates
- 5.3. Rest of Middle East and Africa
Algae Products Market REPORT HIGHLIGHTS
| Aspects | Details |
|---|---|
| Study Period | 2019-2033 |
| Base Year | 2024 |
| Estimated Year | 2025 |
| Forecast Period | 2025-2033 |
| Historical Period | 2019-2024 |
| Growth Rate | CAGR of 4.99% from 2019-2033 |
| Segmentation |
|
Table of Contents
- 1. Introduction
- 1.1. Research Scope
- 1.2. Market Segmentation
- 1.3. Research Methodology
- 1.4. Definitions and Assumptions
- 2. Executive Summary
- 2.1. Introduction
- 3. Market Dynamics
- 3.1. Introduction
- 3.2. Market Drivers
- 3.2.1. Increasing Demand for Processed Food Products; Technological Advancements Supporting Market Growth
- 3.3. Market Restrains
- 3.3.1. Increasing Cost of Production Due to Rise in Energy and Labor Cost
- 3.4. Market Trends
- 3.4.1. Health Benefits Associated With Algae Products' Consumption
- 4. Market Factor Analysis
- 4.1. Porters Five Forces
- 4.2. Supply/Value Chain
- 4.3. PESTEL analysis
- 4.4. Market Entropy
- 4.5. Patent/Trademark Analysis
- 5. Global Algae Products Market Analysis, Insights and Forecast, 2019-2031
- 5.1. Market Analysis, Insights and Forecast - by Source
- 5.1.1. Brown Algae
- 5.1.2. Red Algae
- 5.1.3. Green Algae
- 5.1.4. Blue-green Algae
- 5.2. Market Analysis, Insights and Forecast - by Product Type
- 5.2.1. Algal Protein
- 5.2.2. Alginate
- 5.2.3. Carrageenan
- 5.2.4. Carotenoids
- 5.2.5. Lipids
- 5.2.6. Other Product Types
- 5.3. Market Analysis, Insights and Forecast - by Application
- 5.3.1. Personal Care
- 5.3.2. Food and Beverage
- 5.3.3. Dietary Supplements
- 5.3.4. Pharmaceuticals
- 5.3.5. Animal Feed
- 5.3.6. Other Applications
- 5.4. Market Analysis, Insights and Forecast - by Region
- 5.4.1. North America
- 5.4.2. Europe
- 5.4.3. Asia Pacific
- 5.4.4. South America
- 5.4.5. Middle East and Africa
- 5.1. Market Analysis, Insights and Forecast - by Source
- 6. North America Algae Products Market Analysis, Insights and Forecast, 2019-2031
- 6.1. Market Analysis, Insights and Forecast - by Source
- 6.1.1. Brown Algae
- 6.1.2. Red Algae
- 6.1.3. Green Algae
- 6.1.4. Blue-green Algae
- 6.2. Market Analysis, Insights and Forecast - by Product Type
- 6.2.1. Algal Protein
- 6.2.2. Alginate
- 6.2.3. Carrageenan
- 6.2.4. Carotenoids
- 6.2.5. Lipids
- 6.2.6. Other Product Types
- 6.3. Market Analysis, Insights and Forecast - by Application
- 6.3.1. Personal Care
- 6.3.2. Food and Beverage
- 6.3.3. Dietary Supplements
- 6.3.4. Pharmaceuticals
- 6.3.5. Animal Feed
- 6.3.6. Other Applications
- 6.1. Market Analysis, Insights and Forecast - by Source
- 7. Europe Algae Products Market Analysis, Insights and Forecast, 2019-2031
- 7.1. Market Analysis, Insights and Forecast - by Source
- 7.1.1. Brown Algae
- 7.1.2. Red Algae
- 7.1.3. Green Algae
- 7.1.4. Blue-green Algae
- 7.2. Market Analysis, Insights and Forecast - by Product Type
- 7.2.1. Algal Protein
- 7.2.2. Alginate
- 7.2.3. Carrageenan
- 7.2.4. Carotenoids
- 7.2.5. Lipids
- 7.2.6. Other Product Types
- 7.3. Market Analysis, Insights and Forecast - by Application
- 7.3.1. Personal Care
- 7.3.2. Food and Beverage
- 7.3.3. Dietary Supplements
- 7.3.4. Pharmaceuticals
- 7.3.5. Animal Feed
- 7.3.6. Other Applications
- 7.1. Market Analysis, Insights and Forecast - by Source
- 8. Asia Pacific Algae Products Market Analysis, Insights and Forecast, 2019-2031
- 8.1. Market Analysis, Insights and Forecast - by Source
- 8.1.1. Brown Algae
- 8.1.2. Red Algae
- 8.1.3. Green Algae
- 8.1.4. Blue-green Algae
- 8.2. Market Analysis, Insights and Forecast - by Product Type
- 8.2.1. Algal Protein
- 8.2.2. Alginate
- 8.2.3. Carrageenan
- 8.2.4. Carotenoids
- 8.2.5. Lipids
- 8.2.6. Other Product Types
- 8.3. Market Analysis, Insights and Forecast - by Application
- 8.3.1. Personal Care
- 8.3.2. Food and Beverage
- 8.3.3. Dietary Supplements
- 8.3.4. Pharmaceuticals
- 8.3.5. Animal Feed
- 8.3.6. Other Applications
- 8.1. Market Analysis, Insights and Forecast - by Source
- 9. South America Algae Products Market Analysis, Insights and Forecast, 2019-2031
- 9.1. Market Analysis, Insights and Forecast - by Source
- 9.1.1. Brown Algae
- 9.1.2. Red Algae
- 9.1.3. Green Algae
- 9.1.4. Blue-green Algae
- 9.2. Market Analysis, Insights and Forecast - by Product Type
- 9.2.1. Algal Protein
- 9.2.2. Alginate
- 9.2.3. Carrageenan
- 9.2.4. Carotenoids
- 9.2.5. Lipids
- 9.2.6. Other Product Types
- 9.3. Market Analysis, Insights and Forecast - by Application
- 9.3.1. Personal Care
- 9.3.2. Food and Beverage
- 9.3.3. Dietary Supplements
- 9.3.4. Pharmaceuticals
- 9.3.5. Animal Feed
- 9.3.6. Other Applications
- 9.1. Market Analysis, Insights and Forecast - by Source
- 10. Middle East and Africa Algae Products Market Analysis, Insights and Forecast, 2019-2031
- 10.1. Market Analysis, Insights and Forecast - by Source
- 10.1.1. Brown Algae
- 10.1.2. Red Algae
- 10.1.3. Green Algae
- 10.1.4. Blue-green Algae
- 10.2. Market Analysis, Insights and Forecast - by Product Type
- 10.2.1. Algal Protein
- 10.2.2. Alginate
- 10.2.3. Carrageenan
- 10.2.4. Carotenoids
- 10.2.5. Lipids
- 10.2.6. Other Product Types
- 10.3. Market Analysis, Insights and Forecast - by Application
- 10.3.1. Personal Care
- 10.3.2. Food and Beverage
- 10.3.3. Dietary Supplements
- 10.3.4. Pharmaceuticals
- 10.3.5. Animal Feed
- 10.3.6. Other Applications
- 10.1. Market Analysis, Insights and Forecast - by Source
- 11. North America Algae Products Market Analysis, Insights and Forecast, 2019-2031
- 11.1. Market Analysis, Insights and Forecast - By Country/Sub-region
- 11.1.1 United States
- 11.1.2 Canada
- 11.1.3 Mexico
- 11.1.4 Rest of North America
- 12. Europe Algae Products Market Analysis, Insights and Forecast, 2019-2031
- 12.1. Market Analysis, Insights and Forecast - By Country/Sub-region
- 12.1.1 Spain
- 12.1.2 United Kingdom
- 12.1.3 Germany
- 12.1.4 France
- 12.1.5 Italy
- 12.1.6 Russia
- 12.1.7 Rest of Europe
- 13. Asia Pacific Algae Products Market Analysis, Insights and Forecast, 2019-2031
- 13.1. Market Analysis, Insights and Forecast - By Country/Sub-region
- 13.1.1 China
- 13.1.2 Japan
- 13.1.3 India
- 13.1.4 Australia
- 13.1.5 Rest of Asia Pacific
- 14. South America Algae Products Market Analysis, Insights and Forecast, 2019-2031
- 14.1. Market Analysis, Insights and Forecast - By Country/Sub-region
- 14.1.1 Brazil
- 14.1.2 Argentina
- 14.1.3 Rest of South America
- 15. Middle East and Africa Algae Products Market Analysis, Insights and Forecast, 2019-2031
- 15.1. Market Analysis, Insights and Forecast - By Country/Sub-region
- 15.1.1 South Africa
- 15.1.2 United Arab Emirates
- 15.1.3 Rest of Middle East and Africa
- 16. Competitive Analysis
- 16.1. Global Market Share Analysis 2024
- 16.2. Company Profiles
- 16.2.1 Cargill Incorporated
- 16.2.1.1. Overview
- 16.2.1.2. Products
- 16.2.1.3. SWOT Analysis
- 16.2.1.4. Recent Developments
- 16.2.1.5. Financials (Based on Availability)
- 16.2.2 Aliga Microalgae Company
- 16.2.2.1. Overview
- 16.2.2.2. Products
- 16.2.2.3. SWOT Analysis
- 16.2.2.4. Recent Developments
- 16.2.2.5. Financials (Based on Availability)
- 16.2.3 Source Omega LLC
- 16.2.3.1. Overview
- 16.2.3.2. Products
- 16.2.3.3. SWOT Analysis
- 16.2.3.4. Recent Developments
- 16.2.3.5. Financials (Based on Availability)
- 16.2.4 Progress Biotech BV
- 16.2.4.1. Overview
- 16.2.4.2. Products
- 16.2.4.3. SWOT Analysis
- 16.2.4.4. Recent Developments
- 16.2.4.5. Financials (Based on Availability)
- 16.2.5 DuPont de Nemours Inc
- 16.2.5.1. Overview
- 16.2.5.2. Products
- 16.2.5.3. SWOT Analysis
- 16.2.5.4. Recent Developments
- 16.2.5.5. Financials (Based on Availability)
- 16.2.6 Archer Daniels Midland Company
- 16.2.6.1. Overview
- 16.2.6.2. Products
- 16.2.6.3. SWOT Analysis
- 16.2.6.4. Recent Developments
- 16.2.6.5. Financials (Based on Availability)
- 16.2.7 BASF SE
- 16.2.7.1. Overview
- 16.2.7.2. Products
- 16.2.7.3. SWOT Analysis
- 16.2.7.4. Recent Developments
- 16.2.7.5. Financials (Based on Availability)
- 16.2.8 Koninklijke DSM N V
- 16.2.8.1. Overview
- 16.2.8.2. Products
- 16.2.8.3. SWOT Analysis
- 16.2.8.4. Recent Developments
- 16.2.8.5. Financials (Based on Availability)
- 16.2.9 Algenol Biotech LLC*List Not Exhaustive
- 16.2.9.1. Overview
- 16.2.9.2. Products
- 16.2.9.3. SWOT Analysis
- 16.2.9.4. Recent Developments
- 16.2.9.5. Financials (Based on Availability)
- 16.2.10 Yemoja Ltd
- 16.2.10.1. Overview
- 16.2.10.2. Products
- 16.2.10.3. SWOT Analysis
- 16.2.10.4. Recent Developments
- 16.2.10.5. Financials (Based on Availability)
- 16.2.11 ACCEL Carrageenan Corporation
- 16.2.11.1. Overview
- 16.2.11.2. Products
- 16.2.11.3. SWOT Analysis
- 16.2.11.4. Recent Developments
- 16.2.11.5. Financials (Based on Availability)
- 16.2.1 Cargill Incorporated
List of Figures
- Figure 1: Global Algae Products Market Revenue Breakdown (Million, %) by Region 2024 & 2032
- Figure 2: Global Algae Products Market Volume Breakdown (k Tons, %) by Region 2024 & 2032
- Figure 3: North America Algae Products Market Revenue (Million), by Country 2024 & 2032
- Figure 4: North America Algae Products Market Volume (k Tons), by Country 2024 & 2032
- Figure 5: North America Algae Products Market Revenue Share (%), by Country 2024 & 2032
- Figure 6: North America Algae Products Market Volume Share (%), by Country 2024 & 2032
- Figure 7: Europe Algae Products Market Revenue (Million), by Country 2024 & 2032
- Figure 8: Europe Algae Products Market Volume (k Tons), by Country 2024 & 2032
- Figure 9: Europe Algae Products Market Revenue Share (%), by Country 2024 & 2032
- Figure 10: Europe Algae Products Market Volume Share (%), by Country 2024 & 2032
- Figure 11: Asia Pacific Algae Products Market Revenue (Million), by Country 2024 & 2032
- Figure 12: Asia Pacific Algae Products Market Volume (k Tons), by Country 2024 & 2032
- Figure 13: Asia Pacific Algae Products Market Revenue Share (%), by Country 2024 & 2032
- Figure 14: Asia Pacific Algae Products Market Volume Share (%), by Country 2024 & 2032
- Figure 15: South America Algae Products Market Revenue (Million), by Country 2024 & 2032
- Figure 16: South America Algae Products Market Volume (k Tons), by Country 2024 & 2032
- Figure 17: South America Algae Products Market Revenue Share (%), by Country 2024 & 2032
- Figure 18: South America Algae Products Market Volume Share (%), by Country 2024 & 2032
- Figure 19: Middle East and Africa Algae Products Market Revenue (Million), by Country 2024 & 2032
- Figure 20: Middle East and Africa Algae Products Market Volume (k Tons), by Country 2024 & 2032
- Figure 21: Middle East and Africa Algae Products Market Revenue Share (%), by Country 2024 & 2032
- Figure 22: Middle East and Africa Algae Products Market Volume Share (%), by Country 2024 & 2032
- Figure 23: North America Algae Products Market Revenue (Million), by Source 2024 & 2032
- Figure 24: North America Algae Products Market Volume (k Tons), by Source 2024 & 2032
- Figure 25: North America Algae Products Market Revenue Share (%), by Source 2024 & 2032
- Figure 26: North America Algae Products Market Volume Share (%), by Source 2024 & 2032
- Figure 27: North America Algae Products Market Revenue (Million), by Product Type 2024 & 2032
- Figure 28: North America Algae Products Market Volume (k Tons), by Product Type 2024 & 2032
- Figure 29: North America Algae Products Market Revenue Share (%), by Product Type 2024 & 2032
- Figure 30: North America Algae Products Market Volume Share (%), by Product Type 2024 & 2032
- Figure 31: North America Algae Products Market Revenue (Million), by Application 2024 & 2032
- Figure 32: North America Algae Products Market Volume (k Tons), by Application 2024 & 2032
- Figure 33: North America Algae Products Market Revenue Share (%), by Application 2024 & 2032
- Figure 34: North America Algae Products Market Volume Share (%), by Application 2024 & 2032
- Figure 35: North America Algae Products Market Revenue (Million), by Country 2024 & 2032
- Figure 36: North America Algae Products Market Volume (k Tons), by Country 2024 & 2032
- Figure 37: North America Algae Products Market Revenue Share (%), by Country 2024 & 2032
- Figure 38: North America Algae Products Market Volume Share (%), by Country 2024 & 2032
- Figure 39: Europe Algae Products Market Revenue (Million), by Source 2024 & 2032
- Figure 40: Europe Algae Products Market Volume (k Tons), by Source 2024 & 2032
- Figure 41: Europe Algae Products Market Revenue Share (%), by Source 2024 & 2032
- Figure 42: Europe Algae Products Market Volume Share (%), by Source 2024 & 2032
- Figure 43: Europe Algae Products Market Revenue (Million), by Product Type 2024 & 2032
- Figure 44: Europe Algae Products Market Volume (k Tons), by Product Type 2024 & 2032
- Figure 45: Europe Algae Products Market Revenue Share (%), by Product Type 2024 & 2032
- Figure 46: Europe Algae Products Market Volume Share (%), by Product Type 2024 & 2032
- Figure 47: Europe Algae Products Market Revenue (Million), by Application 2024 & 2032
- Figure 48: Europe Algae Products Market Volume (k Tons), by Application 2024 & 2032
- Figure 49: Europe Algae Products Market Revenue Share (%), by Application 2024 & 2032
- Figure 50: Europe Algae Products Market Volume Share (%), by Application 2024 & 2032
- Figure 51: Europe Algae Products Market Revenue (Million), by Country 2024 & 2032
- Figure 52: Europe Algae Products Market Volume (k Tons), by Country 2024 & 2032
- Figure 53: Europe Algae Products Market Revenue Share (%), by Country 2024 & 2032
- Figure 54: Europe Algae Products Market Volume Share (%), by Country 2024 & 2032
- Figure 55: Asia Pacific Algae Products Market Revenue (Million), by Source 2024 & 2032
- Figure 56: Asia Pacific Algae Products Market Volume (k Tons), by Source 2024 & 2032
- Figure 57: Asia Pacific Algae Products Market Revenue Share (%), by Source 2024 & 2032
- Figure 58: Asia Pacific Algae Products Market Volume Share (%), by Source 2024 & 2032
- Figure 59: Asia Pacific Algae Products Market Revenue (Million), by Product Type 2024 & 2032
- Figure 60: Asia Pacific Algae Products Market Volume (k Tons), by Product Type 2024 & 2032
- Figure 61: Asia Pacific Algae Products Market Revenue Share (%), by Product Type 2024 & 2032
- Figure 62: Asia Pacific Algae Products Market Volume Share (%), by Product Type 2024 & 2032
- Figure 63: Asia Pacific Algae Products Market Revenue (Million), by Application 2024 & 2032
- Figure 64: Asia Pacific Algae Products Market Volume (k Tons), by Application 2024 & 2032
- Figure 65: Asia Pacific Algae Products Market Revenue Share (%), by Application 2024 & 2032
- Figure 66: Asia Pacific Algae Products Market Volume Share (%), by Application 2024 & 2032
- Figure 67: Asia Pacific Algae Products Market Revenue (Million), by Country 2024 & 2032
- Figure 68: Asia Pacific Algae Products Market Volume (k Tons), by Country 2024 & 2032
- Figure 69: Asia Pacific Algae Products Market Revenue Share (%), by Country 2024 & 2032
- Figure 70: Asia Pacific Algae Products Market Volume Share (%), by Country 2024 & 2032
- Figure 71: South America Algae Products Market Revenue (Million), by Source 2024 & 2032
- Figure 72: South America Algae Products Market Volume (k Tons), by Source 2024 & 2032
- Figure 73: South America Algae Products Market Revenue Share (%), by Source 2024 & 2032
- Figure 74: South America Algae Products Market Volume Share (%), by Source 2024 & 2032
- Figure 75: South America Algae Products Market Revenue (Million), by Product Type 2024 & 2032
- Figure 76: South America Algae Products Market Volume (k Tons), by Product Type 2024 & 2032
- Figure 77: South America Algae Products Market Revenue Share (%), by Product Type 2024 & 2032
- Figure 78: South America Algae Products Market Volume Share (%), by Product Type 2024 & 2032
- Figure 79: South America Algae Products Market Revenue (Million), by Application 2024 & 2032
- Figure 80: South America Algae Products Market Volume (k Tons), by Application 2024 & 2032
- Figure 81: South America Algae Products Market Revenue Share (%), by Application 2024 & 2032
- Figure 82: South America Algae Products Market Volume Share (%), by Application 2024 & 2032
- Figure 83: South America Algae Products Market Revenue (Million), by Country 2024 & 2032
- Figure 84: South America Algae Products Market Volume (k Tons), by Country 2024 & 2032
- Figure 85: South America Algae Products Market Revenue Share (%), by Country 2024 & 2032
- Figure 86: South America Algae Products Market Volume Share (%), by Country 2024 & 2032
- Figure 87: Middle East and Africa Algae Products Market Revenue (Million), by Source 2024 & 2032
- Figure 88: Middle East and Africa Algae Products Market Volume (k Tons), by Source 2024 & 2032
- Figure 89: Middle East and Africa Algae Products Market Revenue Share (%), by Source 2024 & 2032
- Figure 90: Middle East and Africa Algae Products Market Volume Share (%), by Source 2024 & 2032
- Figure 91: Middle East and Africa Algae Products Market Revenue (Million), by Product Type 2024 & 2032
- Figure 92: Middle East and Africa Algae Products Market Volume (k Tons), by Product Type 2024 & 2032
- Figure 93: Middle East and Africa Algae Products Market Revenue Share (%), by Product Type 2024 & 2032
- Figure 94: Middle East and Africa Algae Products Market Volume Share (%), by Product Type 2024 & 2032
- Figure 95: Middle East and Africa Algae Products Market Revenue (Million), by Application 2024 & 2032
- Figure 96: Middle East and Africa Algae Products Market Volume (k Tons), by Application 2024 & 2032
- Figure 97: Middle East and Africa Algae Products Market Revenue Share (%), by Application 2024 & 2032
- Figure 98: Middle East and Africa Algae Products Market Volume Share (%), by Application 2024 & 2032
- Figure 99: Middle East and Africa Algae Products Market Revenue (Million), by Country 2024 & 2032
- Figure 100: Middle East and Africa Algae Products Market Volume (k Tons), by Country 2024 & 2032
- Figure 101: Middle East and Africa Algae Products Market Revenue Share (%), by Country 2024 & 2032
- Figure 102: Middle East and Africa Algae Products Market Volume Share (%), by Country 2024 & 2032
List of Tables
- Table 1: Global Algae Products Market Revenue Million Forecast, by Region 2019 & 2032
- Table 2: Global Algae Products Market Volume k Tons Forecast, by Region 2019 & 2032
- Table 3: Global Algae Products Market Revenue Million Forecast, by Source 2019 & 2032
- Table 4: Global Algae Products Market Volume k Tons Forecast, by Source 2019 & 2032
- Table 5: Global Algae Products Market Revenue Million Forecast, by Product Type 2019 & 2032
- Table 6: Global Algae Products Market Volume k Tons Forecast, by Product Type 2019 & 2032
- Table 7: Global Algae Products Market Revenue Million Forecast, by Application 2019 & 2032
- Table 8: Global Algae Products Market Volume k Tons Forecast, by Application 2019 & 2032
- Table 9: Global Algae Products Market Revenue Million Forecast, by Region 2019 & 2032
- Table 10: Global Algae Products Market Volume k Tons Forecast, by Region 2019 & 2032
- Table 11: Global Algae Products Market Revenue Million Forecast, by Country 2019 & 2032
- Table 12: Global Algae Products Market Volume k Tons Forecast, by Country 2019 & 2032
- Table 13: United States Algae Products Market Revenue (Million) Forecast, by Application 2019 & 2032
- Table 14: United States Algae Products Market Volume (k Tons) Forecast, by Application 2019 & 2032
- Table 15: Canada Algae Products Market Revenue (Million) Forecast, by Application 2019 & 2032
- Table 16: Canada Algae Products Market Volume (k Tons) Forecast, by Application 2019 & 2032
- Table 17: Mexico Algae Products Market Revenue (Million) Forecast, by Application 2019 & 2032
- Table 18: Mexico Algae Products Market Volume (k Tons) Forecast, by Application 2019 & 2032
- Table 19: Rest of North America Algae Products Market Revenue (Million) Forecast, by Application 2019 & 2032
- Table 20: Rest of North America Algae Products Market Volume (k Tons) Forecast, by Application 2019 & 2032
- Table 21: Global Algae Products Market Revenue Million Forecast, by Country 2019 & 2032
- Table 22: Global Algae Products Market Volume k Tons Forecast, by Country 2019 & 2032
- Table 23: Spain Algae Products Market Revenue (Million) Forecast, by Application 2019 & 2032
- Table 24: Spain Algae Products Market Volume (k Tons) Forecast, by Application 2019 & 2032
- Table 25: United Kingdom Algae Products Market Revenue (Million) Forecast, by Application 2019 & 2032
- Table 26: United Kingdom Algae Products Market Volume (k Tons) Forecast, by Application 2019 & 2032
- Table 27: Germany Algae Products Market Revenue (Million) Forecast, by Application 2019 & 2032
- Table 28: Germany Algae Products Market Volume (k Tons) Forecast, by Application 2019 & 2032
- Table 29: France Algae Products Market Revenue (Million) Forecast, by Application 2019 & 2032
- Table 30: France Algae Products Market Volume (k Tons) Forecast, by Application 2019 & 2032
- Table 31: Italy Algae Products Market Revenue (Million) Forecast, by Application 2019 & 2032
- Table 32: Italy Algae Products Market Volume (k Tons) Forecast, by Application 2019 & 2032
- Table 33: Russia Algae Products Market Revenue (Million) Forecast, by Application 2019 & 2032
- Table 34: Russia Algae Products Market Volume (k Tons) Forecast, by Application 2019 & 2032
- Table 35: Rest of Europe Algae Products Market Revenue (Million) Forecast, by Application 2019 & 2032
- Table 36: Rest of Europe Algae Products Market Volume (k Tons) Forecast, by Application 2019 & 2032
- Table 37: Global Algae Products Market Revenue Million Forecast, by Country 2019 & 2032
- Table 38: Global Algae Products Market Volume k Tons Forecast, by Country 2019 & 2032
- Table 39: China Algae Products Market Revenue (Million) Forecast, by Application 2019 & 2032
- Table 40: China Algae Products Market Volume (k Tons) Forecast, by Application 2019 & 2032
- Table 41: Japan Algae Products Market Revenue (Million) Forecast, by Application 2019 & 2032
- Table 42: Japan Algae Products Market Volume (k Tons) Forecast, by Application 2019 & 2032
- Table 43: India Algae Products Market Revenue (Million) Forecast, by Application 2019 & 2032
- Table 44: India Algae Products Market Volume (k Tons) Forecast, by Application 2019 & 2032
- Table 45: Australia Algae Products Market Revenue (Million) Forecast, by Application 2019 & 2032
- Table 46: Australia Algae Products Market Volume (k Tons) Forecast, by Application 2019 & 2032
- Table 47: Rest of Asia Pacific Algae Products Market Revenue (Million) Forecast, by Application 2019 & 2032
- Table 48: Rest of Asia Pacific Algae Products Market Volume (k Tons) Forecast, by Application 2019 & 2032
- Table 49: Global Algae Products Market Revenue Million Forecast, by Country 2019 & 2032
- Table 50: Global Algae Products Market Volume k Tons Forecast, by Country 2019 & 2032
- Table 51: Brazil Algae Products Market Revenue (Million) Forecast, by Application 2019 & 2032
- Table 52: Brazil Algae Products Market Volume (k Tons) Forecast, by Application 2019 & 2032
- Table 53: Argentina Algae Products Market Revenue (Million) Forecast, by Application 2019 & 2032
- Table 54: Argentina Algae Products Market Volume (k Tons) Forecast, by Application 2019 & 2032
- Table 55: Rest of South America Algae Products Market Revenue (Million) Forecast, by Application 2019 & 2032
- Table 56: Rest of South America Algae Products Market Volume (k Tons) Forecast, by Application 2019 & 2032
- Table 57: Global Algae Products Market Revenue Million Forecast, by Country 2019 & 2032
- Table 58: Global Algae Products Market Volume k Tons Forecast, by Country 2019 & 2032
- Table 59: South Africa Algae Products Market Revenue (Million) Forecast, by Application 2019 & 2032
- Table 60: South Africa Algae Products Market Volume (k Tons) Forecast, by Application 2019 & 2032
- Table 61: United Arab Emirates Algae Products Market Revenue (Million) Forecast, by Application 2019 & 2032
- Table 62: United Arab Emirates Algae Products Market Volume (k Tons) Forecast, by Application 2019 & 2032
- Table 63: Rest of Middle East and Africa Algae Products Market Revenue (Million) Forecast, by Application 2019 & 2032
- Table 64: Rest of Middle East and Africa Algae Products Market Volume (k Tons) Forecast, by Application 2019 & 2032
- Table 65: Global Algae Products Market Revenue Million Forecast, by Source 2019 & 2032
- Table 66: Global Algae Products Market Volume k Tons Forecast, by Source 2019 & 2032
- Table 67: Global Algae Products Market Revenue Million Forecast, by Product Type 2019 & 2032
- Table 68: Global Algae Products Market Volume k Tons Forecast, by Product Type 2019 & 2032
- Table 69: Global Algae Products Market Revenue Million Forecast, by Application 2019 & 2032
- Table 70: Global Algae Products Market Volume k Tons Forecast, by Application 2019 & 2032
- Table 71: Global Algae Products Market Revenue Million Forecast, by Country 2019 & 2032
- Table 72: Global Algae Products Market Volume k Tons Forecast, by Country 2019 & 2032
- Table 73: United States Algae Products Market Revenue (Million) Forecast, by Application 2019 & 2032
- Table 74: United States Algae Products Market Volume (k Tons) Forecast, by Application 2019 & 2032
- Table 75: Canada Algae Products Market Revenue (Million) Forecast, by Application 2019 & 2032
- Table 76: Canada Algae Products Market Volume (k Tons) Forecast, by Application 2019 & 2032
- Table 77: Mexico Algae Products Market Revenue (Million) Forecast, by Application 2019 & 2032
- Table 78: Mexico Algae Products Market Volume (k Tons) Forecast, by Application 2019 & 2032
- Table 79: Rest of North America Algae Products Market Revenue (Million) Forecast, by Application 2019 & 2032
- Table 80: Rest of North America Algae Products Market Volume (k Tons) Forecast, by Application 2019 & 2032
- Table 81: Global Algae Products Market Revenue Million Forecast, by Source 2019 & 2032
- Table 82: Global Algae Products Market Volume k Tons Forecast, by Source 2019 & 2032
- Table 83: Global Algae Products Market Revenue Million Forecast, by Product Type 2019 & 2032
- Table 84: Global Algae Products Market Volume k Tons Forecast, by Product Type 2019 & 2032
- Table 85: Global Algae Products Market Revenue Million Forecast, by Application 2019 & 2032
- Table 86: Global Algae Products Market Volume k Tons Forecast, by Application 2019 & 2032
- Table 87: Global Algae Products Market Revenue Million Forecast, by Country 2019 & 2032
- Table 88: Global Algae Products Market Volume k Tons Forecast, by Country 2019 & 2032
- Table 89: Spain Algae Products Market Revenue (Million) Forecast, by Application 2019 & 2032
- Table 90: Spain Algae Products Market Volume (k Tons) Forecast, by Application 2019 & 2032
- Table 91: United Kingdom Algae Products Market Revenue (Million) Forecast, by Application 2019 & 2032
- Table 92: United Kingdom Algae Products Market Volume (k Tons) Forecast, by Application 2019 & 2032
- Table 93: Germany Algae Products Market Revenue (Million) Forecast, by Application 2019 & 2032
- Table 94: Germany Algae Products Market Volume (k Tons) Forecast, by Application 2019 & 2032
- Table 95: France Algae Products Market Revenue (Million) Forecast, by Application 2019 & 2032
- Table 96: France Algae Products Market Volume (k Tons) Forecast, by Application 2019 & 2032
- Table 97: Italy Algae Products Market Revenue (Million) Forecast, by Application 2019 & 2032
- Table 98: Italy Algae Products Market Volume (k Tons) Forecast, by Application 2019 & 2032
- Table 99: Russia Algae Products Market Revenue (Million) Forecast, by Application 2019 & 2032
- Table 100: Russia Algae Products Market Volume (k Tons) Forecast, by Application 2019 & 2032
- Table 101: Rest of Europe Algae Products Market Revenue (Million) Forecast, by Application 2019 & 2032
- Table 102: Rest of Europe Algae Products Market Volume (k Tons) Forecast, by Application 2019 & 2032
- Table 103: Global Algae Products Market Revenue Million Forecast, by Source 2019 & 2032
- Table 104: Global Algae Products Market Volume k Tons Forecast, by Source 2019 & 2032
- Table 105: Global Algae Products Market Revenue Million Forecast, by Product Type 2019 & 2032
- Table 106: Global Algae Products Market Volume k Tons Forecast, by Product Type 2019 & 2032
- Table 107: Global Algae Products Market Revenue Million Forecast, by Application 2019 & 2032
- Table 108: Global Algae Products Market Volume k Tons Forecast, by Application 2019 & 2032
- Table 109: Global Algae Products Market Revenue Million Forecast, by Country 2019 & 2032
- Table 110: Global Algae Products Market Volume k Tons Forecast, by Country 2019 & 2032
- Table 111: China Algae Products Market Revenue (Million) Forecast, by Application 2019 & 2032
- Table 112: China Algae Products Market Volume (k Tons) Forecast, by Application 2019 & 2032
- Table 113: Japan Algae Products Market Revenue (Million) Forecast, by Application 2019 & 2032
- Table 114: Japan Algae Products Market Volume (k Tons) Forecast, by Application 2019 & 2032
- Table 115: India Algae Products Market Revenue (Million) Forecast, by Application 2019 & 2032
- Table 116: India Algae Products Market Volume (k Tons) Forecast, by Application 2019 & 2032
- Table 117: Australia Algae Products Market Revenue (Million) Forecast, by Application 2019 & 2032
- Table 118: Australia Algae Products Market Volume (k Tons) Forecast, by Application 2019 & 2032
- Table 119: Rest of Asia Pacific Algae Products Market Revenue (Million) Forecast, by Application 2019 & 2032
- Table 120: Rest of Asia Pacific Algae Products Market Volume (k Tons) Forecast, by Application 2019 & 2032
- Table 121: Global Algae Products Market Revenue Million Forecast, by Source 2019 & 2032
- Table 122: Global Algae Products Market Volume k Tons Forecast, by Source 2019 & 2032
- Table 123: Global Algae Products Market Revenue Million Forecast, by Product Type 2019 & 2032
- Table 124: Global Algae Products Market Volume k Tons Forecast, by Product Type 2019 & 2032
- Table 125: Global Algae Products Market Revenue Million Forecast, by Application 2019 & 2032
- Table 126: Global Algae Products Market Volume k Tons Forecast, by Application 2019 & 2032
- Table 127: Global Algae Products Market Revenue Million Forecast, by Country 2019 & 2032
- Table 128: Global Algae Products Market Volume k Tons Forecast, by Country 2019 & 2032
- Table 129: Brazil Algae Products Market Revenue (Million) Forecast, by Application 2019 & 2032
- Table 130: Brazil Algae Products Market Volume (k Tons) Forecast, by Application 2019 & 2032
- Table 131: Argentina Algae Products Market Revenue (Million) Forecast, by Application 2019 & 2032
- Table 132: Argentina Algae Products Market Volume (k Tons) Forecast, by Application 2019 & 2032
- Table 133: Rest of South America Algae Products Market Revenue (Million) Forecast, by Application 2019 & 2032
- Table 134: Rest of South America Algae Products Market Volume (k Tons) Forecast, by Application 2019 & 2032
- Table 135: Global Algae Products Market Revenue Million Forecast, by Source 2019 & 2032
- Table 136: Global Algae Products Market Volume k Tons Forecast, by Source 2019 & 2032
- Table 137: Global Algae Products Market Revenue Million Forecast, by Product Type 2019 & 2032
- Table 138: Global Algae Products Market Volume k Tons Forecast, by Product Type 2019 & 2032
- Table 139: Global Algae Products Market Revenue Million Forecast, by Application 2019 & 2032
- Table 140: Global Algae Products Market Volume k Tons Forecast, by Application 2019 & 2032
- Table 141: Global Algae Products Market Revenue Million Forecast, by Country 2019 & 2032
- Table 142: Global Algae Products Market Volume k Tons Forecast, by Country 2019 & 2032
- Table 143: South Africa Algae Products Market Revenue (Million) Forecast, by Application 2019 & 2032
- Table 144: South Africa Algae Products Market Volume (k Tons) Forecast, by Application 2019 & 2032
- Table 145: United Arab Emirates Algae Products Market Revenue (Million) Forecast, by Application 2019 & 2032
- Table 146: United Arab Emirates Algae Products Market Volume (k Tons) Forecast, by Application 2019 & 2032
- Table 147: Rest of Middle East and Africa Algae Products Market Revenue (Million) Forecast, by Application 2019 & 2032
- Table 148: Rest of Middle East and Africa Algae Products Market Volume (k Tons) Forecast, by Application 2019 & 2032
Frequently Asked Questions
1. What is the projected Compound Annual Growth Rate (CAGR) of the Algae Products Market?
The projected CAGR is approximately 4.99%.
2. Which companies are prominent players in the Algae Products Market?
Key companies in the market include Cargill Incorporated, Aliga Microalgae Company, Source Omega LLC, Progress Biotech BV, DuPont de Nemours Inc, Archer Daniels Midland Company, BASF SE, Koninklijke DSM N V, Algenol Biotech LLC*List Not Exhaustive, Yemoja Ltd, ACCEL Carrageenan Corporation.
3. What are the main segments of the Algae Products Market?
The market segments include Source, Product Type, Application.
4. Can you provide details about the market size?
The market size is estimated to be USD 1.92 Million as of 2022.
5. What are some drivers contributing to market growth?
Increasing Demand for Processed Food Products; Technological Advancements Supporting Market Growth.
6. What are the notable trends driving market growth?
Health Benefits Associated With Algae Products' Consumption.
7. Are there any restraints impacting market growth?
Increasing Cost of Production Due to Rise in Energy and Labor Cost.
8. Can you provide examples of recent developments in the market?
In September 2022, in the Netherlands, the Danish company Aliga Microalgae (Aliga) acquired a large chlorella algae facility. The company plans to use a modern production facility to commercialize its chlorella algae products.
9. What pricing options are available for accessing the report?
Pricing options include single-user, multi-user, and enterprise licenses priced at USD 4750, USD 5250, and USD 8750 respectively.
10. Is the market size provided in terms of value or volume?
The market size is provided in terms of value, measured in Million and volume, measured in k Tons.
11. Are there any specific market keywords associated with the report?
Yes, the market keyword associated with the report is "Algae Products Market," which aids in identifying and referencing the specific market segment covered.
12. How do I determine which pricing option suits my needs best?
The pricing options vary based on user requirements and access needs. Individual users may opt for single-user licenses, while businesses requiring broader access may choose multi-user or enterprise licenses for cost-effective access to the report.
13. Are there any additional resources or data provided in the Algae Products Market report?
While the report offers comprehensive insights, it's advisable to review the specific contents or supplementary materials provided to ascertain if additional resources or data are available.
14. How can I stay updated on further developments or reports in the Algae Products Market?
To stay informed about further developments, trends, and reports in the Algae Products Market, consider subscribing to industry newsletters, following relevant companies and organizations, or regularly checking reputable industry news sources and publications.
Methodology
Step 1 - Identification of Relevant Samples Size from Population Database


Step 2 - Approaches for Defining Global Market Size (Value, Volume* & Price*)

Note*: In applicable scenarios
Step 3 - Data Sources
Primary Research
- Web Analytics
- Survey Reports
- Research Institute
- Latest Research Reports
- Opinion Leaders
Secondary Research
- Annual Reports
- White Paper
- Latest Press Release
- Industry Association
- Paid Database
- Investor Presentations

Step 4 - Data Triangulation
Involves using different sources of information in order to increase the validity of a study
These sources are likely to be stakeholders in a program - participants, other researchers, program staff, other community members, and so on.
Then we put all data in single framework & apply various statistical tools to find out the dynamic on the market.
During the analysis stage, feedback from the stakeholder groups would be compared to determine areas of agreement as well as areas of divergence


