

Key Insights
The Indian alkaline battery market, estimated at 910 million in 2025, is poised for substantial expansion. Projected to grow at a Compound Annual Growth Rate (CAGR) of 6.89% from 2025 to 2033, this growth is primarily driven by the escalating demand from the consumer electronics sector, fueled by the widespread adoption of portable devices. The commercial sector, including industrial applications and emergency lighting, also significantly contributes to market expansion. Increasing disposable incomes and rapid urbanization further propel demand for battery-powered devices. While environmental concerns regarding battery disposal and the rise of alternative energy storage solutions present challenges, the sustained growth of the electronics industry and advancements in battery recycling infrastructure offer a positive market outlook. The market is segmented by type (primary and secondary) and application (consumer electronics, commercial, and others). Key industry players include Indo National Limited, Eveready Industries India Ltd, Sony, Panasonic, Duracell, and Energizer, who compete based on price, performance, and brand recognition. Regional growth is expected to be higher in areas undergoing rapid urbanization and economic development.
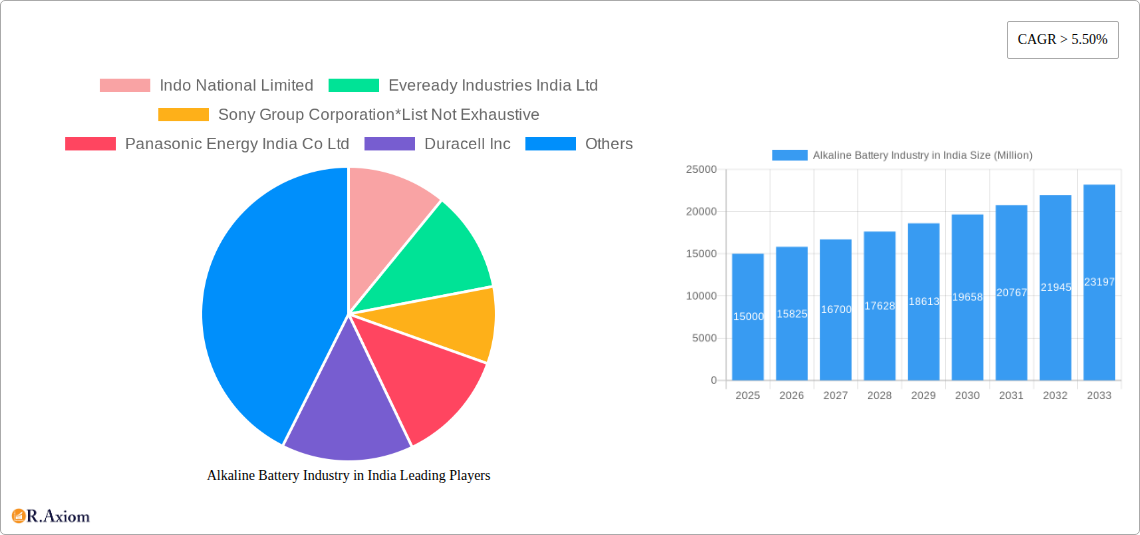
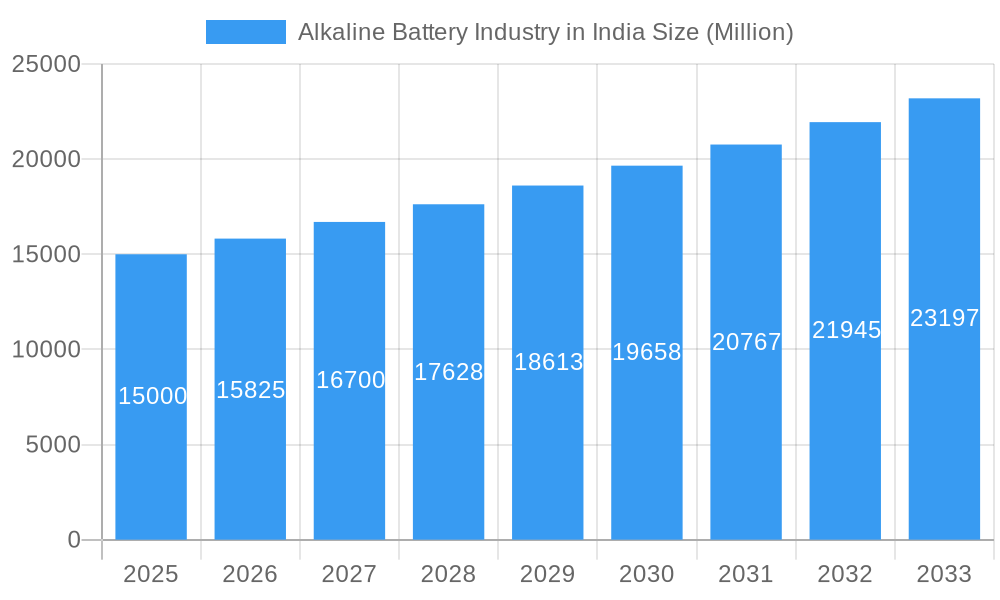
Alkaline Battery Industry in India Market Size (In Million)
The competitive landscape is dynamic, characterized by the presence of both established multinational corporations and domestic entities vying for market share. Strategic initiatives such as product innovation, including the development of higher-capacity batteries with improved shelf life, expansion into new geographical territories, and strategic mergers and acquisitions, are anticipated to shape the industry's future. Furthermore, evolving environmental regulations will likely drive manufacturers toward sustainable practices and the development of eco-friendly battery solutions, necessitating investment in research and development and potentially influencing product pricing and consumer purchasing decisions. A thorough understanding of these multifaceted dynamics is crucial for businesses operating within or considering entry into the Indian alkaline battery market.
Alkaline Battery Industry in India Company Market Share
Indian Alkaline Battery Market Analysis: Size, Trends, and Forecast (2019-2033)
This comprehensive report analyzes the Indian alkaline battery industry, detailing market size, growth drivers, competitive dynamics, and future projections. The analysis covers the period from 2019 to 2033, with 2025 serving as the base and estimated year. The report is based on extensive primary and secondary research, offering valuable insights for industry stakeholders, investors, and new market entrants.
Alkaline Battery Industry in India Market Concentration & Innovation
This section analyzes the market concentration, innovation drivers, regulatory frameworks, product substitutes, end-user trends, and mergers and acquisitions (M&A) activities within the Indian alkaline battery market. The Indian alkaline battery market is moderately concentrated, with key players holding significant market share, while several smaller players contribute to the overall landscape. The top five players likely account for approximately 65% of the market, with Eveready Industries India Ltd and Indo National Limited holding leading positions. The remaining market share is distributed among numerous smaller players and regional brands.
Market Concentration Metrics (2024 Estimates):
- Eveready Industries India Ltd: 25% Market Share
- Indo National Limited: 20% Market Share
- Panasonic Energy India Co Ltd: 10% Market Share
- Others: 45% Market Share
Innovation in the alkaline battery sector is driven by the need for higher energy density, improved lifespan, and eco-friendly materials. Major players are investing in R&D to develop advanced battery chemistries and improved manufacturing processes. However, innovation is also constrained by relatively lower R&D investments compared to other global markets.
M&A Activity: While precise deal values are not publicly available for all transactions, the number of M&A activities in the recent past has been relatively low, signaling a degree of market stability and possibly limited consolidation. Further research would be needed to quantify this observation.
Regulatory frameworks, including the March 2020 MoEFCC draft notification for battery waste management, are shaping the industry by pushing for improved recycling and sustainable practices. The emergence of substitute technologies, such as lithium-ion batteries, presents a significant challenge, although alkaline batteries still maintain a strong presence in specific applications due to cost-effectiveness and ease of use.
Alkaline Battery Industry in India Industry Trends & Insights
The Indian alkaline battery market is experiencing steady growth, driven by factors such as increasing demand from consumer electronics, expanding industrial applications, and rising disposable incomes. The market is witnessing a notable shift towards higher capacity batteries and improved performance characteristics.
Key Trends:
- Growth Drivers: Rising disposable incomes, increased demand for portable electronics, and growth in various industrial sectors are key drivers.
- Technological Disruptions: The entry of advanced battery technologies, like lithium-ion, presents challenges but also opportunities for innovation and market diversification.
- Consumer Preferences: Consumers prioritize affordability, reliability, and safety. Branding and ease of access also play vital roles.
- Competitive Dynamics: The market showcases a mix of large multinational corporations and domestic players, leading to both price competition and innovation-driven differentiation.
Market Growth: The CAGR for the alkaline battery market in India during the historical period (2019-2024) is estimated at xx%, with a projected CAGR of xx% during the forecast period (2025-2033). Market penetration varies significantly depending on the application segment and geographical location, with higher penetration observed in urban areas compared to rural ones.
Dominant Markets & Segments in Alkaline Battery Industry in India
The consumer electronics segment dominates the Indian alkaline battery market, driven by the widespread adoption of portable devices like toys, remote controls, clocks, and flashlights. Geographically, major urban centers and high-population density states are the most significant markets.
Key Drivers of Dominance:
- Consumer Electronics: High demand for portable electronic devices continues to drive market growth in this sector.
- Commercial Applications: While significant, this segment's growth is slightly slower than consumer electronics due to factors like higher upfront costs and the adoption of alternative energy solutions.
- Geographic Distribution: Urban areas, especially in high-population states, show the highest demand due to higher disposable incomes and access to wider product availability.
Detailed Dominance Analysis: The consumer electronics sector's dominance is attributed to the affordability of alkaline batteries compared to other alternatives. The sector’s continued growth is supported by increasing smartphone penetration and the widespread use of battery-operated devices in various aspects of daily life. However, the industry’s reliance on the consumer electronics sector makes it susceptible to market fluctuations in this segment.
Alkaline Battery Industry in India Product Developments
Recent product developments focus on enhancing battery life, improving energy density, and incorporating eco-friendly materials. Manufacturers are exploring options such as advanced cathode materials and improved electrolyte formulations to achieve better performance. These innovations are designed to meet the growing demand for longer-lasting and more efficient batteries, while addressing environmental concerns related to battery waste. The market fit for these innovations is strong, given the consumer preference for longer-lasting batteries in portable electronic devices.
Report Scope & Segmentation Analysis
This report segments the Indian alkaline battery market by Type (Primary and Secondary) and Application (Consumer Electronics, Commercial, and Others).
By Type:
- Primary Batteries: This segment holds a larger market share due to its lower cost and ease of use in various applications. Growth is expected to remain steady due to its continued relevance in portable electronic devices. Competitive dynamics are driven by price and performance.
- Secondary Batteries: While smaller, this segment displays potential for growth due to increasing demand for rechargeable batteries in specific applications. Competitive intensity is moderate, driven by innovation in battery technology.
By Application:
- Consumer Electronics: This is the dominant segment with high growth potential, driven by increasing disposable income and adoption of battery-operated devices. Competition is intense due to the significant market share.
- Commercial: The commercial sector showcases steady growth driven by industrial automation and other applications, featuring moderate competitive dynamics.
- Others: This segment comprises various niche applications. Growth potential is relatively low compared to the other two application segments.
Key Drivers of Alkaline Battery Industry in India Growth
The growth of the Indian alkaline battery market is propelled by several factors:
- Rising disposable incomes and increased consumer spending power are driving demand for portable electronic devices.
- Growth in the Indian manufacturing sector, particularly in the consumer electronics and industrial segments, further fuels demand for alkaline batteries.
- The relatively lower cost of alkaline batteries compared to other battery types makes them accessible to a broader consumer base.
Challenges in the Alkaline Battery Industry in India Sector
The alkaline battery industry in India faces several challenges:
- The increasing popularity of alternative battery technologies, such as lithium-ion batteries, poses a competitive threat.
- Stringent environmental regulations concerning battery waste management necessitate investments in recycling infrastructure and sustainable manufacturing practices.
- Fluctuations in raw material prices and supply chain disruptions can affect production costs and profitability.
Emerging Opportunities in Alkaline Battery Industry in India
Several opportunities exist for the Indian alkaline battery market:
- Growing demand for portable electronic devices and the expanding industrial sector offer significant growth potential.
- Increased focus on sustainable manufacturing practices and waste management could lead to innovative product development and market leadership.
- Exploring niche applications and catering to specialized consumer segments presents additional opportunities for differentiation and growth.
Leading Players in the Alkaline Battery Industry in India Market
- Indo National Limited
- Eveready Industries India Ltd
- Sony Group Corporation
- Panasonic Energy India Co Ltd
- Duracell Inc
- GPB International Limited
- Geep Industries Pvt Ltd
- FUTURISTIC IDC Pvt Ltd
- Energizer Holdings
- Coslight India
Key Developments in Alkaline Battery Industry in India Industry
- March 2020: The Ministry of Environment, Forest, and Climate Change (MoEFCC) issued a draft notification for battery waste management, significantly impacting industry practices and requiring investments in recycling and sustainable solutions. This will likely lead to a restructuring of the supply chain and increase pressure on manufacturers to adopt environmentally friendly processes.
Strategic Outlook for Alkaline Battery Industry in India Market
The Indian alkaline battery market presents a compelling investment opportunity, driven by expanding consumption, increasing industrialization, and a burgeoning demand for portable electronic devices. Despite the challenges posed by alternative technologies and environmental regulations, the market is projected to witness substantial growth in the coming years. The focus on innovation, sustainable practices, and catering to evolving consumer preferences will be crucial for players seeking long-term success in this dynamic market.
Alkaline Battery Industry in India Segmentation
-
1. Type
- 1.1. Primary
- 1.2. Secondary
-
2. Application
- 2.1. Consumer Electronics
- 2.2. Commercial
- 2.3. Others
Alkaline Battery Industry in India Segmentation By Geography
-
1. North America
- 1.1. United States
- 1.2. Canada
- 1.3. Mexico
-
2. South America
- 2.1. Brazil
- 2.2. Argentina
- 2.3. Rest of South America
-
3. Europe
- 3.1. United Kingdom
- 3.2. Germany
- 3.3. France
- 3.4. Italy
- 3.5. Spain
- 3.6. Russia
- 3.7. Benelux
- 3.8. Nordics
- 3.9. Rest of Europe
-
4. Middle East & Africa
- 4.1. Turkey
- 4.2. Israel
- 4.3. GCC
- 4.4. North Africa
- 4.5. South Africa
- 4.6. Rest of Middle East & Africa
-
5. Asia Pacific
- 5.1. China
- 5.2. India
- 5.3. Japan
- 5.4. South Korea
- 5.5. ASEAN
- 5.6. Oceania
- 5.7. Rest of Asia Pacific
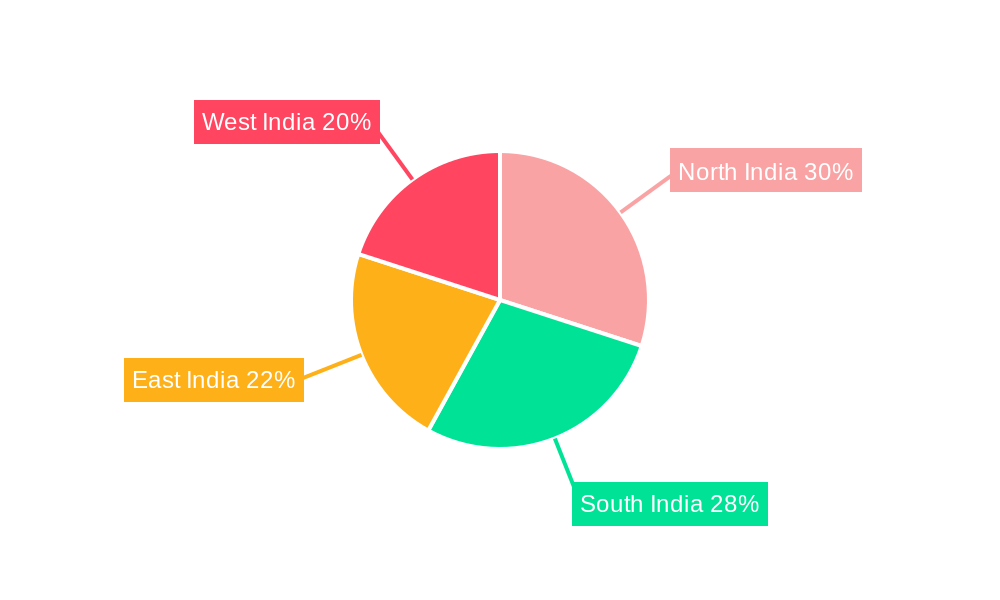
Alkaline Battery Industry in India Regional Market Share
Geographic Coverage of Alkaline Battery Industry in India
Alkaline Battery Industry in India REPORT HIGHLIGHTS
| Aspects | Details |
|---|---|
| Study Period | 2020-2034 |
| Base Year | 2025 |
| Estimated Year | 2026 |
| Forecast Period | 2026-2034 |
| Historical Period | 2020-2025 |
| Growth Rate | CAGR of 6.89% from 2020-2034 |
| Segmentation |
|
Table of Contents
- 1. Introduction
- 1.1. Research Scope
- 1.2. Market Segmentation
- 1.3. Research Objective
- 1.4. Definitions and Assumptions
- 2. Executive Summary
- 2.1. Market Snapshot
- 3. Market Dynamics
- 3.1. Market Drivers
- 3.2. Market Restrains
- 3.3. Market Trends
- 3.4. Market Opportunities
- 4. Market Factor Analysis
- 4.1. Porters Five Forces
- 4.1.1. Bargaining Power of Suppliers
- 4.1.2. Bargaining Power of Buyers
- 4.1.3. Threat of New Entrants
- 4.1.4. Threat of Substitutes
- 4.1.5. Competitive Rivalry
- 4.2. PESTEL analysis
- 4.3. BCG Analysis
- 4.3.1. Stars (High Growth, High Market Share)
- 4.3.2. Cash Cows (Low Growth, High Market Share)
- 4.3.3. Question Mark (High Growth, Low Market Share)
- 4.3.4. Dogs (Low Growth, Low Market Share)
- 4.4. Ansoff Matrix Analysis
- 4.5. Supply Chain Analysis
- 4.6. Regulatory Landscape
- 4.7. Current Market Potential and Opportunity Assessment (TAM–SAM–SOM Framework)
- 4.8. RAX Analyst Note
- 4.1. Porters Five Forces
- 5. Market Analysis, Insights and Forecast 2021-2033
- 5.1. Market Analysis, Insights and Forecast - by Type
- 5.1.1. Primary
- 5.1.2. Secondary
- 5.2. Market Analysis, Insights and Forecast - by Application
- 5.2.1. Consumer Electronics
- 5.2.2. Commercial
- 5.2.3. Others
- 5.3. Market Analysis, Insights and Forecast - by Region
- 5.3.1. North America
- 5.3.2. South America
- 5.3.3. Europe
- 5.3.4. Middle East & Africa
- 5.3.5. Asia Pacific
- 5.1. Market Analysis, Insights and Forecast - by Type
- 6. Global Alkaline Battery Industry in India Analysis, Insights and Forecast, 2021-2033
- 6.1. Market Analysis, Insights and Forecast - by Type
- 6.1.1. Primary
- 6.1.2. Secondary
- 6.2. Market Analysis, Insights and Forecast - by Application
- 6.2.1. Consumer Electronics
- 6.2.2. Commercial
- 6.2.3. Others
- 6.1. Market Analysis, Insights and Forecast - by Type
- 7. North America Alkaline Battery Industry in India Analysis, Insights and Forecast, 2020-2032
- 7.1. Market Analysis, Insights and Forecast - by Type
- 7.1.1. Primary
- 7.1.2. Secondary
- 7.2. Market Analysis, Insights and Forecast - by Application
- 7.2.1. Consumer Electronics
- 7.2.2. Commercial
- 7.2.3. Others
- 7.1. Market Analysis, Insights and Forecast - by Type
- 8. South America Alkaline Battery Industry in India Analysis, Insights and Forecast, 2020-2032
- 8.1. Market Analysis, Insights and Forecast - by Type
- 8.1.1. Primary
- 8.1.2. Secondary
- 8.2. Market Analysis, Insights and Forecast - by Application
- 8.2.1. Consumer Electronics
- 8.2.2. Commercial
- 8.2.3. Others
- 8.1. Market Analysis, Insights and Forecast - by Type
- 9. Europe Alkaline Battery Industry in India Analysis, Insights and Forecast, 2020-2032
- 9.1. Market Analysis, Insights and Forecast - by Type
- 9.1.1. Primary
- 9.1.2. Secondary
- 9.2. Market Analysis, Insights and Forecast - by Application
- 9.2.1. Consumer Electronics
- 9.2.2. Commercial
- 9.2.3. Others
- 9.1. Market Analysis, Insights and Forecast - by Type
- 10. Middle East & Africa Alkaline Battery Industry in India Analysis, Insights and Forecast, 2020-2032
- 10.1. Market Analysis, Insights and Forecast - by Type
- 10.1.1. Primary
- 10.1.2. Secondary
- 10.2. Market Analysis, Insights and Forecast - by Application
- 10.2.1. Consumer Electronics
- 10.2.2. Commercial
- 10.2.3. Others
- 10.1. Market Analysis, Insights and Forecast - by Type
- 11. Asia Pacific Alkaline Battery Industry in India Analysis, Insights and Forecast, 2020-2032
- 11.1. Market Analysis, Insights and Forecast - by Type
- 11.1.1. Primary
- 11.1.2. Secondary
- 11.2. Market Analysis, Insights and Forecast - by Application
- 11.2.1. Consumer Electronics
- 11.2.2. Commercial
- 11.2.3. Others
- 11.1. Market Analysis, Insights and Forecast - by Type
- 12. Competitive Analysis
- 12.1. Company Profiles
- 12.1.1 Indo National Limited
- 12.1.1.1. Company Overview
- 12.1.1.2. Products
- 12.1.1.3. Company Financials
- 12.1.1.4. SWOT Analysis
- 12.1.2 Eveready Industries India Ltd
- 12.1.2.1. Company Overview
- 12.1.2.2. Products
- 12.1.2.3. Company Financials
- 12.1.2.4. SWOT Analysis
- 12.1.3 Sony Group Corporation*List Not Exhaustive
- 12.1.3.1. Company Overview
- 12.1.3.2. Products
- 12.1.3.3. Company Financials
- 12.1.3.4. SWOT Analysis
- 12.1.4 Panasonic Energy India Co Ltd
- 12.1.4.1. Company Overview
- 12.1.4.2. Products
- 12.1.4.3. Company Financials
- 12.1.4.4. SWOT Analysis
- 12.1.5 Duracell Inc
- 12.1.5.1. Company Overview
- 12.1.5.2. Products
- 12.1.5.3. Company Financials
- 12.1.5.4. SWOT Analysis
- 12.1.6 GPB International Limited
- 12.1.6.1. Company Overview
- 12.1.6.2. Products
- 12.1.6.3. Company Financials
- 12.1.6.4. SWOT Analysis
- 12.1.7 Geep Industries Pvt Ltd
- 12.1.7.1. Company Overview
- 12.1.7.2. Products
- 12.1.7.3. Company Financials
- 12.1.7.4. SWOT Analysis
- 12.1.8 FUTURISTIC IDC Pvt Ltd
- 12.1.8.1. Company Overview
- 12.1.8.2. Products
- 12.1.8.3. Company Financials
- 12.1.8.4. SWOT Analysis
- 12.1.9 Energizer Holdings
- 12.1.9.1. Company Overview
- 12.1.9.2. Products
- 12.1.9.3. Company Financials
- 12.1.9.4. SWOT Analysis
- 12.1.10 Coslight India
- 12.1.10.1. Company Overview
- 12.1.10.2. Products
- 12.1.10.3. Company Financials
- 12.1.10.4. SWOT Analysis
- 12.1.1 Indo National Limited
- 12.2. Market Entropy
- 12.2.1 Company's Key Areas Served
- 12.2.2 Recent Developments
- 12.3. Company Market Share Analysis 2025
- 12.3.1 Top 5 Companies Market Share Analysis
- 12.3.2 Top 3 Companies Market Share Analysis
- 12.4. List of Potential Customers
- 13. Research Methodology
List of Figures
- Figure 1: Global Alkaline Battery Industry in India Revenue Breakdown (million, %) by Region 2025 & 2033
- Figure 2: Global Alkaline Battery Industry in India Volume Breakdown (K Tons, %) by Region 2025 & 2033
- Figure 3: North America Alkaline Battery Industry in India Revenue (million), by Type 2025 & 2033
- Figure 4: North America Alkaline Battery Industry in India Volume (K Tons), by Type 2025 & 2033
- Figure 5: North America Alkaline Battery Industry in India Revenue Share (%), by Type 2025 & 2033
- Figure 6: North America Alkaline Battery Industry in India Volume Share (%), by Type 2025 & 2033
- Figure 7: North America Alkaline Battery Industry in India Revenue (million), by Application 2025 & 2033
- Figure 8: North America Alkaline Battery Industry in India Volume (K Tons), by Application 2025 & 2033
- Figure 9: North America Alkaline Battery Industry in India Revenue Share (%), by Application 2025 & 2033
- Figure 10: North America Alkaline Battery Industry in India Volume Share (%), by Application 2025 & 2033
- Figure 11: North America Alkaline Battery Industry in India Revenue (million), by Country 2025 & 2033
- Figure 12: North America Alkaline Battery Industry in India Volume (K Tons), by Country 2025 & 2033
- Figure 13: North America Alkaline Battery Industry in India Revenue Share (%), by Country 2025 & 2033
- Figure 14: North America Alkaline Battery Industry in India Volume Share (%), by Country 2025 & 2033
- Figure 15: South America Alkaline Battery Industry in India Revenue (million), by Type 2025 & 2033
- Figure 16: South America Alkaline Battery Industry in India Volume (K Tons), by Type 2025 & 2033
- Figure 17: South America Alkaline Battery Industry in India Revenue Share (%), by Type 2025 & 2033
- Figure 18: South America Alkaline Battery Industry in India Volume Share (%), by Type 2025 & 2033
- Figure 19: South America Alkaline Battery Industry in India Revenue (million), by Application 2025 & 2033
- Figure 20: South America Alkaline Battery Industry in India Volume (K Tons), by Application 2025 & 2033
- Figure 21: South America Alkaline Battery Industry in India Revenue Share (%), by Application 2025 & 2033
- Figure 22: South America Alkaline Battery Industry in India Volume Share (%), by Application 2025 & 2033
- Figure 23: South America Alkaline Battery Industry in India Revenue (million), by Country 2025 & 2033
- Figure 24: South America Alkaline Battery Industry in India Volume (K Tons), by Country 2025 & 2033
- Figure 25: South America Alkaline Battery Industry in India Revenue Share (%), by Country 2025 & 2033
- Figure 26: South America Alkaline Battery Industry in India Volume Share (%), by Country 2025 & 2033
- Figure 27: Europe Alkaline Battery Industry in India Revenue (million), by Type 2025 & 2033
- Figure 28: Europe Alkaline Battery Industry in India Volume (K Tons), by Type 2025 & 2033
- Figure 29: Europe Alkaline Battery Industry in India Revenue Share (%), by Type 2025 & 2033
- Figure 30: Europe Alkaline Battery Industry in India Volume Share (%), by Type 2025 & 2033
- Figure 31: Europe Alkaline Battery Industry in India Revenue (million), by Application 2025 & 2033
- Figure 32: Europe Alkaline Battery Industry in India Volume (K Tons), by Application 2025 & 2033
- Figure 33: Europe Alkaline Battery Industry in India Revenue Share (%), by Application 2025 & 2033
- Figure 34: Europe Alkaline Battery Industry in India Volume Share (%), by Application 2025 & 2033
- Figure 35: Europe Alkaline Battery Industry in India Revenue (million), by Country 2025 & 2033
- Figure 36: Europe Alkaline Battery Industry in India Volume (K Tons), by Country 2025 & 2033
- Figure 37: Europe Alkaline Battery Industry in India Revenue Share (%), by Country 2025 & 2033
- Figure 38: Europe Alkaline Battery Industry in India Volume Share (%), by Country 2025 & 2033
- Figure 39: Middle East & Africa Alkaline Battery Industry in India Revenue (million), by Type 2025 & 2033
- Figure 40: Middle East & Africa Alkaline Battery Industry in India Volume (K Tons), by Type 2025 & 2033
- Figure 41: Middle East & Africa Alkaline Battery Industry in India Revenue Share (%), by Type 2025 & 2033
- Figure 42: Middle East & Africa Alkaline Battery Industry in India Volume Share (%), by Type 2025 & 2033
- Figure 43: Middle East & Africa Alkaline Battery Industry in India Revenue (million), by Application 2025 & 2033
- Figure 44: Middle East & Africa Alkaline Battery Industry in India Volume (K Tons), by Application 2025 & 2033
- Figure 45: Middle East & Africa Alkaline Battery Industry in India Revenue Share (%), by Application 2025 & 2033
- Figure 46: Middle East & Africa Alkaline Battery Industry in India Volume Share (%), by Application 2025 & 2033
- Figure 47: Middle East & Africa Alkaline Battery Industry in India Revenue (million), by Country 2025 & 2033
- Figure 48: Middle East & Africa Alkaline Battery Industry in India Volume (K Tons), by Country 2025 & 2033
- Figure 49: Middle East & Africa Alkaline Battery Industry in India Revenue Share (%), by Country 2025 & 2033
- Figure 50: Middle East & Africa Alkaline Battery Industry in India Volume Share (%), by Country 2025 & 2033
- Figure 51: Asia Pacific Alkaline Battery Industry in India Revenue (million), by Type 2025 & 2033
- Figure 52: Asia Pacific Alkaline Battery Industry in India Volume (K Tons), by Type 2025 & 2033
- Figure 53: Asia Pacific Alkaline Battery Industry in India Revenue Share (%), by Type 2025 & 2033
- Figure 54: Asia Pacific Alkaline Battery Industry in India Volume Share (%), by Type 2025 & 2033
- Figure 55: Asia Pacific Alkaline Battery Industry in India Revenue (million), by Application 2025 & 2033
- Figure 56: Asia Pacific Alkaline Battery Industry in India Volume (K Tons), by Application 2025 & 2033
- Figure 57: Asia Pacific Alkaline Battery Industry in India Revenue Share (%), by Application 2025 & 2033
- Figure 58: Asia Pacific Alkaline Battery Industry in India Volume Share (%), by Application 2025 & 2033
- Figure 59: Asia Pacific Alkaline Battery Industry in India Revenue (million), by Country 2025 & 2033
- Figure 60: Asia Pacific Alkaline Battery Industry in India Volume (K Tons), by Country 2025 & 2033
- Figure 61: Asia Pacific Alkaline Battery Industry in India Revenue Share (%), by Country 2025 & 2033
- Figure 62: Asia Pacific Alkaline Battery Industry in India Volume Share (%), by Country 2025 & 2033
List of Tables
- Table 1: Global Alkaline Battery Industry in India Revenue million Forecast, by Type 2020 & 2033
- Table 2: Global Alkaline Battery Industry in India Volume K Tons Forecast, by Type 2020 & 2033
- Table 3: Global Alkaline Battery Industry in India Revenue million Forecast, by Application 2020 & 2033
- Table 4: Global Alkaline Battery Industry in India Volume K Tons Forecast, by Application 2020 & 2033
- Table 5: Global Alkaline Battery Industry in India Revenue million Forecast, by Region 2020 & 2033
- Table 6: Global Alkaline Battery Industry in India Volume K Tons Forecast, by Region 2020 & 2033
- Table 7: Global Alkaline Battery Industry in India Revenue million Forecast, by Type 2020 & 2033
- Table 8: Global Alkaline Battery Industry in India Volume K Tons Forecast, by Type 2020 & 2033
- Table 9: Global Alkaline Battery Industry in India Revenue million Forecast, by Application 2020 & 2033
- Table 10: Global Alkaline Battery Industry in India Volume K Tons Forecast, by Application 2020 & 2033
- Table 11: Global Alkaline Battery Industry in India Revenue million Forecast, by Country 2020 & 2033
- Table 12: Global Alkaline Battery Industry in India Volume K Tons Forecast, by Country 2020 & 2033
- Table 13: United States Alkaline Battery Industry in India Revenue (million) Forecast, by Application 2020 & 2033
- Table 14: United States Alkaline Battery Industry in India Volume (K Tons) Forecast, by Application 2020 & 2033
- Table 15: Canada Alkaline Battery Industry in India Revenue (million) Forecast, by Application 2020 & 2033
- Table 16: Canada Alkaline Battery Industry in India Volume (K Tons) Forecast, by Application 2020 & 2033
- Table 17: Mexico Alkaline Battery Industry in India Revenue (million) Forecast, by Application 2020 & 2033
- Table 18: Mexico Alkaline Battery Industry in India Volume (K Tons) Forecast, by Application 2020 & 2033
- Table 19: Global Alkaline Battery Industry in India Revenue million Forecast, by Type 2020 & 2033
- Table 20: Global Alkaline Battery Industry in India Volume K Tons Forecast, by Type 2020 & 2033
- Table 21: Global Alkaline Battery Industry in India Revenue million Forecast, by Application 2020 & 2033
- Table 22: Global Alkaline Battery Industry in India Volume K Tons Forecast, by Application 2020 & 2033
- Table 23: Global Alkaline Battery Industry in India Revenue million Forecast, by Country 2020 & 2033
- Table 24: Global Alkaline Battery Industry in India Volume K Tons Forecast, by Country 2020 & 2033
- Table 25: Brazil Alkaline Battery Industry in India Revenue (million) Forecast, by Application 2020 & 2033
- Table 26: Brazil Alkaline Battery Industry in India Volume (K Tons) Forecast, by Application 2020 & 2033
- Table 27: Argentina Alkaline Battery Industry in India Revenue (million) Forecast, by Application 2020 & 2033
- Table 28: Argentina Alkaline Battery Industry in India Volume (K Tons) Forecast, by Application 2020 & 2033
- Table 29: Rest of South America Alkaline Battery Industry in India Revenue (million) Forecast, by Application 2020 & 2033
- Table 30: Rest of South America Alkaline Battery Industry in India Volume (K Tons) Forecast, by Application 2020 & 2033
- Table 31: Global Alkaline Battery Industry in India Revenue million Forecast, by Type 2020 & 2033
- Table 32: Global Alkaline Battery Industry in India Volume K Tons Forecast, by Type 2020 & 2033
- Table 33: Global Alkaline Battery Industry in India Revenue million Forecast, by Application 2020 & 2033
- Table 34: Global Alkaline Battery Industry in India Volume K Tons Forecast, by Application 2020 & 2033
- Table 35: Global Alkaline Battery Industry in India Revenue million Forecast, by Country 2020 & 2033
- Table 36: Global Alkaline Battery Industry in India Volume K Tons Forecast, by Country 2020 & 2033
- Table 37: United Kingdom Alkaline Battery Industry in India Revenue (million) Forecast, by Application 2020 & 2033
- Table 38: United Kingdom Alkaline Battery Industry in India Volume (K Tons) Forecast, by Application 2020 & 2033
- Table 39: Germany Alkaline Battery Industry in India Revenue (million) Forecast, by Application 2020 & 2033
- Table 40: Germany Alkaline Battery Industry in India Volume (K Tons) Forecast, by Application 2020 & 2033
- Table 41: France Alkaline Battery Industry in India Revenue (million) Forecast, by Application 2020 & 2033
- Table 42: France Alkaline Battery Industry in India Volume (K Tons) Forecast, by Application 2020 & 2033
- Table 43: Italy Alkaline Battery Industry in India Revenue (million) Forecast, by Application 2020 & 2033
- Table 44: Italy Alkaline Battery Industry in India Volume (K Tons) Forecast, by Application 2020 & 2033
- Table 45: Spain Alkaline Battery Industry in India Revenue (million) Forecast, by Application 2020 & 2033
- Table 46: Spain Alkaline Battery Industry in India Volume (K Tons) Forecast, by Application 2020 & 2033
- Table 47: Russia Alkaline Battery Industry in India Revenue (million) Forecast, by Application 2020 & 2033
- Table 48: Russia Alkaline Battery Industry in India Volume (K Tons) Forecast, by Application 2020 & 2033
- Table 49: Benelux Alkaline Battery Industry in India Revenue (million) Forecast, by Application 2020 & 2033
- Table 50: Benelux Alkaline Battery Industry in India Volume (K Tons) Forecast, by Application 2020 & 2033
- Table 51: Nordics Alkaline Battery Industry in India Revenue (million) Forecast, by Application 2020 & 2033
- Table 52: Nordics Alkaline Battery Industry in India Volume (K Tons) Forecast, by Application 2020 & 2033
- Table 53: Rest of Europe Alkaline Battery Industry in India Revenue (million) Forecast, by Application 2020 & 2033
- Table 54: Rest of Europe Alkaline Battery Industry in India Volume (K Tons) Forecast, by Application 2020 & 2033
- Table 55: Global Alkaline Battery Industry in India Revenue million Forecast, by Type 2020 & 2033
- Table 56: Global Alkaline Battery Industry in India Volume K Tons Forecast, by Type 2020 & 2033
- Table 57: Global Alkaline Battery Industry in India Revenue million Forecast, by Application 2020 & 2033
- Table 58: Global Alkaline Battery Industry in India Volume K Tons Forecast, by Application 2020 & 2033
- Table 59: Global Alkaline Battery Industry in India Revenue million Forecast, by Country 2020 & 2033
- Table 60: Global Alkaline Battery Industry in India Volume K Tons Forecast, by Country 2020 & 2033
- Table 61: Turkey Alkaline Battery Industry in India Revenue (million) Forecast, by Application 2020 & 2033
- Table 62: Turkey Alkaline Battery Industry in India Volume (K Tons) Forecast, by Application 2020 & 2033
- Table 63: Israel Alkaline Battery Industry in India Revenue (million) Forecast, by Application 2020 & 2033
- Table 64: Israel Alkaline Battery Industry in India Volume (K Tons) Forecast, by Application 2020 & 2033
- Table 65: GCC Alkaline Battery Industry in India Revenue (million) Forecast, by Application 2020 & 2033
- Table 66: GCC Alkaline Battery Industry in India Volume (K Tons) Forecast, by Application 2020 & 2033
- Table 67: North Africa Alkaline Battery Industry in India Revenue (million) Forecast, by Application 2020 & 2033
- Table 68: North Africa Alkaline Battery Industry in India Volume (K Tons) Forecast, by Application 2020 & 2033
- Table 69: South Africa Alkaline Battery Industry in India Revenue (million) Forecast, by Application 2020 & 2033
- Table 70: South Africa Alkaline Battery Industry in India Volume (K Tons) Forecast, by Application 2020 & 2033
- Table 71: Rest of Middle East & Africa Alkaline Battery Industry in India Revenue (million) Forecast, by Application 2020 & 2033
- Table 72: Rest of Middle East & Africa Alkaline Battery Industry in India Volume (K Tons) Forecast, by Application 2020 & 2033
- Table 73: Global Alkaline Battery Industry in India Revenue million Forecast, by Type 2020 & 2033
- Table 74: Global Alkaline Battery Industry in India Volume K Tons Forecast, by Type 2020 & 2033
- Table 75: Global Alkaline Battery Industry in India Revenue million Forecast, by Application 2020 & 2033
- Table 76: Global Alkaline Battery Industry in India Volume K Tons Forecast, by Application 2020 & 2033
- Table 77: Global Alkaline Battery Industry in India Revenue million Forecast, by Country 2020 & 2033
- Table 78: Global Alkaline Battery Industry in India Volume K Tons Forecast, by Country 2020 & 2033
- Table 79: China Alkaline Battery Industry in India Revenue (million) Forecast, by Application 2020 & 2033
- Table 80: China Alkaline Battery Industry in India Volume (K Tons) Forecast, by Application 2020 & 2033
- Table 81: India Alkaline Battery Industry in India Revenue (million) Forecast, by Application 2020 & 2033
- Table 82: India Alkaline Battery Industry in India Volume (K Tons) Forecast, by Application 2020 & 2033
- Table 83: Japan Alkaline Battery Industry in India Revenue (million) Forecast, by Application 2020 & 2033
- Table 84: Japan Alkaline Battery Industry in India Volume (K Tons) Forecast, by Application 2020 & 2033
- Table 85: South Korea Alkaline Battery Industry in India Revenue (million) Forecast, by Application 2020 & 2033
- Table 86: South Korea Alkaline Battery Industry in India Volume (K Tons) Forecast, by Application 2020 & 2033
- Table 87: ASEAN Alkaline Battery Industry in India Revenue (million) Forecast, by Application 2020 & 2033
- Table 88: ASEAN Alkaline Battery Industry in India Volume (K Tons) Forecast, by Application 2020 & 2033
- Table 89: Oceania Alkaline Battery Industry in India Revenue (million) Forecast, by Application 2020 & 2033
- Table 90: Oceania Alkaline Battery Industry in India Volume (K Tons) Forecast, by Application 2020 & 2033
- Table 91: Rest of Asia Pacific Alkaline Battery Industry in India Revenue (million) Forecast, by Application 2020 & 2033
- Table 92: Rest of Asia Pacific Alkaline Battery Industry in India Volume (K Tons) Forecast, by Application 2020 & 2033
Frequently Asked Questions
1. What is the projected Compound Annual Growth Rate (CAGR) of the Alkaline Battery Industry in India?
The projected CAGR is approximately 6.89%.
2. Which companies are prominent players in the Alkaline Battery Industry in India?
Key companies in the market include Indo National Limited, Eveready Industries India Ltd, Sony Group Corporation*List Not Exhaustive, Panasonic Energy India Co Ltd, Duracell Inc, GPB International Limited, Geep Industries Pvt Ltd, FUTURISTIC IDC Pvt Ltd, Energizer Holdings , Coslight India.
3. What are the main segments of the Alkaline Battery Industry in India?
The market segments include Type, Application.
4. Can you provide details about the market size?
The market size is estimated to be USD 910 million as of 2022.
5. What are some drivers contributing to market growth?
4.; Increasing Investments in Water Treatment by Developing Countries4.; Growing Demand for the Various End-Use Sectors.
6. What are the notable trends driving market growth?
Primary Segment is Expected to Dominate the Market.
7. Are there any restraints impacting market growth?
4.; Availability of Cheap and Alternative Pumps.
8. Can you provide examples of recent developments in the market?
In March 2020, the Ministry of Environment, Forest, and Climate Change (MoEFCC) issued a draft notification for battery waste management. The regulations will apply to all types of batteries, regardless of their shape, volume, weight, material, and composition, or use.
9. What pricing options are available for accessing the report?
Pricing options include single-user, multi-user, and enterprise licenses priced at USD 3800, USD 4500, and USD 5800 respectively.
10. Is the market size provided in terms of value or volume?
The market size is provided in terms of value, measured in million and volume, measured in K Tons.
11. Are there any specific market keywords associated with the report?
Yes, the market keyword associated with the report is "Alkaline Battery Industry in India," which aids in identifying and referencing the specific market segment covered.
12. How do I determine which pricing option suits my needs best?
The pricing options vary based on user requirements and access needs. Individual users may opt for single-user licenses, while businesses requiring broader access may choose multi-user or enterprise licenses for cost-effective access to the report.
13. Are there any additional resources or data provided in the Alkaline Battery Industry in India report?
While the report offers comprehensive insights, it's advisable to review the specific contents or supplementary materials provided to ascertain if additional resources or data are available.
14. How can I stay updated on further developments or reports in the Alkaline Battery Industry in India?
To stay informed about further developments, trends, and reports in the Alkaline Battery Industry in India, consider subscribing to industry newsletters, following relevant companies and organizations, or regularly checking reputable industry news sources and publications.
Methodology
Step 1 - Identification of Relevant Samples Size from Population Database


Step 2 - Approaches for Defining Global Market Size (Value, Volume* & Price*)

Note*: In applicable scenarios
Step 3 - Data Sources
Primary Research
- Web Analytics
- Survey Reports
- Research Institute
- Latest Research Reports
- Opinion Leaders
Secondary Research
- Annual Reports
- White Paper
- Latest Press Release
- Industry Association
- Paid Database
- Investor Presentations

Step 4 - Data Triangulation
Involves using different sources of information in order to increase the validity of a study
These sources are likely to be stakeholders in a program - participants, other researchers, program staff, other community members, and so on.
Then we put all data in single framework & apply various statistical tools to find out the dynamic on the market.
During the analysis stage, feedback from the stakeholder groups would be compared to determine areas of agreement as well as areas of divergence