
Key Insights
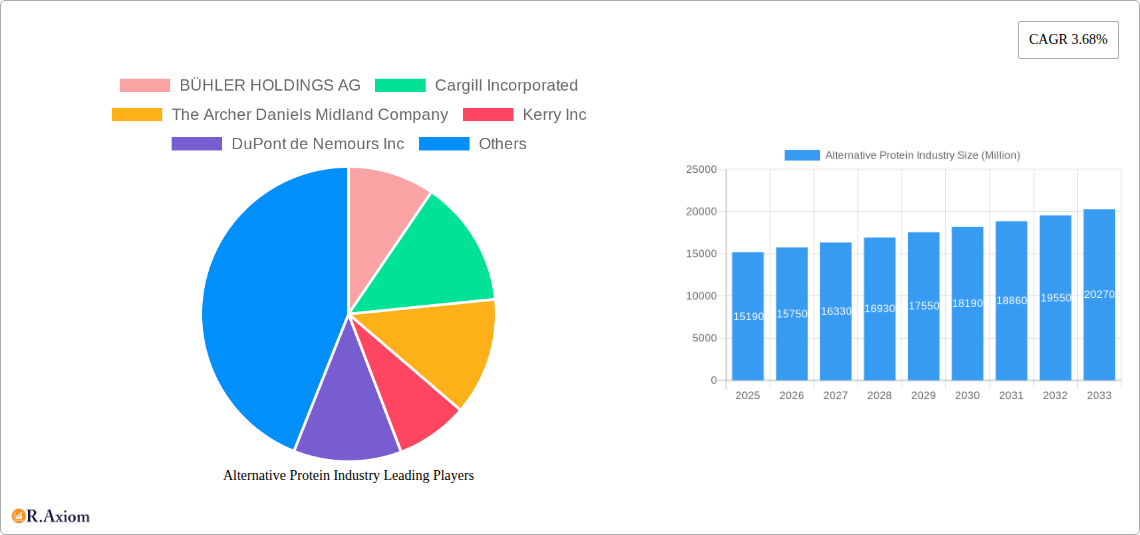
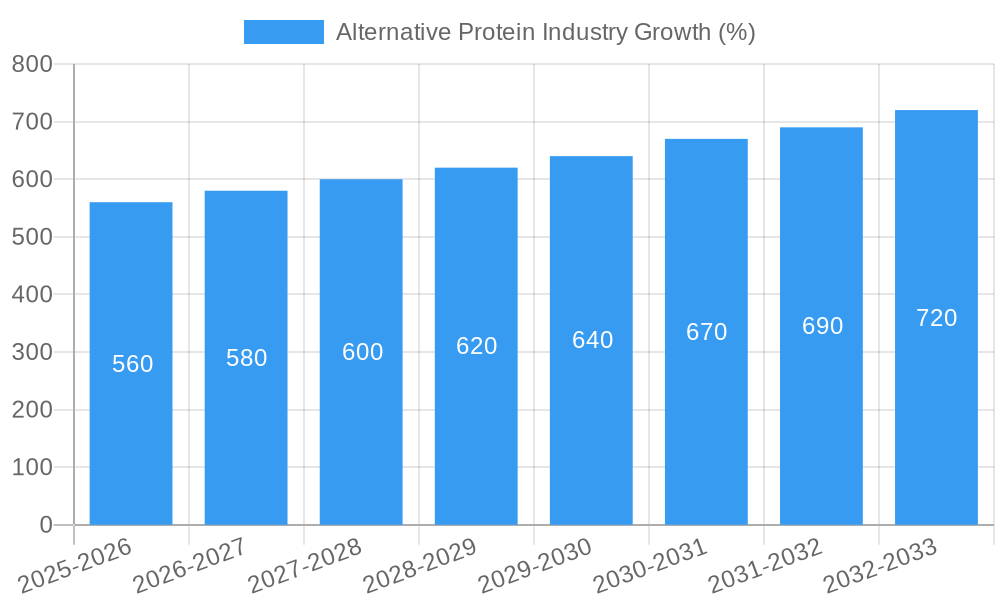
The alternative protein industry, valued at $15.19 billion in 2025, is experiencing robust growth, projected to expand at a compound annual growth rate (CAGR) of 3.68% from 2025 to 2033. This expansion is driven by several key factors. Increasing consumer awareness of the environmental impact of traditional animal agriculture, coupled with growing concerns about health and wellness, is fueling demand for plant-based alternatives to meat, dairy, and eggs. The rising prevalence of vegetarianism and veganism, particularly among younger demographics, further contributes to market growth. Technological advancements in protein extraction and formulation are also crucial, leading to more palatable and nutritionally comparable alternative protein products. Significant investments from venture capitalists and large food corporations demonstrate confidence in the long-term viability and profitability of this sector. Furthermore, government initiatives promoting sustainable food systems and reducing reliance on conventional animal agriculture are indirectly bolstering market expansion. The food and beverage industry is a major driver, actively incorporating alternative proteins into a wider range of products, expanding market penetration beyond dedicated vegan or vegetarian channels.
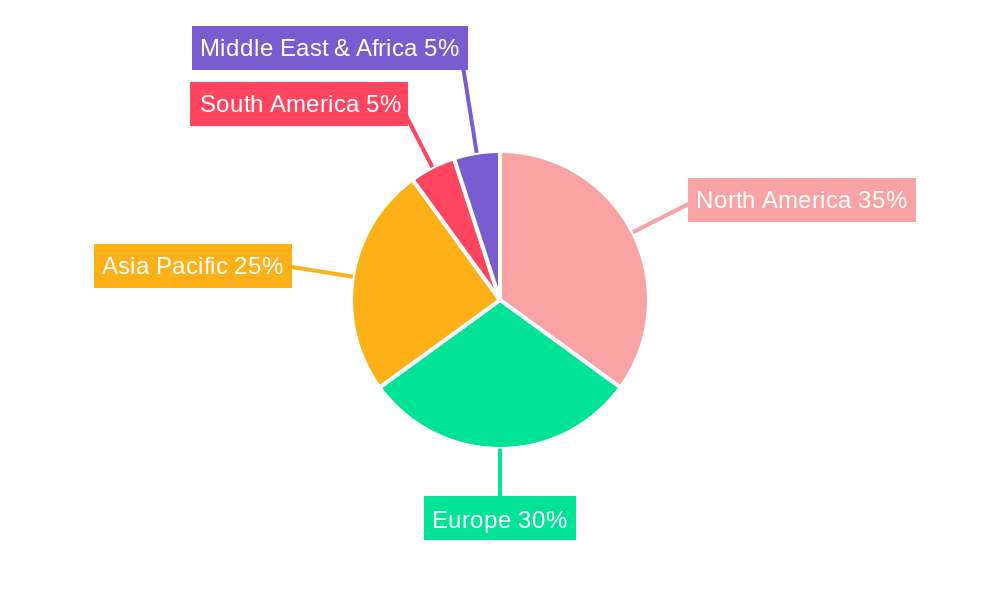
The industry's segmentation reflects its diverse applications. The dominant segments are plant-based meat alternatives, followed by dairy and egg alternatives. Within the source category, food and beverage industries represent the largest consumer, with animal feed showing significant potential for future growth. Geographical distribution showcases robust growth across North America and Europe, driven by established markets and consumer adoption. However, Asia-Pacific presents significant untapped potential, with burgeoning middle classes and rapidly increasing demand for protein sources. While challenges exist, such as addressing the cost-competitiveness of alternative proteins compared to traditional counterparts and overcoming consumer perceptions regarding taste and texture, ongoing innovation and scaling economies of production are expected to mitigate these factors over the forecast period. Leading companies like Bühler, Cargill, ADM, and Kerry are driving innovation and market penetration through strategic partnerships, acquisitions, and product development.
Alternative Protein Industry: A Comprehensive Market Report (2019-2033)
This comprehensive report provides a detailed analysis of the Alternative Protein Industry, offering invaluable insights for stakeholders, investors, and industry professionals. The report covers the period from 2019 to 2033, with a focus on the forecast period from 2025 to 2033 and a base year of 2025. The market size is projected to reach xx Million by 2033, exhibiting a CAGR of xx% during the forecast period.
Alternative Protein Industry Market Concentration & Innovation
The Alternative Protein Industry is characterized by a moderately concentrated market structure, with several large multinational corporations holding significant market share. Key players such as Bühler Holdings AG, Cargill Incorporated, Archer Daniels Midland Company, and Kerry Inc. are driving innovation through significant R&D investments and strategic acquisitions. Market share data for 2024 indicates that Cargill holds approximately xx% market share, ADM holds approximately xx%, and Bühler holds approximately xx%, while other players share the remaining market.
- Innovation Drivers: Technological advancements in protein extraction, formulation, and processing are key drivers. Consumer demand for sustainable and healthier food options is also fueling innovation.
- Regulatory Frameworks: Government regulations regarding labeling, food safety, and sustainability are shaping industry practices. Variations in regulations across different geographies present both challenges and opportunities.
- Product Substitutes: Traditional protein sources like meat and dairy continue to compete with alternative proteins, posing a challenge to market penetration. However, the increasing awareness of the environmental and health benefits of alternative proteins is driving a shift in consumer preference.
- End-User Trends: Growing consumer awareness of health, environmental, and ethical concerns related to traditional animal agriculture is driving increased demand for alternative protein products.
- M&A Activities: The industry has witnessed a significant number of mergers and acquisitions (M&A) in recent years, with deals exceeding xx Million in total value during the historical period (2019-2024). These activities reflect the increasing consolidation and strategic expansion within the sector. Examples include ADM's acquisition of Sojaprotein in 2021.
Alternative Protein Industry Industry Trends & Insights
The alternative protein industry is experiencing robust growth, driven by a confluence of factors. The market is witnessing a paradigm shift, with consumers increasingly adopting plant-based alternatives due to health, environmental, and ethical considerations. Technological advancements, such as precision fermentation and cell-based meat cultivation, are disrupting traditional production methods and expanding the range of available products.
The market growth is primarily driven by increasing consumer awareness of the environmental impact of traditional animal agriculture, rising health consciousness, and the growing popularity of vegan and vegetarian lifestyles. The industry is witnessing a surge in product diversification, with new entrants introducing innovative products in diverse applications. Competitive dynamics are characterized by both collaboration and competition, with established food companies partnering with startups and smaller players to accelerate innovation and market penetration. This intense competition is fostering innovation and driving down prices, making alternative proteins more accessible to a broader consumer base. The market penetration of alternative proteins in food and beverage applications is projected to reach xx% by 2033, significantly higher than the xx% recorded in 2024.
Dominant Markets & Segments in Alternative Protein Industry
Dominant Regions: North America and Europe currently hold significant market share, driven by high consumer awareness and established infrastructure. However, Asia-Pacific is projected to witness the fastest growth during the forecast period due to expanding middle class and increasing disposable incomes.
Dominant Segments (By Source):
- Plant-Based Proteins: This segment is currently dominant, driven by cost-effectiveness and technological maturity of plant protein extraction and processing. Soy, pea, and other legume-based proteins are leading the market.
- Animal Feed Industries: The demand for alternative protein sources in animal feed is growing rapidly due to increasing concerns about sustainability and animal welfare.
Dominant Segments (By Application):
- Plant-Based Meat Alternatives: This is the fastest-growing segment, driven by continuous product innovation and increasing consumer acceptance of plant-based burgers, sausages, and other meat substitutes.
- Dairy Alternatives: Plant-based milk, yogurt, and cheese alternatives are gaining popularity, particularly among lactose-intolerant and vegan consumers.
- Egg Alternatives: Plant-based egg alternatives are seeing increased adoption in baking, cooking, and other food applications.
Key Drivers of Regional Dominance:
- North America & Europe: Strong regulatory support, advanced infrastructure, high consumer awareness, and high disposable income.
- Asia-Pacific: Rapidly expanding middle class, increasing disposable incomes, rising demand for healthier food options, favorable government policies promoting sustainable agriculture.
Alternative Protein Industry Product Developments
Recent product developments highlight the increasing sophistication of alternative proteins. Companies are focused on improving the taste, texture, and nutritional profile of their products to compete with traditional animal-based proteins. Technological advancements like precision fermentation and cultivated meat are enabling the creation of entirely new types of alternative proteins with improved functionalities. The market is also witnessing an increased focus on allergen-free and sustainable sourcing, driving the adoption of pea, rice, and other less allergenic protein sources.
Report Scope & Segmentation Analysis
This report segments the alternative protein market by source (plant-based, fungal-based, insect-based, cell-based) and application (plant-based meat, dairy alternatives, egg alternatives, food & beverages, animal feed). Each segment's growth projections, market sizes, and competitive dynamics are analyzed in detail. The market is projected to reach xx Million by 2033. The plant-based segment dominates the market currently, but cell-based and insect-based proteins are expected to gain market share over the forecast period. Similarly, the plant-based meat alternatives segment currently leads in terms of application, however, other segments are showing strong growth.
Key Drivers of Alternative Protein Industry Growth
Several key factors are driving the growth of the alternative protein industry. These include:
- Growing consumer awareness of health and environmental concerns: Increasing awareness of the negative environmental and health impacts associated with traditional animal agriculture is propelling the shift towards more sustainable and healthier protein sources.
- Technological advancements: Innovations in protein extraction, formulation, and processing technologies are improving the quality, taste, and affordability of alternative protein products.
- Favorable regulatory policies: Governments worldwide are increasingly supporting the development and adoption of alternative proteins through various incentives and regulatory frameworks. For example, many countries are providing funding for R&D.
- Rising demand for ethical and sustainable food options: Consumers are increasingly demanding more ethically and sustainably sourced food products, and alternative proteins are aligned with these values.
Challenges in the Alternative Protein Industry Sector
Despite the significant growth potential, the alternative protein industry faces several challenges:
- High production costs: The production of some alternative protein sources, particularly cell-based meats, remains relatively expensive compared to traditional animal-based products.
- Supply chain limitations: The current supply chains for some alternative protein ingredients are not yet fully developed, potentially hindering large-scale production and distribution.
- Consumer perception and acceptance: While consumer acceptance is growing, overcoming some negative perceptions about taste, texture, and nutritional value of certain alternative proteins remains a challenge.
- Regulatory uncertainty: Varying regulations across different jurisdictions could create hurdles for industry growth and expansion.
Emerging Opportunities in Alternative Protein Industry
The alternative protein industry presents numerous emerging opportunities:
- New product development: The ongoing innovation in alternative protein production, such as cultivated meat and precision fermentation, presents various possibilities for new product development.
- Expansion into new markets: Untapped markets, especially in developing countries with rising middle classes, present substantial growth opportunities.
- Sustainability initiatives: Consumers increasingly prioritize sustainability, presenting an opportunity for companies to highlight the environmental benefits of alternative protein products through eco-friendly packaging and production.
Leading Players in the Alternative Protein Industry Market
- BÜHLER HOLDINGS AG
- Cargill Incorporated
- The Archer Daniels Midland Company
- Kerry Inc
- DuPont de Nemours Inc
- Glanbia PLC
- Roquette Freres
- Royal Avebe UA
- Ingredion Incorporated
- Corbion NV
Key Developments in Alternative Protein Industry Industry
- 2021: ADM announced the acquisition of Sojaprotein, strengthening its position in the non-GMO soy ingredient market.
- 2020: Kerry introduced 13 new plant-based, allergen-free protein options, expanding its product portfolio in the plant-based protein market.
- 2020: Cargill expanded its pea protein product line (RadiPure and Puris) into European markets.
Strategic Outlook for Alternative Protein Industry Market
The alternative protein market is poised for significant growth in the coming years. Continued innovation, increasing consumer demand, and favorable government policies will be key catalysts for this growth. The market's future potential is substantial, with opportunities for both established players and new entrants to capitalize on the expanding demand for sustainable and healthier protein sources. The focus on developing more cost-effective and scalable production methods will be crucial for unlocking the full potential of this market.
Alternative Protein Industry Segmentation
-
1. Source
-
1.1. Plant Protein
- 1.1.1. Soy Protein
- 1.1.2. Wheat Protein
- 1.1.3. Pea Protein
- 1.1.4. Other Plant Proteins
- 1.2. Mycoprotein
- 1.3. Algal protein
- 1.4. Insect Protein
-
1.1. Plant Protein
-
2. Application
-
2.1. Food and Beverage
- 2.1.1. Bakery
- 2.1.2. Confectionery
- 2.1.3. Plant-Based Dairy Products
- 2.1.4. Beverages
- 2.1.5. Other Food and Beverages
- 2.2. Dietary Supplements
- 2.3. Animal Feed and Pet Food
- 2.4. Personal Care and Cosmetics
-
2.1. Food and Beverage
Alternative Protein Industry Segmentation By Geography
-
1. North America
- 1.1. United States
- 1.2. Canada
- 1.3. Mexico
- 1.4. Rest of North America
-
2. Europe
- 2.1. Spain
- 2.2. United Kingdom
- 2.3. Germany
- 2.4. France
- 2.5. Italy
- 2.6. Russia
- 2.7. Rest of Europe
-
3. Asia Pacific
- 3.1. China
- 3.2. Japan
- 3.3. India
- 3.4. Australia
- 3.5. Rest of Asia Pacific
-
4. South America
- 4.1. Brazil
- 4.2. Argentina
- 4.3. Rest of South America
-
5. Middle East and Africa
- 5.1. South Africa
- 5.2. Saudi Arabia
- 5.3. Rest of Middle East and Africa
Alternative Protein Industry REPORT HIGHLIGHTS
| Aspects | Details |
|---|---|
| Study Period | 2019-2033 |
| Base Year | 2024 |
| Estimated Year | 2025 |
| Forecast Period | 2025-2033 |
| Historical Period | 2019-2024 |
| Growth Rate | CAGR of 3.68% from 2019-2033 |
| Segmentation |
|
Table of Contents
- 1. Introduction
- 1.1. Research Scope
- 1.2. Market Segmentation
- 1.3. Research Methodology
- 1.4. Definitions and Assumptions
- 2. Executive Summary
- 2.1. Introduction
- 3. Market Dynamics
- 3.1. Introduction
- 3.2. Market Drivers
- 3.2.1. Increasing Demand for Vegan Food & Beverages Driving the Market; Intolerance and Allergies Associated with Animal Protein Products
- 3.3. Market Restrains
- 3.3.1. High Market Penetration of Animal Protein
- 3.4. Market Trends
- 3.4.1. Growing Preference For Plant-Based Protein Products
- 4. Market Factor Analysis
- 4.1. Porters Five Forces
- 4.2. Supply/Value Chain
- 4.3. PESTEL analysis
- 4.4. Market Entropy
- 4.5. Patent/Trademark Analysis
- 5. Global Alternative Protein Industry Analysis, Insights and Forecast, 2019-2031
- 5.1. Market Analysis, Insights and Forecast - by Source
- 5.1.1. Plant Protein
- 5.1.1.1. Soy Protein
- 5.1.1.2. Wheat Protein
- 5.1.1.3. Pea Protein
- 5.1.1.4. Other Plant Proteins
- 5.1.2. Mycoprotein
- 5.1.3. Algal protein
- 5.1.4. Insect Protein
- 5.1.1. Plant Protein
- 5.2. Market Analysis, Insights and Forecast - by Application
- 5.2.1. Food and Beverage
- 5.2.1.1. Bakery
- 5.2.1.2. Confectionery
- 5.2.1.3. Plant-Based Dairy Products
- 5.2.1.4. Beverages
- 5.2.1.5. Other Food and Beverages
- 5.2.2. Dietary Supplements
- 5.2.3. Animal Feed and Pet Food
- 5.2.4. Personal Care and Cosmetics
- 5.2.1. Food and Beverage
- 5.3. Market Analysis, Insights and Forecast - by Region
- 5.3.1. North America
- 5.3.2. Europe
- 5.3.3. Asia Pacific
- 5.3.4. South America
- 5.3.5. Middle East and Africa
- 5.1. Market Analysis, Insights and Forecast - by Source
- 6. North America Alternative Protein Industry Analysis, Insights and Forecast, 2019-2031
- 6.1. Market Analysis, Insights and Forecast - by Source
- 6.1.1. Plant Protein
- 6.1.1.1. Soy Protein
- 6.1.1.2. Wheat Protein
- 6.1.1.3. Pea Protein
- 6.1.1.4. Other Plant Proteins
- 6.1.2. Mycoprotein
- 6.1.3. Algal protein
- 6.1.4. Insect Protein
- 6.1.1. Plant Protein
- 6.2. Market Analysis, Insights and Forecast - by Application
- 6.2.1. Food and Beverage
- 6.2.1.1. Bakery
- 6.2.1.2. Confectionery
- 6.2.1.3. Plant-Based Dairy Products
- 6.2.1.4. Beverages
- 6.2.1.5. Other Food and Beverages
- 6.2.2. Dietary Supplements
- 6.2.3. Animal Feed and Pet Food
- 6.2.4. Personal Care and Cosmetics
- 6.2.1. Food and Beverage
- 6.1. Market Analysis, Insights and Forecast - by Source
- 7. Europe Alternative Protein Industry Analysis, Insights and Forecast, 2019-2031
- 7.1. Market Analysis, Insights and Forecast - by Source
- 7.1.1. Plant Protein
- 7.1.1.1. Soy Protein
- 7.1.1.2. Wheat Protein
- 7.1.1.3. Pea Protein
- 7.1.1.4. Other Plant Proteins
- 7.1.2. Mycoprotein
- 7.1.3. Algal protein
- 7.1.4. Insect Protein
- 7.1.1. Plant Protein
- 7.2. Market Analysis, Insights and Forecast - by Application
- 7.2.1. Food and Beverage
- 7.2.1.1. Bakery
- 7.2.1.2. Confectionery
- 7.2.1.3. Plant-Based Dairy Products
- 7.2.1.4. Beverages
- 7.2.1.5. Other Food and Beverages
- 7.2.2. Dietary Supplements
- 7.2.3. Animal Feed and Pet Food
- 7.2.4. Personal Care and Cosmetics
- 7.2.1. Food and Beverage
- 7.1. Market Analysis, Insights and Forecast - by Source
- 8. Asia Pacific Alternative Protein Industry Analysis, Insights and Forecast, 2019-2031
- 8.1. Market Analysis, Insights and Forecast - by Source
- 8.1.1. Plant Protein
- 8.1.1.1. Soy Protein
- 8.1.1.2. Wheat Protein
- 8.1.1.3. Pea Protein
- 8.1.1.4. Other Plant Proteins
- 8.1.2. Mycoprotein
- 8.1.3. Algal protein
- 8.1.4. Insect Protein
- 8.1.1. Plant Protein
- 8.2. Market Analysis, Insights and Forecast - by Application
- 8.2.1. Food and Beverage
- 8.2.1.1. Bakery
- 8.2.1.2. Confectionery
- 8.2.1.3. Plant-Based Dairy Products
- 8.2.1.4. Beverages
- 8.2.1.5. Other Food and Beverages
- 8.2.2. Dietary Supplements
- 8.2.3. Animal Feed and Pet Food
- 8.2.4. Personal Care and Cosmetics
- 8.2.1. Food and Beverage
- 8.1. Market Analysis, Insights and Forecast - by Source
- 9. South America Alternative Protein Industry Analysis, Insights and Forecast, 2019-2031
- 9.1. Market Analysis, Insights and Forecast - by Source
- 9.1.1. Plant Protein
- 9.1.1.1. Soy Protein
- 9.1.1.2. Wheat Protein
- 9.1.1.3. Pea Protein
- 9.1.1.4. Other Plant Proteins
- 9.1.2. Mycoprotein
- 9.1.3. Algal protein
- 9.1.4. Insect Protein
- 9.1.1. Plant Protein
- 9.2. Market Analysis, Insights and Forecast - by Application
- 9.2.1. Food and Beverage
- 9.2.1.1. Bakery
- 9.2.1.2. Confectionery
- 9.2.1.3. Plant-Based Dairy Products
- 9.2.1.4. Beverages
- 9.2.1.5. Other Food and Beverages
- 9.2.2. Dietary Supplements
- 9.2.3. Animal Feed and Pet Food
- 9.2.4. Personal Care and Cosmetics
- 9.2.1. Food and Beverage
- 9.1. Market Analysis, Insights and Forecast - by Source
- 10. Middle East and Africa Alternative Protein Industry Analysis, Insights and Forecast, 2019-2031
- 10.1. Market Analysis, Insights and Forecast - by Source
- 10.1.1. Plant Protein
- 10.1.1.1. Soy Protein
- 10.1.1.2. Wheat Protein
- 10.1.1.3. Pea Protein
- 10.1.1.4. Other Plant Proteins
- 10.1.2. Mycoprotein
- 10.1.3. Algal protein
- 10.1.4. Insect Protein
- 10.1.1. Plant Protein
- 10.2. Market Analysis, Insights and Forecast - by Application
- 10.2.1. Food and Beverage
- 10.2.1.1. Bakery
- 10.2.1.2. Confectionery
- 10.2.1.3. Plant-Based Dairy Products
- 10.2.1.4. Beverages
- 10.2.1.5. Other Food and Beverages
- 10.2.2. Dietary Supplements
- 10.2.3. Animal Feed and Pet Food
- 10.2.4. Personal Care and Cosmetics
- 10.2.1. Food and Beverage
- 10.1. Market Analysis, Insights and Forecast - by Source
- 11. North America Alternative Protein Industry Analysis, Insights and Forecast, 2019-2031
- 11.1. Market Analysis, Insights and Forecast - By Country/Sub-region
- 11.1.1 United States
- 11.1.2 Canada
- 11.1.3 Mexico
- 11.1.4 Rest of North America
- 12. Europe Alternative Protein Industry Analysis, Insights and Forecast, 2019-2031
- 12.1. Market Analysis, Insights and Forecast - By Country/Sub-region
- 12.1.1 Spain
- 12.1.2 United Kingdom
- 12.1.3 Germany
- 12.1.4 France
- 12.1.5 Italy
- 12.1.6 Russia
- 12.1.7 Rest of Europe
- 13. Asia Pacific Alternative Protein Industry Analysis, Insights and Forecast, 2019-2031
- 13.1. Market Analysis, Insights and Forecast - By Country/Sub-region
- 13.1.1 China
- 13.1.2 Japan
- 13.1.3 India
- 13.1.4 Australia
- 13.1.5 Rest of Asia Pacific
- 14. South America Alternative Protein Industry Analysis, Insights and Forecast, 2019-2031
- 14.1. Market Analysis, Insights and Forecast - By Country/Sub-region
- 14.1.1 Brazil
- 14.1.2 Argentina
- 14.1.3 Rest of South America
- 15. Middle East & Africa Alternative Protein Industry Analysis, Insights and Forecast, 2019-2031
- 15.1. Market Analysis, Insights and Forecast - By Country/Sub-region
- 15.1.1 UAE
- 15.1.2 South Africa
- 15.1.3 Saudi Arabia
- 15.1.4 Rest of MEA
- 16. Competitive Analysis
- 16.1. Global Market Share Analysis 2024
- 16.2. Company Profiles
- 16.2.1 BÜHLER HOLDINGS AG
- 16.2.1.1. Overview
- 16.2.1.2. Products
- 16.2.1.3. SWOT Analysis
- 16.2.1.4. Recent Developments
- 16.2.1.5. Financials (Based on Availability)
- 16.2.2 Cargill Incorporated
- 16.2.2.1. Overview
- 16.2.2.2. Products
- 16.2.2.3. SWOT Analysis
- 16.2.2.4. Recent Developments
- 16.2.2.5. Financials (Based on Availability)
- 16.2.3 The Archer Daniels Midland Company
- 16.2.3.1. Overview
- 16.2.3.2. Products
- 16.2.3.3. SWOT Analysis
- 16.2.3.4. Recent Developments
- 16.2.3.5. Financials (Based on Availability)
- 16.2.4 Kerry Inc
- 16.2.4.1. Overview
- 16.2.4.2. Products
- 16.2.4.3. SWOT Analysis
- 16.2.4.4. Recent Developments
- 16.2.4.5. Financials (Based on Availability)
- 16.2.5 DuPont de Nemours Inc
- 16.2.5.1. Overview
- 16.2.5.2. Products
- 16.2.5.3. SWOT Analysis
- 16.2.5.4. Recent Developments
- 16.2.5.5. Financials (Based on Availability)
- 16.2.6 Glanbia PLC
- 16.2.6.1. Overview
- 16.2.6.2. Products
- 16.2.6.3. SWOT Analysis
- 16.2.6.4. Recent Developments
- 16.2.6.5. Financials (Based on Availability)
- 16.2.7 Roquette Freres*List Not Exhaustive
- 16.2.7.1. Overview
- 16.2.7.2. Products
- 16.2.7.3. SWOT Analysis
- 16.2.7.4. Recent Developments
- 16.2.7.5. Financials (Based on Availability)
- 16.2.8 Royal Avebe UA
- 16.2.8.1. Overview
- 16.2.8.2. Products
- 16.2.8.3. SWOT Analysis
- 16.2.8.4. Recent Developments
- 16.2.8.5. Financials (Based on Availability)
- 16.2.9 Ingredion Incorporated
- 16.2.9.1. Overview
- 16.2.9.2. Products
- 16.2.9.3. SWOT Analysis
- 16.2.9.4. Recent Developments
- 16.2.9.5. Financials (Based on Availability)
- 16.2.10 Corbion NV
- 16.2.10.1. Overview
- 16.2.10.2. Products
- 16.2.10.3. SWOT Analysis
- 16.2.10.4. Recent Developments
- 16.2.10.5. Financials (Based on Availability)
- 16.2.1 BÜHLER HOLDINGS AG
List of Figures
- Figure 1: Global Alternative Protein Industry Revenue Breakdown (Million, %) by Region 2024 & 2032
- Figure 2: North America Alternative Protein Industry Revenue (Million), by Country 2024 & 2032
- Figure 3: North America Alternative Protein Industry Revenue Share (%), by Country 2024 & 2032
- Figure 4: Europe Alternative Protein Industry Revenue (Million), by Country 2024 & 2032
- Figure 5: Europe Alternative Protein Industry Revenue Share (%), by Country 2024 & 2032
- Figure 6: Asia Pacific Alternative Protein Industry Revenue (Million), by Country 2024 & 2032
- Figure 7: Asia Pacific Alternative Protein Industry Revenue Share (%), by Country 2024 & 2032
- Figure 8: South America Alternative Protein Industry Revenue (Million), by Country 2024 & 2032
- Figure 9: South America Alternative Protein Industry Revenue Share (%), by Country 2024 & 2032
- Figure 10: Middle East & Africa Alternative Protein Industry Revenue (Million), by Country 2024 & 2032
- Figure 11: Middle East & Africa Alternative Protein Industry Revenue Share (%), by Country 2024 & 2032
- Figure 12: North America Alternative Protein Industry Revenue (Million), by Source 2024 & 2032
- Figure 13: North America Alternative Protein Industry Revenue Share (%), by Source 2024 & 2032
- Figure 14: North America Alternative Protein Industry Revenue (Million), by Application 2024 & 2032
- Figure 15: North America Alternative Protein Industry Revenue Share (%), by Application 2024 & 2032
- Figure 16: North America Alternative Protein Industry Revenue (Million), by Country 2024 & 2032
- Figure 17: North America Alternative Protein Industry Revenue Share (%), by Country 2024 & 2032
- Figure 18: Europe Alternative Protein Industry Revenue (Million), by Source 2024 & 2032
- Figure 19: Europe Alternative Protein Industry Revenue Share (%), by Source 2024 & 2032
- Figure 20: Europe Alternative Protein Industry Revenue (Million), by Application 2024 & 2032
- Figure 21: Europe Alternative Protein Industry Revenue Share (%), by Application 2024 & 2032
- Figure 22: Europe Alternative Protein Industry Revenue (Million), by Country 2024 & 2032
- Figure 23: Europe Alternative Protein Industry Revenue Share (%), by Country 2024 & 2032
- Figure 24: Asia Pacific Alternative Protein Industry Revenue (Million), by Source 2024 & 2032
- Figure 25: Asia Pacific Alternative Protein Industry Revenue Share (%), by Source 2024 & 2032
- Figure 26: Asia Pacific Alternative Protein Industry Revenue (Million), by Application 2024 & 2032
- Figure 27: Asia Pacific Alternative Protein Industry Revenue Share (%), by Application 2024 & 2032
- Figure 28: Asia Pacific Alternative Protein Industry Revenue (Million), by Country 2024 & 2032
- Figure 29: Asia Pacific Alternative Protein Industry Revenue Share (%), by Country 2024 & 2032
- Figure 30: South America Alternative Protein Industry Revenue (Million), by Source 2024 & 2032
- Figure 31: South America Alternative Protein Industry Revenue Share (%), by Source 2024 & 2032
- Figure 32: South America Alternative Protein Industry Revenue (Million), by Application 2024 & 2032
- Figure 33: South America Alternative Protein Industry Revenue Share (%), by Application 2024 & 2032
- Figure 34: South America Alternative Protein Industry Revenue (Million), by Country 2024 & 2032
- Figure 35: South America Alternative Protein Industry Revenue Share (%), by Country 2024 & 2032
- Figure 36: Middle East and Africa Alternative Protein Industry Revenue (Million), by Source 2024 & 2032
- Figure 37: Middle East and Africa Alternative Protein Industry Revenue Share (%), by Source 2024 & 2032
- Figure 38: Middle East and Africa Alternative Protein Industry Revenue (Million), by Application 2024 & 2032
- Figure 39: Middle East and Africa Alternative Protein Industry Revenue Share (%), by Application 2024 & 2032
- Figure 40: Middle East and Africa Alternative Protein Industry Revenue (Million), by Country 2024 & 2032
- Figure 41: Middle East and Africa Alternative Protein Industry Revenue Share (%), by Country 2024 & 2032
List of Tables
- Table 1: Global Alternative Protein Industry Revenue Million Forecast, by Region 2019 & 2032
- Table 2: Global Alternative Protein Industry Revenue Million Forecast, by Source 2019 & 2032
- Table 3: Global Alternative Protein Industry Revenue Million Forecast, by Application 2019 & 2032
- Table 4: Global Alternative Protein Industry Revenue Million Forecast, by Region 2019 & 2032
- Table 5: Global Alternative Protein Industry Revenue Million Forecast, by Country 2019 & 2032
- Table 6: United States Alternative Protein Industry Revenue (Million) Forecast, by Application 2019 & 2032
- Table 7: Canada Alternative Protein Industry Revenue (Million) Forecast, by Application 2019 & 2032
- Table 8: Mexico Alternative Protein Industry Revenue (Million) Forecast, by Application 2019 & 2032
- Table 9: Rest of North America Alternative Protein Industry Revenue (Million) Forecast, by Application 2019 & 2032
- Table 10: Global Alternative Protein Industry Revenue Million Forecast, by Country 2019 & 2032
- Table 11: Spain Alternative Protein Industry Revenue (Million) Forecast, by Application 2019 & 2032
- Table 12: United Kingdom Alternative Protein Industry Revenue (Million) Forecast, by Application 2019 & 2032
- Table 13: Germany Alternative Protein Industry Revenue (Million) Forecast, by Application 2019 & 2032
- Table 14: France Alternative Protein Industry Revenue (Million) Forecast, by Application 2019 & 2032
- Table 15: Italy Alternative Protein Industry Revenue (Million) Forecast, by Application 2019 & 2032
- Table 16: Russia Alternative Protein Industry Revenue (Million) Forecast, by Application 2019 & 2032
- Table 17: Rest of Europe Alternative Protein Industry Revenue (Million) Forecast, by Application 2019 & 2032
- Table 18: Global Alternative Protein Industry Revenue Million Forecast, by Country 2019 & 2032
- Table 19: China Alternative Protein Industry Revenue (Million) Forecast, by Application 2019 & 2032
- Table 20: Japan Alternative Protein Industry Revenue (Million) Forecast, by Application 2019 & 2032
- Table 21: India Alternative Protein Industry Revenue (Million) Forecast, by Application 2019 & 2032
- Table 22: Australia Alternative Protein Industry Revenue (Million) Forecast, by Application 2019 & 2032
- Table 23: Rest of Asia Pacific Alternative Protein Industry Revenue (Million) Forecast, by Application 2019 & 2032
- Table 24: Global Alternative Protein Industry Revenue Million Forecast, by Country 2019 & 2032
- Table 25: Brazil Alternative Protein Industry Revenue (Million) Forecast, by Application 2019 & 2032
- Table 26: Argentina Alternative Protein Industry Revenue (Million) Forecast, by Application 2019 & 2032
- Table 27: Rest of South America Alternative Protein Industry Revenue (Million) Forecast, by Application 2019 & 2032
- Table 28: Global Alternative Protein Industry Revenue Million Forecast, by Country 2019 & 2032
- Table 29: UAE Alternative Protein Industry Revenue (Million) Forecast, by Application 2019 & 2032
- Table 30: South Africa Alternative Protein Industry Revenue (Million) Forecast, by Application 2019 & 2032
- Table 31: Saudi Arabia Alternative Protein Industry Revenue (Million) Forecast, by Application 2019 & 2032
- Table 32: Rest of MEA Alternative Protein Industry Revenue (Million) Forecast, by Application 2019 & 2032
- Table 33: Global Alternative Protein Industry Revenue Million Forecast, by Source 2019 & 2032
- Table 34: Global Alternative Protein Industry Revenue Million Forecast, by Application 2019 & 2032
- Table 35: Global Alternative Protein Industry Revenue Million Forecast, by Country 2019 & 2032
- Table 36: United States Alternative Protein Industry Revenue (Million) Forecast, by Application 2019 & 2032
- Table 37: Canada Alternative Protein Industry Revenue (Million) Forecast, by Application 2019 & 2032
- Table 38: Mexico Alternative Protein Industry Revenue (Million) Forecast, by Application 2019 & 2032
- Table 39: Rest of North America Alternative Protein Industry Revenue (Million) Forecast, by Application 2019 & 2032
- Table 40: Global Alternative Protein Industry Revenue Million Forecast, by Source 2019 & 2032
- Table 41: Global Alternative Protein Industry Revenue Million Forecast, by Application 2019 & 2032
- Table 42: Global Alternative Protein Industry Revenue Million Forecast, by Country 2019 & 2032
- Table 43: Spain Alternative Protein Industry Revenue (Million) Forecast, by Application 2019 & 2032
- Table 44: United Kingdom Alternative Protein Industry Revenue (Million) Forecast, by Application 2019 & 2032
- Table 45: Germany Alternative Protein Industry Revenue (Million) Forecast, by Application 2019 & 2032
- Table 46: France Alternative Protein Industry Revenue (Million) Forecast, by Application 2019 & 2032
- Table 47: Italy Alternative Protein Industry Revenue (Million) Forecast, by Application 2019 & 2032
- Table 48: Russia Alternative Protein Industry Revenue (Million) Forecast, by Application 2019 & 2032
- Table 49: Rest of Europe Alternative Protein Industry Revenue (Million) Forecast, by Application 2019 & 2032
- Table 50: Global Alternative Protein Industry Revenue Million Forecast, by Source 2019 & 2032
- Table 51: Global Alternative Protein Industry Revenue Million Forecast, by Application 2019 & 2032
- Table 52: Global Alternative Protein Industry Revenue Million Forecast, by Country 2019 & 2032
- Table 53: China Alternative Protein Industry Revenue (Million) Forecast, by Application 2019 & 2032
- Table 54: Japan Alternative Protein Industry Revenue (Million) Forecast, by Application 2019 & 2032
- Table 55: India Alternative Protein Industry Revenue (Million) Forecast, by Application 2019 & 2032
- Table 56: Australia Alternative Protein Industry Revenue (Million) Forecast, by Application 2019 & 2032
- Table 57: Rest of Asia Pacific Alternative Protein Industry Revenue (Million) Forecast, by Application 2019 & 2032
- Table 58: Global Alternative Protein Industry Revenue Million Forecast, by Source 2019 & 2032
- Table 59: Global Alternative Protein Industry Revenue Million Forecast, by Application 2019 & 2032
- Table 60: Global Alternative Protein Industry Revenue Million Forecast, by Country 2019 & 2032
- Table 61: Brazil Alternative Protein Industry Revenue (Million) Forecast, by Application 2019 & 2032
- Table 62: Argentina Alternative Protein Industry Revenue (Million) Forecast, by Application 2019 & 2032
- Table 63: Rest of South America Alternative Protein Industry Revenue (Million) Forecast, by Application 2019 & 2032
- Table 64: Global Alternative Protein Industry Revenue Million Forecast, by Source 2019 & 2032
- Table 65: Global Alternative Protein Industry Revenue Million Forecast, by Application 2019 & 2032
- Table 66: Global Alternative Protein Industry Revenue Million Forecast, by Country 2019 & 2032
- Table 67: South Africa Alternative Protein Industry Revenue (Million) Forecast, by Application 2019 & 2032
- Table 68: Saudi Arabia Alternative Protein Industry Revenue (Million) Forecast, by Application 2019 & 2032
- Table 69: Rest of Middle East and Africa Alternative Protein Industry Revenue (Million) Forecast, by Application 2019 & 2032
Frequently Asked Questions
1. What is the projected Compound Annual Growth Rate (CAGR) of the Alternative Protein Industry?
The projected CAGR is approximately 3.68%.
2. Which companies are prominent players in the Alternative Protein Industry?
Key companies in the market include BÜHLER HOLDINGS AG, Cargill Incorporated, The Archer Daniels Midland Company, Kerry Inc, DuPont de Nemours Inc, Glanbia PLC, Roquette Freres*List Not Exhaustive, Royal Avebe UA, Ingredion Incorporated, Corbion NV.
3. What are the main segments of the Alternative Protein Industry?
The market segments include Source, Application.
4. Can you provide details about the market size?
The market size is estimated to be USD 15.19 Million as of 2022.
5. What are some drivers contributing to market growth?
Increasing Demand for Vegan Food & Beverages Driving the Market; Intolerance and Allergies Associated with Animal Protein Products.
6. What are the notable trends driving market growth?
Growing Preference For Plant-Based Protein Products.
7. Are there any restraints impacting market growth?
High Market Penetration of Animal Protein.
8. Can you provide examples of recent developments in the market?
In 2021, ADM announced that it had reached an agreement to acquire Sojaprotein, a leading European provider of non-GMO soy ingredients.
9. What pricing options are available for accessing the report?
Pricing options include single-user, multi-user, and enterprise licenses priced at USD 4750, USD 5250, and USD 8750 respectively.
10. Is the market size provided in terms of value or volume?
The market size is provided in terms of value, measured in Million.
11. Are there any specific market keywords associated with the report?
Yes, the market keyword associated with the report is "Alternative Protein Industry," which aids in identifying and referencing the specific market segment covered.
12. How do I determine which pricing option suits my needs best?
The pricing options vary based on user requirements and access needs. Individual users may opt for single-user licenses, while businesses requiring broader access may choose multi-user or enterprise licenses for cost-effective access to the report.
13. Are there any additional resources or data provided in the Alternative Protein Industry report?
While the report offers comprehensive insights, it's advisable to review the specific contents or supplementary materials provided to ascertain if additional resources or data are available.
14. How can I stay updated on further developments or reports in the Alternative Protein Industry?
To stay informed about further developments, trends, and reports in the Alternative Protein Industry, consider subscribing to industry newsletters, following relevant companies and organizations, or regularly checking reputable industry news sources and publications.
Methodology
Step 1 - Identification of Relevant Samples Size from Population Database


Step 2 - Approaches for Defining Global Market Size (Value, Volume* & Price*)

Note*: In applicable scenarios
Step 3 - Data Sources
Primary Research
- Web Analytics
- Survey Reports
- Research Institute
- Latest Research Reports
- Opinion Leaders
Secondary Research
- Annual Reports
- White Paper
- Latest Press Release
- Industry Association
- Paid Database
- Investor Presentations

Step 4 - Data Triangulation
Involves using different sources of information in order to increase the validity of a study
These sources are likely to be stakeholders in a program - participants, other researchers, program staff, other community members, and so on.
Then we put all data in single framework & apply various statistical tools to find out the dynamic on the market.
During the analysis stage, feedback from the stakeholder groups would be compared to determine areas of agreement as well as areas of divergence


