
Key Insights
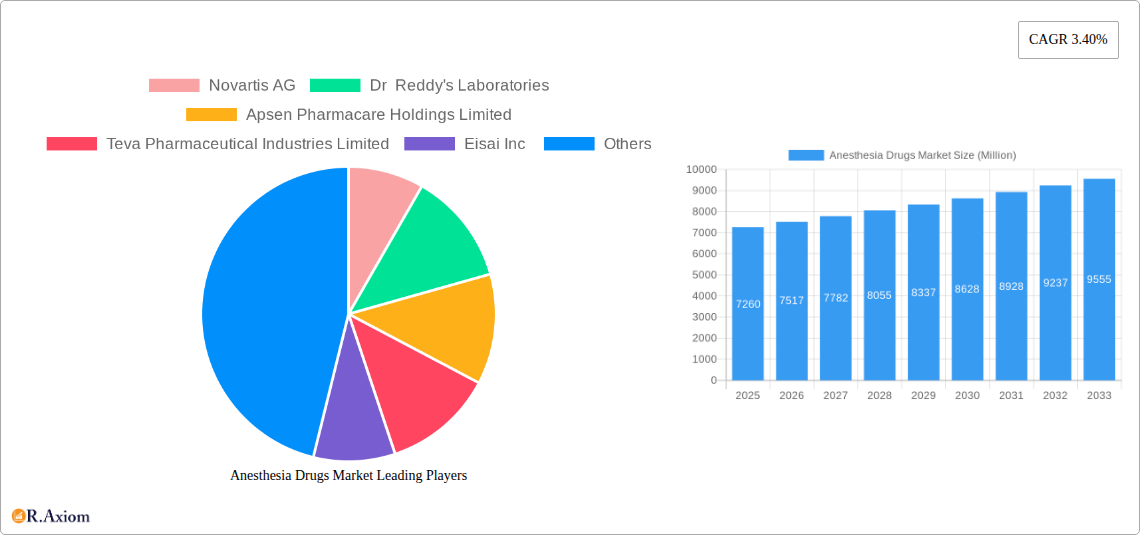
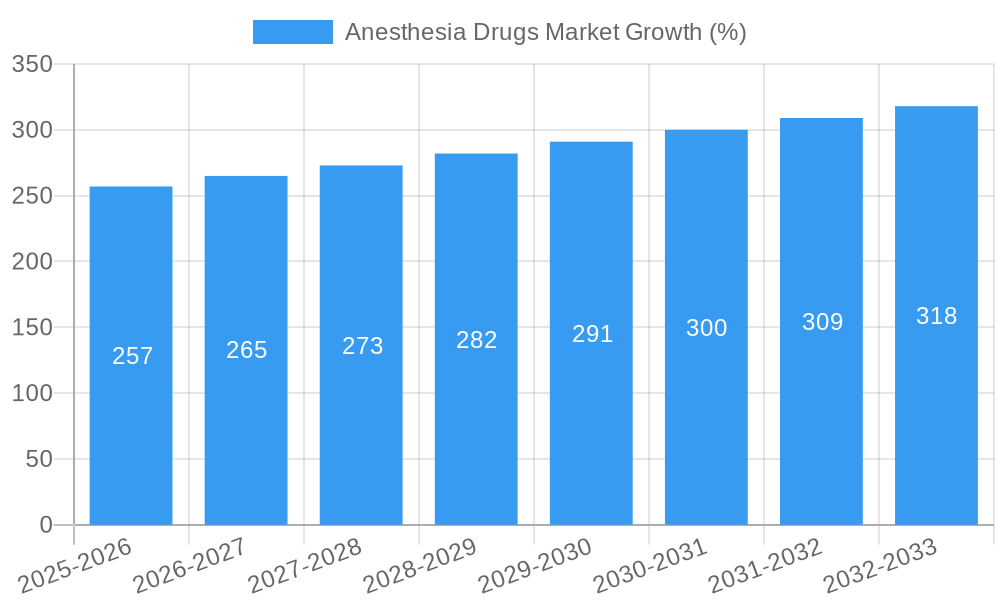
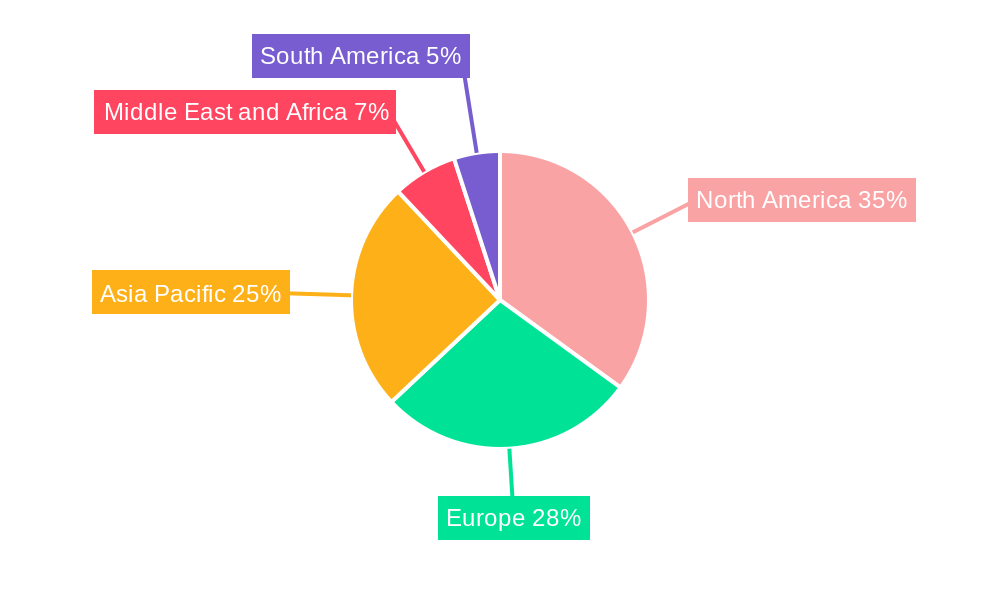
The global anesthesia drugs market, valued at $7.26 billion in 2025, is projected to experience steady growth, driven by a Compound Annual Growth Rate (CAGR) of 3.40% from 2025 to 2033. This growth is fueled by several key factors. Firstly, the increasing prevalence of surgical procedures across various specialties, including general, plastic, cosmetic, and dental surgery, significantly boosts demand. Advancements in minimally invasive surgical techniques further contribute to this trend, necessitating the use of effective and safe anesthesia. Secondly, the continuous development of new and improved anesthetic drugs with enhanced efficacy, reduced side effects, and targeted delivery systems is shaping market dynamics. The shift towards outpatient surgeries and a rising geriatric population also contribute to market expansion, as these segments require sophisticated anesthesia management. However, stringent regulatory approvals and potential safety concerns related to certain anesthetic agents pose challenges to market growth. Furthermore, the increasing cost of healthcare and the availability of generic alternatives could influence pricing strategies and market share within the various drug types and administration routes. The market is segmented by drug type (general and local anesthetics), route of administration (inhalation, injection, and others), and application (general, plastic, cosmetic, dental, and other surgeries). Geographical analysis reveals significant market presence across North America, Europe, and Asia Pacific, driven by robust healthcare infrastructure and high surgical procedure volumes in these regions.
Competition within the anesthesia drugs market is fierce, with major players including Novartis AG, Dr. Reddy's Laboratories, Apsen Pharmacare Holdings Limited, Teva Pharmaceutical Industries Limited, Eisai Inc., Fresenius SE & Co. KGaA, AbbVie Inc., B. Braun Melsungen AG, Abbott Laboratories Inc., Baxter International Inc., and Pfizer Inc. These companies are engaged in ongoing research and development, strategic partnerships, and mergers and acquisitions to maintain a competitive edge and expand their market share. Future market growth is expected to be shaped by technological innovations, evolving treatment guidelines, and the strategic actions of key players within the competitive landscape. The increasing focus on personalized medicine and the development of targeted anesthetic agents is also anticipated to influence market trends in the coming years.
This detailed report provides a comprehensive analysis of the Anesthesia Drugs market, offering invaluable insights for stakeholders across the pharmaceutical and healthcare industries. Covering the period from 2019 to 2033, with a focus on 2025, this report dissects market dynamics, competitive landscapes, and future growth projections.
Anesthesia Drugs Market Market Concentration & Innovation
This section analyzes the Anesthesia Drugs market's concentration, innovation drivers, regulatory landscape, product substitutes, end-user trends, and mergers & acquisitions (M&A) activities. The market exhibits a moderately concentrated structure, with key players such as Novartis AG, Pfizer Inc., and Abbott Laboratories Inc. holding significant market shares. However, the presence of numerous smaller players fosters competition and innovation.
- Market Share: The top 5 players collectively account for approximately xx% of the global market share in 2025. Precise figures are detailed within the full report.
- Innovation Drivers: The continuous development of safer and more effective anesthetic agents, combined with advancements in drug delivery systems (e.g., targeted drug delivery, minimally invasive techniques), are key innovation drivers.
- Regulatory Frameworks: Stringent regulatory approvals and safety standards significantly impact market entry and product lifecycle management.
- Product Substitutes: The availability of regional anesthesia techniques and alternative pain management strategies creates competitive pressures.
- End-User Trends: Growing surgical procedures across various specializations are fueling market expansion. Furthermore, increasing preference for outpatient surgeries influences the demand for faster-acting and safer anesthetic agents.
- M&A Activities: Consolidation in the industry continues, with several strategic acquisitions and partnerships observed in recent years. For example, while the exact value remains confidential, the acquisition of Akorn's ophthalmic products by Laboratoires Théa is indicative of the ongoing consolidation. The report includes a detailed analysis of M&A deal values and their impact on market dynamics.
Anesthesia Drugs Market Industry Trends & Insights
This section explores market growth drivers, technological disruptions, consumer preferences, and competitive dynamics. The Anesthesia Drugs market is experiencing robust growth, primarily driven by the rising prevalence of chronic diseases requiring surgical interventions, an aging global population, technological advancements, and increased healthcare expenditure.
The market is predicted to witness a Compound Annual Growth Rate (CAGR) of xx% during the forecast period (2025-2033). Market penetration of newer anesthetic agents is expected to increase significantly, especially those with improved safety profiles and reduced side effects. Technological disruptions, such as the introduction of novel drug delivery systems and personalized medicine approaches, are reshaping market dynamics. Consumer preference for less invasive procedures, quicker recovery times, and reduced postoperative complications also influence product development. Competitive dynamics are characterized by both price competition and innovation-led differentiation.
Dominant Markets & Segments in Anesthesia Drugs Market
This section identifies the leading regions, countries, and segments within the Anesthesia Drugs market. The report provides detailed analysis across drug types (General Anesthesia Drugs and Local Anesthesia Drugs), routes of administration (Inhalation, Injection, and Other Routes of Administration), and applications (General Surgery, Plastic Surgery, Cosmetic Surgery, Dental Surgery, and Other Applications).
- Leading Regions: North America and Europe currently hold dominant positions due to high healthcare expenditure and advanced medical infrastructure. However, the Asia-Pacific region is projected to experience substantial growth driven by rising disposable incomes and increasing healthcare investments.
- Dominant Segment by Drug Type: General Anesthesia drugs represent a larger market share due to their wide applications in various surgical procedures. However, Local Anesthesia drugs are also experiencing a growth surge given the rise in minimally invasive and outpatient surgical practices.
- Dominant Segment by Route of Administration: Injection currently dominates the market owing to its precision and efficacy.
- Dominant Segment by Application: General Surgery accounts for the largest market share, followed by Dental Surgery and Plastic/Cosmetic Surgery. The report comprehensively details the key drivers for each segment's dominance.
Key Drivers for Regional/Segment Dominance:
- North America & Europe: High healthcare expenditure, advanced medical infrastructure, strong regulatory frameworks, and high adoption rates of advanced technologies.
- Asia-Pacific: Rapidly increasing population, growing middle class, increasing healthcare investments, and government initiatives promoting healthcare infrastructure development.
- General Anesthesia Drugs: Wide range of applications across various surgical procedures.
- Injection Route: Precision, efficacy, and suitability for a wide range of surgical procedures.
- General Surgery: High volume of surgical procedures, growing incidence of chronic diseases necessitating surgical intervention.
Anesthesia Drugs Market Product Developments
Recent product innovations focus on developing anesthetic agents with faster onset, shorter recovery times, and reduced side effects. The integration of advanced drug delivery systems, such as targeted drug delivery, is enhancing efficacy and minimizing adverse events. These advancements are strategically positioned to meet the growing demands for safe and efficient anesthesia solutions, improving patient outcomes and streamlining surgical procedures. The market is witnessing a shift towards personalized anesthesia approaches, with products tailored to individual patient characteristics.
Report Scope & Segmentation Analysis
This report segments the Anesthesia Drugs market by drug type (General Anesthesia Drugs, Local Anesthesia Drugs), route of administration (Inhalation, Injection, Other Routes of Administration), and application (General Surgery, Plastic Surgery, Cosmetic Surgery, Dental Surgery, Other Applications). Each segment's market size, growth projections, and competitive landscape are thoroughly analyzed, providing a clear understanding of the market's structure and potential opportunities. The report provides detailed forecasts for market size, value, and growth for each segment through 2033.
Key Drivers of Anesthesia Drugs Market Growth
The Anesthesia Drugs market's growth is fueled by several factors: The rising prevalence of chronic diseases necessitating surgical interventions significantly boosts demand for anesthetic agents. An aging global population contributes to the increased need for surgical procedures. Technological advancements resulting in safer and more effective anesthetic agents further enhance market growth. Finally, increasing healthcare expenditure globally drives market expansion.
Challenges in the Anesthesia Drugs Market Sector
The Anesthesia Drugs market faces several challenges: Stringent regulatory approvals and safety standards can increase the time and cost associated with new product launches, creating a barrier to market entry. Supply chain disruptions can impact the availability and pricing of raw materials and finished products. Intense competition among established players and the emergence of new market entrants create pricing pressures and limit profit margins.
Emerging Opportunities in Anesthesia Drugs Market
Emerging opportunities include the development of novel anesthetic agents with improved efficacy and safety profiles, expanding into emerging markets with high unmet medical needs, and developing personalized anesthesia approaches tailored to individual patient characteristics. Technological advancements, such as advanced drug delivery systems and AI-driven diagnostic tools, present significant growth avenues.
Leading Players in the Anesthesia Drugs Market Market
- Novartis AG
- Dr Reddy's Laboratories
- Apsen Pharmacare Holdings Limited
- Teva Pharmaceutical Industries Limited
- Eisai Inc
- Fresenius SE & Co KGaA
- AbbVie Inc
- B Braun Melsungen AG
- Abbott Laboratories Inc
- Baxter International Inc
- Pfizer Inc
Key Developments in Anesthesia Drugs Market Industry
- January 2022: Laboratoires Théa SAS acquired seven branded ophthalmic products from Akorn Operating Company LLC, including Akten (lidocaine HCl ophthalmic gel), expanding its portfolio in the local anesthetic market.
- February 2022: Sedana Medical AB launched Sedaconda (isoflurane) in Germany, following European and national approvals in multiple countries. Further approvals are expected in Italy, Poland, Switzerland, and the United Kingdom.
Strategic Outlook for Anesthesia Drugs Market Market
The Anesthesia Drugs market presents significant growth potential driven by a confluence of factors: an increasing global surgical procedures volume, technological advancements leading to improved anesthetic agents, and substantial investments in healthcare infrastructure globally. The market is poised for considerable expansion, particularly in emerging economies. Companies focused on innovation and strategic partnerships will be best positioned to capitalize on the market's growth opportunities.
Anesthesia Drugs Market Segmentation
-
1. Drug Type
-
1.1. General Anesthesia Drugs
- 1.1.1. Propofol
- 1.1.2. Sevoflurane
- 1.1.3. Desflurane
- 1.1.4. Dexmedetomidine
- 1.1.5. Remifentanil
- 1.1.6. Midazolam
- 1.1.7. Other General Anesthesia Drugs
-
1.2. Local Anesthesia Drugs
- 1.2.1. Bupivacaine
- 1.2.2. Ropivacaine
- 1.2.3. Lidocaine
- 1.2.4. Chloroprocaine
- 1.2.5. Prilocaine
- 1.2.6. Benzocaine
- 1.2.7. Other Local Anesthesia Drugs
-
1.1. General Anesthesia Drugs
-
2. Route of Administration
- 2.1. Inhalation
- 2.2. Injection
- 2.3. Other Routes of Administration
-
3. Application
- 3.1. General Surgery
- 3.2. Plastic Surgery
- 3.3. Cosmetic Surgery
- 3.4. Dental Surgery
- 3.5. Other Applications
Anesthesia Drugs Market Segmentation By Geography
-
1. North America
- 1.1. United States
- 1.2. Canada
- 1.3. Mexico
-
2. Europe
- 2.1. Germany
- 2.2. United Kingdom
- 2.3. France
- 2.4. Italy
- 2.5. Spain
- 2.6. Rest of Europe
-
3. Asia Pacific
- 3.1. China
- 3.2. Japan
- 3.3. India
- 3.4. Australia
- 3.5. South Korea
- 3.6. Rest of Asia Pacific
-
4. Middle East and Africa
- 4.1. GCC
- 4.2. South Africa
- 4.3. Rest of Middle East and Africa
-
5. South America
- 5.1. Brazil
- 5.2. Argentina
- 5.3. Rest of South America
Anesthesia Drugs Market REPORT HIGHLIGHTS
| Aspects | Details |
|---|---|
| Study Period | 2019-2033 |
| Base Year | 2024 |
| Estimated Year | 2025 |
| Forecast Period | 2025-2033 |
| Historical Period | 2019-2024 |
| Growth Rate | CAGR of 3.40% from 2019-2033 |
| Segmentation |
|
Table of Contents
- 1. Introduction
- 1.1. Research Scope
- 1.2. Market Segmentation
- 1.3. Research Methodology
- 1.4. Definitions and Assumptions
- 2. Executive Summary
- 2.1. Introduction
- 3. Market Dynamics
- 3.1. Introduction
- 3.2. Market Drivers
- 3.2.1. Increasing Number of Surgeries; New Approvals of Anesthesia Drugs; Reduction in the Cost of Newly Invented Drugs
- 3.3. Market Restrains
- 3.3.1. Side Effects of General Anesthetics; Lack of Skilled Anesthetics
- 3.4. Market Trends
- 3.4.1. The Propofol Segment is Expected to Show the Fastest Growth in the General Anesthesia Drugs Segment
- 4. Market Factor Analysis
- 4.1. Porters Five Forces
- 4.2. Supply/Value Chain
- 4.3. PESTEL analysis
- 4.4. Market Entropy
- 4.5. Patent/Trademark Analysis
- 5. Global Anesthesia Drugs Market Analysis, Insights and Forecast, 2019-2031
- 5.1. Market Analysis, Insights and Forecast - by Drug Type
- 5.1.1. General Anesthesia Drugs
- 5.1.1.1. Propofol
- 5.1.1.2. Sevoflurane
- 5.1.1.3. Desflurane
- 5.1.1.4. Dexmedetomidine
- 5.1.1.5. Remifentanil
- 5.1.1.6. Midazolam
- 5.1.1.7. Other General Anesthesia Drugs
- 5.1.2. Local Anesthesia Drugs
- 5.1.2.1. Bupivacaine
- 5.1.2.2. Ropivacaine
- 5.1.2.3. Lidocaine
- 5.1.2.4. Chloroprocaine
- 5.1.2.5. Prilocaine
- 5.1.2.6. Benzocaine
- 5.1.2.7. Other Local Anesthesia Drugs
- 5.1.1. General Anesthesia Drugs
- 5.2. Market Analysis, Insights and Forecast - by Route of Administration
- 5.2.1. Inhalation
- 5.2.2. Injection
- 5.2.3. Other Routes of Administration
- 5.3. Market Analysis, Insights and Forecast - by Application
- 5.3.1. General Surgery
- 5.3.2. Plastic Surgery
- 5.3.3. Cosmetic Surgery
- 5.3.4. Dental Surgery
- 5.3.5. Other Applications
- 5.4. Market Analysis, Insights and Forecast - by Region
- 5.4.1. North America
- 5.4.2. Europe
- 5.4.3. Asia Pacific
- 5.4.4. Middle East and Africa
- 5.4.5. South America
- 5.1. Market Analysis, Insights and Forecast - by Drug Type
- 6. North America Anesthesia Drugs Market Analysis, Insights and Forecast, 2019-2031
- 6.1. Market Analysis, Insights and Forecast - by Drug Type
- 6.1.1. General Anesthesia Drugs
- 6.1.1.1. Propofol
- 6.1.1.2. Sevoflurane
- 6.1.1.3. Desflurane
- 6.1.1.4. Dexmedetomidine
- 6.1.1.5. Remifentanil
- 6.1.1.6. Midazolam
- 6.1.1.7. Other General Anesthesia Drugs
- 6.1.2. Local Anesthesia Drugs
- 6.1.2.1. Bupivacaine
- 6.1.2.2. Ropivacaine
- 6.1.2.3. Lidocaine
- 6.1.2.4. Chloroprocaine
- 6.1.2.5. Prilocaine
- 6.1.2.6. Benzocaine
- 6.1.2.7. Other Local Anesthesia Drugs
- 6.1.1. General Anesthesia Drugs
- 6.2. Market Analysis, Insights and Forecast - by Route of Administration
- 6.2.1. Inhalation
- 6.2.2. Injection
- 6.2.3. Other Routes of Administration
- 6.3. Market Analysis, Insights and Forecast - by Application
- 6.3.1. General Surgery
- 6.3.2. Plastic Surgery
- 6.3.3. Cosmetic Surgery
- 6.3.4. Dental Surgery
- 6.3.5. Other Applications
- 6.1. Market Analysis, Insights and Forecast - by Drug Type
- 7. Europe Anesthesia Drugs Market Analysis, Insights and Forecast, 2019-2031
- 7.1. Market Analysis, Insights and Forecast - by Drug Type
- 7.1.1. General Anesthesia Drugs
- 7.1.1.1. Propofol
- 7.1.1.2. Sevoflurane
- 7.1.1.3. Desflurane
- 7.1.1.4. Dexmedetomidine
- 7.1.1.5. Remifentanil
- 7.1.1.6. Midazolam
- 7.1.1.7. Other General Anesthesia Drugs
- 7.1.2. Local Anesthesia Drugs
- 7.1.2.1. Bupivacaine
- 7.1.2.2. Ropivacaine
- 7.1.2.3. Lidocaine
- 7.1.2.4. Chloroprocaine
- 7.1.2.5. Prilocaine
- 7.1.2.6. Benzocaine
- 7.1.2.7. Other Local Anesthesia Drugs
- 7.1.1. General Anesthesia Drugs
- 7.2. Market Analysis, Insights and Forecast - by Route of Administration
- 7.2.1. Inhalation
- 7.2.2. Injection
- 7.2.3. Other Routes of Administration
- 7.3. Market Analysis, Insights and Forecast - by Application
- 7.3.1. General Surgery
- 7.3.2. Plastic Surgery
- 7.3.3. Cosmetic Surgery
- 7.3.4. Dental Surgery
- 7.3.5. Other Applications
- 7.1. Market Analysis, Insights and Forecast - by Drug Type
- 8. Asia Pacific Anesthesia Drugs Market Analysis, Insights and Forecast, 2019-2031
- 8.1. Market Analysis, Insights and Forecast - by Drug Type
- 8.1.1. General Anesthesia Drugs
- 8.1.1.1. Propofol
- 8.1.1.2. Sevoflurane
- 8.1.1.3. Desflurane
- 8.1.1.4. Dexmedetomidine
- 8.1.1.5. Remifentanil
- 8.1.1.6. Midazolam
- 8.1.1.7. Other General Anesthesia Drugs
- 8.1.2. Local Anesthesia Drugs
- 8.1.2.1. Bupivacaine
- 8.1.2.2. Ropivacaine
- 8.1.2.3. Lidocaine
- 8.1.2.4. Chloroprocaine
- 8.1.2.5. Prilocaine
- 8.1.2.6. Benzocaine
- 8.1.2.7. Other Local Anesthesia Drugs
- 8.1.1. General Anesthesia Drugs
- 8.2. Market Analysis, Insights and Forecast - by Route of Administration
- 8.2.1. Inhalation
- 8.2.2. Injection
- 8.2.3. Other Routes of Administration
- 8.3. Market Analysis, Insights and Forecast - by Application
- 8.3.1. General Surgery
- 8.3.2. Plastic Surgery
- 8.3.3. Cosmetic Surgery
- 8.3.4. Dental Surgery
- 8.3.5. Other Applications
- 8.1. Market Analysis, Insights and Forecast - by Drug Type
- 9. Middle East and Africa Anesthesia Drugs Market Analysis, Insights and Forecast, 2019-2031
- 9.1. Market Analysis, Insights and Forecast - by Drug Type
- 9.1.1. General Anesthesia Drugs
- 9.1.1.1. Propofol
- 9.1.1.2. Sevoflurane
- 9.1.1.3. Desflurane
- 9.1.1.4. Dexmedetomidine
- 9.1.1.5. Remifentanil
- 9.1.1.6. Midazolam
- 9.1.1.7. Other General Anesthesia Drugs
- 9.1.2. Local Anesthesia Drugs
- 9.1.2.1. Bupivacaine
- 9.1.2.2. Ropivacaine
- 9.1.2.3. Lidocaine
- 9.1.2.4. Chloroprocaine
- 9.1.2.5. Prilocaine
- 9.1.2.6. Benzocaine
- 9.1.2.7. Other Local Anesthesia Drugs
- 9.1.1. General Anesthesia Drugs
- 9.2. Market Analysis, Insights and Forecast - by Route of Administration
- 9.2.1. Inhalation
- 9.2.2. Injection
- 9.2.3. Other Routes of Administration
- 9.3. Market Analysis, Insights and Forecast - by Application
- 9.3.1. General Surgery
- 9.3.2. Plastic Surgery
- 9.3.3. Cosmetic Surgery
- 9.3.4. Dental Surgery
- 9.3.5. Other Applications
- 9.1. Market Analysis, Insights and Forecast - by Drug Type
- 10. South America Anesthesia Drugs Market Analysis, Insights and Forecast, 2019-2031
- 10.1. Market Analysis, Insights and Forecast - by Drug Type
- 10.1.1. General Anesthesia Drugs
- 10.1.1.1. Propofol
- 10.1.1.2. Sevoflurane
- 10.1.1.3. Desflurane
- 10.1.1.4. Dexmedetomidine
- 10.1.1.5. Remifentanil
- 10.1.1.6. Midazolam
- 10.1.1.7. Other General Anesthesia Drugs
- 10.1.2. Local Anesthesia Drugs
- 10.1.2.1. Bupivacaine
- 10.1.2.2. Ropivacaine
- 10.1.2.3. Lidocaine
- 10.1.2.4. Chloroprocaine
- 10.1.2.5. Prilocaine
- 10.1.2.6. Benzocaine
- 10.1.2.7. Other Local Anesthesia Drugs
- 10.1.1. General Anesthesia Drugs
- 10.2. Market Analysis, Insights and Forecast - by Route of Administration
- 10.2.1. Inhalation
- 10.2.2. Injection
- 10.2.3. Other Routes of Administration
- 10.3. Market Analysis, Insights and Forecast - by Application
- 10.3.1. General Surgery
- 10.3.2. Plastic Surgery
- 10.3.3. Cosmetic Surgery
- 10.3.4. Dental Surgery
- 10.3.5. Other Applications
- 10.1. Market Analysis, Insights and Forecast - by Drug Type
- 11. North America Anesthesia Drugs Market Analysis, Insights and Forecast, 2019-2031
- 11.1. Market Analysis, Insights and Forecast - By Country/Sub-region
- 11.1.1 United States
- 11.1.2 Canada
- 11.1.3 Mexico
- 12. Europe Anesthesia Drugs Market Analysis, Insights and Forecast, 2019-2031
- 12.1. Market Analysis, Insights and Forecast - By Country/Sub-region
- 12.1.1 Germany
- 12.1.2 United Kingdom
- 12.1.3 France
- 12.1.4 Italy
- 12.1.5 Spain
- 12.1.6 Rest of Europe
- 13. Asia Pacific Anesthesia Drugs Market Analysis, Insights and Forecast, 2019-2031
- 13.1. Market Analysis, Insights and Forecast - By Country/Sub-region
- 13.1.1 China
- 13.1.2 Japan
- 13.1.3 India
- 13.1.4 Australia
- 13.1.5 South Korea
- 13.1.6 Rest of Asia Pacific
- 14. Middle East and Africa Anesthesia Drugs Market Analysis, Insights and Forecast, 2019-2031
- 14.1. Market Analysis, Insights and Forecast - By Country/Sub-region
- 14.1.1 GCC
- 14.1.2 South Africa
- 14.1.3 Rest of Middle East and Africa
- 15. South America Anesthesia Drugs Market Analysis, Insights and Forecast, 2019-2031
- 15.1. Market Analysis, Insights and Forecast - By Country/Sub-region
- 15.1.1 Brazil
- 15.1.2 Argentina
- 15.1.3 Rest of South America
- 16. Competitive Analysis
- 16.1. Global Market Share Analysis 2024
- 16.2. Company Profiles
- 16.2.1 Novartis AG
- 16.2.1.1. Overview
- 16.2.1.2. Products
- 16.2.1.3. SWOT Analysis
- 16.2.1.4. Recent Developments
- 16.2.1.5. Financials (Based on Availability)
- 16.2.2 Dr Reddy's Laboratories
- 16.2.2.1. Overview
- 16.2.2.2. Products
- 16.2.2.3. SWOT Analysis
- 16.2.2.4. Recent Developments
- 16.2.2.5. Financials (Based on Availability)
- 16.2.3 Apsen Pharmacare Holdings Limited
- 16.2.3.1. Overview
- 16.2.3.2. Products
- 16.2.3.3. SWOT Analysis
- 16.2.3.4. Recent Developments
- 16.2.3.5. Financials (Based on Availability)
- 16.2.4 Teva Pharmaceutical Industries Limited
- 16.2.4.1. Overview
- 16.2.4.2. Products
- 16.2.4.3. SWOT Analysis
- 16.2.4.4. Recent Developments
- 16.2.4.5. Financials (Based on Availability)
- 16.2.5 Eisai Inc
- 16.2.5.1. Overview
- 16.2.5.2. Products
- 16.2.5.3. SWOT Analysis
- 16.2.5.4. Recent Developments
- 16.2.5.5. Financials (Based on Availability)
- 16.2.6 Fresenius SE & Co KGaA
- 16.2.6.1. Overview
- 16.2.6.2. Products
- 16.2.6.3. SWOT Analysis
- 16.2.6.4. Recent Developments
- 16.2.6.5. Financials (Based on Availability)
- 16.2.7 AbbVie Inc
- 16.2.7.1. Overview
- 16.2.7.2. Products
- 16.2.7.3. SWOT Analysis
- 16.2.7.4. Recent Developments
- 16.2.7.5. Financials (Based on Availability)
- 16.2.8 B Braun Melsungen AG
- 16.2.8.1. Overview
- 16.2.8.2. Products
- 16.2.8.3. SWOT Analysis
- 16.2.8.4. Recent Developments
- 16.2.8.5. Financials (Based on Availability)
- 16.2.9 Abbott Laboratories Inc
- 16.2.9.1. Overview
- 16.2.9.2. Products
- 16.2.9.3. SWOT Analysis
- 16.2.9.4. Recent Developments
- 16.2.9.5. Financials (Based on Availability)
- 16.2.10 Baxter International Inc
- 16.2.10.1. Overview
- 16.2.10.2. Products
- 16.2.10.3. SWOT Analysis
- 16.2.10.4. Recent Developments
- 16.2.10.5. Financials (Based on Availability)
- 16.2.11 Pfizer Inc
- 16.2.11.1. Overview
- 16.2.11.2. Products
- 16.2.11.3. SWOT Analysis
- 16.2.11.4. Recent Developments
- 16.2.11.5. Financials (Based on Availability)
- 16.2.1 Novartis AG
List of Figures
- Figure 1: Global Anesthesia Drugs Market Revenue Breakdown (Million, %) by Region 2024 & 2032
- Figure 2: Global Anesthesia Drugs Market Volume Breakdown (K Unit, %) by Region 2024 & 2032
- Figure 3: North America Anesthesia Drugs Market Revenue (Million), by Country 2024 & 2032
- Figure 4: North America Anesthesia Drugs Market Volume (K Unit), by Country 2024 & 2032
- Figure 5: North America Anesthesia Drugs Market Revenue Share (%), by Country 2024 & 2032
- Figure 6: North America Anesthesia Drugs Market Volume Share (%), by Country 2024 & 2032
- Figure 7: Europe Anesthesia Drugs Market Revenue (Million), by Country 2024 & 2032
- Figure 8: Europe Anesthesia Drugs Market Volume (K Unit), by Country 2024 & 2032
- Figure 9: Europe Anesthesia Drugs Market Revenue Share (%), by Country 2024 & 2032
- Figure 10: Europe Anesthesia Drugs Market Volume Share (%), by Country 2024 & 2032
- Figure 11: Asia Pacific Anesthesia Drugs Market Revenue (Million), by Country 2024 & 2032
- Figure 12: Asia Pacific Anesthesia Drugs Market Volume (K Unit), by Country 2024 & 2032
- Figure 13: Asia Pacific Anesthesia Drugs Market Revenue Share (%), by Country 2024 & 2032
- Figure 14: Asia Pacific Anesthesia Drugs Market Volume Share (%), by Country 2024 & 2032
- Figure 15: Middle East and Africa Anesthesia Drugs Market Revenue (Million), by Country 2024 & 2032
- Figure 16: Middle East and Africa Anesthesia Drugs Market Volume (K Unit), by Country 2024 & 2032
- Figure 17: Middle East and Africa Anesthesia Drugs Market Revenue Share (%), by Country 2024 & 2032
- Figure 18: Middle East and Africa Anesthesia Drugs Market Volume Share (%), by Country 2024 & 2032
- Figure 19: South America Anesthesia Drugs Market Revenue (Million), by Country 2024 & 2032
- Figure 20: South America Anesthesia Drugs Market Volume (K Unit), by Country 2024 & 2032
- Figure 21: South America Anesthesia Drugs Market Revenue Share (%), by Country 2024 & 2032
- Figure 22: South America Anesthesia Drugs Market Volume Share (%), by Country 2024 & 2032
- Figure 23: North America Anesthesia Drugs Market Revenue (Million), by Drug Type 2024 & 2032
- Figure 24: North America Anesthesia Drugs Market Volume (K Unit), by Drug Type 2024 & 2032
- Figure 25: North America Anesthesia Drugs Market Revenue Share (%), by Drug Type 2024 & 2032
- Figure 26: North America Anesthesia Drugs Market Volume Share (%), by Drug Type 2024 & 2032
- Figure 27: North America Anesthesia Drugs Market Revenue (Million), by Route of Administration 2024 & 2032
- Figure 28: North America Anesthesia Drugs Market Volume (K Unit), by Route of Administration 2024 & 2032
- Figure 29: North America Anesthesia Drugs Market Revenue Share (%), by Route of Administration 2024 & 2032
- Figure 30: North America Anesthesia Drugs Market Volume Share (%), by Route of Administration 2024 & 2032
- Figure 31: North America Anesthesia Drugs Market Revenue (Million), by Application 2024 & 2032
- Figure 32: North America Anesthesia Drugs Market Volume (K Unit), by Application 2024 & 2032
- Figure 33: North America Anesthesia Drugs Market Revenue Share (%), by Application 2024 & 2032
- Figure 34: North America Anesthesia Drugs Market Volume Share (%), by Application 2024 & 2032
- Figure 35: North America Anesthesia Drugs Market Revenue (Million), by Country 2024 & 2032
- Figure 36: North America Anesthesia Drugs Market Volume (K Unit), by Country 2024 & 2032
- Figure 37: North America Anesthesia Drugs Market Revenue Share (%), by Country 2024 & 2032
- Figure 38: North America Anesthesia Drugs Market Volume Share (%), by Country 2024 & 2032
- Figure 39: Europe Anesthesia Drugs Market Revenue (Million), by Drug Type 2024 & 2032
- Figure 40: Europe Anesthesia Drugs Market Volume (K Unit), by Drug Type 2024 & 2032
- Figure 41: Europe Anesthesia Drugs Market Revenue Share (%), by Drug Type 2024 & 2032
- Figure 42: Europe Anesthesia Drugs Market Volume Share (%), by Drug Type 2024 & 2032
- Figure 43: Europe Anesthesia Drugs Market Revenue (Million), by Route of Administration 2024 & 2032
- Figure 44: Europe Anesthesia Drugs Market Volume (K Unit), by Route of Administration 2024 & 2032
- Figure 45: Europe Anesthesia Drugs Market Revenue Share (%), by Route of Administration 2024 & 2032
- Figure 46: Europe Anesthesia Drugs Market Volume Share (%), by Route of Administration 2024 & 2032
- Figure 47: Europe Anesthesia Drugs Market Revenue (Million), by Application 2024 & 2032
- Figure 48: Europe Anesthesia Drugs Market Volume (K Unit), by Application 2024 & 2032
- Figure 49: Europe Anesthesia Drugs Market Revenue Share (%), by Application 2024 & 2032
- Figure 50: Europe Anesthesia Drugs Market Volume Share (%), by Application 2024 & 2032
- Figure 51: Europe Anesthesia Drugs Market Revenue (Million), by Country 2024 & 2032
- Figure 52: Europe Anesthesia Drugs Market Volume (K Unit), by Country 2024 & 2032
- Figure 53: Europe Anesthesia Drugs Market Revenue Share (%), by Country 2024 & 2032
- Figure 54: Europe Anesthesia Drugs Market Volume Share (%), by Country 2024 & 2032
- Figure 55: Asia Pacific Anesthesia Drugs Market Revenue (Million), by Drug Type 2024 & 2032
- Figure 56: Asia Pacific Anesthesia Drugs Market Volume (K Unit), by Drug Type 2024 & 2032
- Figure 57: Asia Pacific Anesthesia Drugs Market Revenue Share (%), by Drug Type 2024 & 2032
- Figure 58: Asia Pacific Anesthesia Drugs Market Volume Share (%), by Drug Type 2024 & 2032
- Figure 59: Asia Pacific Anesthesia Drugs Market Revenue (Million), by Route of Administration 2024 & 2032
- Figure 60: Asia Pacific Anesthesia Drugs Market Volume (K Unit), by Route of Administration 2024 & 2032
- Figure 61: Asia Pacific Anesthesia Drugs Market Revenue Share (%), by Route of Administration 2024 & 2032
- Figure 62: Asia Pacific Anesthesia Drugs Market Volume Share (%), by Route of Administration 2024 & 2032
- Figure 63: Asia Pacific Anesthesia Drugs Market Revenue (Million), by Application 2024 & 2032
- Figure 64: Asia Pacific Anesthesia Drugs Market Volume (K Unit), by Application 2024 & 2032
- Figure 65: Asia Pacific Anesthesia Drugs Market Revenue Share (%), by Application 2024 & 2032
- Figure 66: Asia Pacific Anesthesia Drugs Market Volume Share (%), by Application 2024 & 2032
- Figure 67: Asia Pacific Anesthesia Drugs Market Revenue (Million), by Country 2024 & 2032
- Figure 68: Asia Pacific Anesthesia Drugs Market Volume (K Unit), by Country 2024 & 2032
- Figure 69: Asia Pacific Anesthesia Drugs Market Revenue Share (%), by Country 2024 & 2032
- Figure 70: Asia Pacific Anesthesia Drugs Market Volume Share (%), by Country 2024 & 2032
- Figure 71: Middle East and Africa Anesthesia Drugs Market Revenue (Million), by Drug Type 2024 & 2032
- Figure 72: Middle East and Africa Anesthesia Drugs Market Volume (K Unit), by Drug Type 2024 & 2032
- Figure 73: Middle East and Africa Anesthesia Drugs Market Revenue Share (%), by Drug Type 2024 & 2032
- Figure 74: Middle East and Africa Anesthesia Drugs Market Volume Share (%), by Drug Type 2024 & 2032
- Figure 75: Middle East and Africa Anesthesia Drugs Market Revenue (Million), by Route of Administration 2024 & 2032
- Figure 76: Middle East and Africa Anesthesia Drugs Market Volume (K Unit), by Route of Administration 2024 & 2032
- Figure 77: Middle East and Africa Anesthesia Drugs Market Revenue Share (%), by Route of Administration 2024 & 2032
- Figure 78: Middle East and Africa Anesthesia Drugs Market Volume Share (%), by Route of Administration 2024 & 2032
- Figure 79: Middle East and Africa Anesthesia Drugs Market Revenue (Million), by Application 2024 & 2032
- Figure 80: Middle East and Africa Anesthesia Drugs Market Volume (K Unit), by Application 2024 & 2032
- Figure 81: Middle East and Africa Anesthesia Drugs Market Revenue Share (%), by Application 2024 & 2032
- Figure 82: Middle East and Africa Anesthesia Drugs Market Volume Share (%), by Application 2024 & 2032
- Figure 83: Middle East and Africa Anesthesia Drugs Market Revenue (Million), by Country 2024 & 2032
- Figure 84: Middle East and Africa Anesthesia Drugs Market Volume (K Unit), by Country 2024 & 2032
- Figure 85: Middle East and Africa Anesthesia Drugs Market Revenue Share (%), by Country 2024 & 2032
- Figure 86: Middle East and Africa Anesthesia Drugs Market Volume Share (%), by Country 2024 & 2032
- Figure 87: South America Anesthesia Drugs Market Revenue (Million), by Drug Type 2024 & 2032
- Figure 88: South America Anesthesia Drugs Market Volume (K Unit), by Drug Type 2024 & 2032
- Figure 89: South America Anesthesia Drugs Market Revenue Share (%), by Drug Type 2024 & 2032
- Figure 90: South America Anesthesia Drugs Market Volume Share (%), by Drug Type 2024 & 2032
- Figure 91: South America Anesthesia Drugs Market Revenue (Million), by Route of Administration 2024 & 2032
- Figure 92: South America Anesthesia Drugs Market Volume (K Unit), by Route of Administration 2024 & 2032
- Figure 93: South America Anesthesia Drugs Market Revenue Share (%), by Route of Administration 2024 & 2032
- Figure 94: South America Anesthesia Drugs Market Volume Share (%), by Route of Administration 2024 & 2032
- Figure 95: South America Anesthesia Drugs Market Revenue (Million), by Application 2024 & 2032
- Figure 96: South America Anesthesia Drugs Market Volume (K Unit), by Application 2024 & 2032
- Figure 97: South America Anesthesia Drugs Market Revenue Share (%), by Application 2024 & 2032
- Figure 98: South America Anesthesia Drugs Market Volume Share (%), by Application 2024 & 2032
- Figure 99: South America Anesthesia Drugs Market Revenue (Million), by Country 2024 & 2032
- Figure 100: South America Anesthesia Drugs Market Volume (K Unit), by Country 2024 & 2032
- Figure 101: South America Anesthesia Drugs Market Revenue Share (%), by Country 2024 & 2032
- Figure 102: South America Anesthesia Drugs Market Volume Share (%), by Country 2024 & 2032
List of Tables
- Table 1: Global Anesthesia Drugs Market Revenue Million Forecast, by Region 2019 & 2032
- Table 2: Global Anesthesia Drugs Market Volume K Unit Forecast, by Region 2019 & 2032
- Table 3: Global Anesthesia Drugs Market Revenue Million Forecast, by Drug Type 2019 & 2032
- Table 4: Global Anesthesia Drugs Market Volume K Unit Forecast, by Drug Type 2019 & 2032
- Table 5: Global Anesthesia Drugs Market Revenue Million Forecast, by Route of Administration 2019 & 2032
- Table 6: Global Anesthesia Drugs Market Volume K Unit Forecast, by Route of Administration 2019 & 2032
- Table 7: Global Anesthesia Drugs Market Revenue Million Forecast, by Application 2019 & 2032
- Table 8: Global Anesthesia Drugs Market Volume K Unit Forecast, by Application 2019 & 2032
- Table 9: Global Anesthesia Drugs Market Revenue Million Forecast, by Region 2019 & 2032
- Table 10: Global Anesthesia Drugs Market Volume K Unit Forecast, by Region 2019 & 2032
- Table 11: Global Anesthesia Drugs Market Revenue Million Forecast, by Country 2019 & 2032
- Table 12: Global Anesthesia Drugs Market Volume K Unit Forecast, by Country 2019 & 2032
- Table 13: United States Anesthesia Drugs Market Revenue (Million) Forecast, by Application 2019 & 2032
- Table 14: United States Anesthesia Drugs Market Volume (K Unit) Forecast, by Application 2019 & 2032
- Table 15: Canada Anesthesia Drugs Market Revenue (Million) Forecast, by Application 2019 & 2032
- Table 16: Canada Anesthesia Drugs Market Volume (K Unit) Forecast, by Application 2019 & 2032
- Table 17: Mexico Anesthesia Drugs Market Revenue (Million) Forecast, by Application 2019 & 2032
- Table 18: Mexico Anesthesia Drugs Market Volume (K Unit) Forecast, by Application 2019 & 2032
- Table 19: Global Anesthesia Drugs Market Revenue Million Forecast, by Country 2019 & 2032
- Table 20: Global Anesthesia Drugs Market Volume K Unit Forecast, by Country 2019 & 2032
- Table 21: Germany Anesthesia Drugs Market Revenue (Million) Forecast, by Application 2019 & 2032
- Table 22: Germany Anesthesia Drugs Market Volume (K Unit) Forecast, by Application 2019 & 2032
- Table 23: United Kingdom Anesthesia Drugs Market Revenue (Million) Forecast, by Application 2019 & 2032
- Table 24: United Kingdom Anesthesia Drugs Market Volume (K Unit) Forecast, by Application 2019 & 2032
- Table 25: France Anesthesia Drugs Market Revenue (Million) Forecast, by Application 2019 & 2032
- Table 26: France Anesthesia Drugs Market Volume (K Unit) Forecast, by Application 2019 & 2032
- Table 27: Italy Anesthesia Drugs Market Revenue (Million) Forecast, by Application 2019 & 2032
- Table 28: Italy Anesthesia Drugs Market Volume (K Unit) Forecast, by Application 2019 & 2032
- Table 29: Spain Anesthesia Drugs Market Revenue (Million) Forecast, by Application 2019 & 2032
- Table 30: Spain Anesthesia Drugs Market Volume (K Unit) Forecast, by Application 2019 & 2032
- Table 31: Rest of Europe Anesthesia Drugs Market Revenue (Million) Forecast, by Application 2019 & 2032
- Table 32: Rest of Europe Anesthesia Drugs Market Volume (K Unit) Forecast, by Application 2019 & 2032
- Table 33: Global Anesthesia Drugs Market Revenue Million Forecast, by Country 2019 & 2032
- Table 34: Global Anesthesia Drugs Market Volume K Unit Forecast, by Country 2019 & 2032
- Table 35: China Anesthesia Drugs Market Revenue (Million) Forecast, by Application 2019 & 2032
- Table 36: China Anesthesia Drugs Market Volume (K Unit) Forecast, by Application 2019 & 2032
- Table 37: Japan Anesthesia Drugs Market Revenue (Million) Forecast, by Application 2019 & 2032
- Table 38: Japan Anesthesia Drugs Market Volume (K Unit) Forecast, by Application 2019 & 2032
- Table 39: India Anesthesia Drugs Market Revenue (Million) Forecast, by Application 2019 & 2032
- Table 40: India Anesthesia Drugs Market Volume (K Unit) Forecast, by Application 2019 & 2032
- Table 41: Australia Anesthesia Drugs Market Revenue (Million) Forecast, by Application 2019 & 2032
- Table 42: Australia Anesthesia Drugs Market Volume (K Unit) Forecast, by Application 2019 & 2032
- Table 43: South Korea Anesthesia Drugs Market Revenue (Million) Forecast, by Application 2019 & 2032
- Table 44: South Korea Anesthesia Drugs Market Volume (K Unit) Forecast, by Application 2019 & 2032
- Table 45: Rest of Asia Pacific Anesthesia Drugs Market Revenue (Million) Forecast, by Application 2019 & 2032
- Table 46: Rest of Asia Pacific Anesthesia Drugs Market Volume (K Unit) Forecast, by Application 2019 & 2032
- Table 47: Global Anesthesia Drugs Market Revenue Million Forecast, by Country 2019 & 2032
- Table 48: Global Anesthesia Drugs Market Volume K Unit Forecast, by Country 2019 & 2032
- Table 49: GCC Anesthesia Drugs Market Revenue (Million) Forecast, by Application 2019 & 2032
- Table 50: GCC Anesthesia Drugs Market Volume (K Unit) Forecast, by Application 2019 & 2032
- Table 51: South Africa Anesthesia Drugs Market Revenue (Million) Forecast, by Application 2019 & 2032
- Table 52: South Africa Anesthesia Drugs Market Volume (K Unit) Forecast, by Application 2019 & 2032
- Table 53: Rest of Middle East and Africa Anesthesia Drugs Market Revenue (Million) Forecast, by Application 2019 & 2032
- Table 54: Rest of Middle East and Africa Anesthesia Drugs Market Volume (K Unit) Forecast, by Application 2019 & 2032
- Table 55: Global Anesthesia Drugs Market Revenue Million Forecast, by Country 2019 & 2032
- Table 56: Global Anesthesia Drugs Market Volume K Unit Forecast, by Country 2019 & 2032
- Table 57: Brazil Anesthesia Drugs Market Revenue (Million) Forecast, by Application 2019 & 2032
- Table 58: Brazil Anesthesia Drugs Market Volume (K Unit) Forecast, by Application 2019 & 2032
- Table 59: Argentina Anesthesia Drugs Market Revenue (Million) Forecast, by Application 2019 & 2032
- Table 60: Argentina Anesthesia Drugs Market Volume (K Unit) Forecast, by Application 2019 & 2032
- Table 61: Rest of South America Anesthesia Drugs Market Revenue (Million) Forecast, by Application 2019 & 2032
- Table 62: Rest of South America Anesthesia Drugs Market Volume (K Unit) Forecast, by Application 2019 & 2032
- Table 63: Global Anesthesia Drugs Market Revenue Million Forecast, by Drug Type 2019 & 2032
- Table 64: Global Anesthesia Drugs Market Volume K Unit Forecast, by Drug Type 2019 & 2032
- Table 65: Global Anesthesia Drugs Market Revenue Million Forecast, by Route of Administration 2019 & 2032
- Table 66: Global Anesthesia Drugs Market Volume K Unit Forecast, by Route of Administration 2019 & 2032
- Table 67: Global Anesthesia Drugs Market Revenue Million Forecast, by Application 2019 & 2032
- Table 68: Global Anesthesia Drugs Market Volume K Unit Forecast, by Application 2019 & 2032
- Table 69: Global Anesthesia Drugs Market Revenue Million Forecast, by Country 2019 & 2032
- Table 70: Global Anesthesia Drugs Market Volume K Unit Forecast, by Country 2019 & 2032
- Table 71: United States Anesthesia Drugs Market Revenue (Million) Forecast, by Application 2019 & 2032
- Table 72: United States Anesthesia Drugs Market Volume (K Unit) Forecast, by Application 2019 & 2032
- Table 73: Canada Anesthesia Drugs Market Revenue (Million) Forecast, by Application 2019 & 2032
- Table 74: Canada Anesthesia Drugs Market Volume (K Unit) Forecast, by Application 2019 & 2032
- Table 75: Mexico Anesthesia Drugs Market Revenue (Million) Forecast, by Application 2019 & 2032
- Table 76: Mexico Anesthesia Drugs Market Volume (K Unit) Forecast, by Application 2019 & 2032
- Table 77: Global Anesthesia Drugs Market Revenue Million Forecast, by Drug Type 2019 & 2032
- Table 78: Global Anesthesia Drugs Market Volume K Unit Forecast, by Drug Type 2019 & 2032
- Table 79: Global Anesthesia Drugs Market Revenue Million Forecast, by Route of Administration 2019 & 2032
- Table 80: Global Anesthesia Drugs Market Volume K Unit Forecast, by Route of Administration 2019 & 2032
- Table 81: Global Anesthesia Drugs Market Revenue Million Forecast, by Application 2019 & 2032
- Table 82: Global Anesthesia Drugs Market Volume K Unit Forecast, by Application 2019 & 2032
- Table 83: Global Anesthesia Drugs Market Revenue Million Forecast, by Country 2019 & 2032
- Table 84: Global Anesthesia Drugs Market Volume K Unit Forecast, by Country 2019 & 2032
- Table 85: Germany Anesthesia Drugs Market Revenue (Million) Forecast, by Application 2019 & 2032
- Table 86: Germany Anesthesia Drugs Market Volume (K Unit) Forecast, by Application 2019 & 2032
- Table 87: United Kingdom Anesthesia Drugs Market Revenue (Million) Forecast, by Application 2019 & 2032
- Table 88: United Kingdom Anesthesia Drugs Market Volume (K Unit) Forecast, by Application 2019 & 2032
- Table 89: France Anesthesia Drugs Market Revenue (Million) Forecast, by Application 2019 & 2032
- Table 90: France Anesthesia Drugs Market Volume (K Unit) Forecast, by Application 2019 & 2032
- Table 91: Italy Anesthesia Drugs Market Revenue (Million) Forecast, by Application 2019 & 2032
- Table 92: Italy Anesthesia Drugs Market Volume (K Unit) Forecast, by Application 2019 & 2032
- Table 93: Spain Anesthesia Drugs Market Revenue (Million) Forecast, by Application 2019 & 2032
- Table 94: Spain Anesthesia Drugs Market Volume (K Unit) Forecast, by Application 2019 & 2032
- Table 95: Rest of Europe Anesthesia Drugs Market Revenue (Million) Forecast, by Application 2019 & 2032
- Table 96: Rest of Europe Anesthesia Drugs Market Volume (K Unit) Forecast, by Application 2019 & 2032
- Table 97: Global Anesthesia Drugs Market Revenue Million Forecast, by Drug Type 2019 & 2032
- Table 98: Global Anesthesia Drugs Market Volume K Unit Forecast, by Drug Type 2019 & 2032
- Table 99: Global Anesthesia Drugs Market Revenue Million Forecast, by Route of Administration 2019 & 2032
- Table 100: Global Anesthesia Drugs Market Volume K Unit Forecast, by Route of Administration 2019 & 2032
- Table 101: Global Anesthesia Drugs Market Revenue Million Forecast, by Application 2019 & 2032
- Table 102: Global Anesthesia Drugs Market Volume K Unit Forecast, by Application 2019 & 2032
- Table 103: Global Anesthesia Drugs Market Revenue Million Forecast, by Country 2019 & 2032
- Table 104: Global Anesthesia Drugs Market Volume K Unit Forecast, by Country 2019 & 2032
- Table 105: China Anesthesia Drugs Market Revenue (Million) Forecast, by Application 2019 & 2032
- Table 106: China Anesthesia Drugs Market Volume (K Unit) Forecast, by Application 2019 & 2032
- Table 107: Japan Anesthesia Drugs Market Revenue (Million) Forecast, by Application 2019 & 2032
- Table 108: Japan Anesthesia Drugs Market Volume (K Unit) Forecast, by Application 2019 & 2032
- Table 109: India Anesthesia Drugs Market Revenue (Million) Forecast, by Application 2019 & 2032
- Table 110: India Anesthesia Drugs Market Volume (K Unit) Forecast, by Application 2019 & 2032
- Table 111: Australia Anesthesia Drugs Market Revenue (Million) Forecast, by Application 2019 & 2032
- Table 112: Australia Anesthesia Drugs Market Volume (K Unit) Forecast, by Application 2019 & 2032
- Table 113: South Korea Anesthesia Drugs Market Revenue (Million) Forecast, by Application 2019 & 2032
- Table 114: South Korea Anesthesia Drugs Market Volume (K Unit) Forecast, by Application 2019 & 2032
- Table 115: Rest of Asia Pacific Anesthesia Drugs Market Revenue (Million) Forecast, by Application 2019 & 2032
- Table 116: Rest of Asia Pacific Anesthesia Drugs Market Volume (K Unit) Forecast, by Application 2019 & 2032
- Table 117: Global Anesthesia Drugs Market Revenue Million Forecast, by Drug Type 2019 & 2032
- Table 118: Global Anesthesia Drugs Market Volume K Unit Forecast, by Drug Type 2019 & 2032
- Table 119: Global Anesthesia Drugs Market Revenue Million Forecast, by Route of Administration 2019 & 2032
- Table 120: Global Anesthesia Drugs Market Volume K Unit Forecast, by Route of Administration 2019 & 2032
- Table 121: Global Anesthesia Drugs Market Revenue Million Forecast, by Application 2019 & 2032
- Table 122: Global Anesthesia Drugs Market Volume K Unit Forecast, by Application 2019 & 2032
- Table 123: Global Anesthesia Drugs Market Revenue Million Forecast, by Country 2019 & 2032
- Table 124: Global Anesthesia Drugs Market Volume K Unit Forecast, by Country 2019 & 2032
- Table 125: GCC Anesthesia Drugs Market Revenue (Million) Forecast, by Application 2019 & 2032
- Table 126: GCC Anesthesia Drugs Market Volume (K Unit) Forecast, by Application 2019 & 2032
- Table 127: South Africa Anesthesia Drugs Market Revenue (Million) Forecast, by Application 2019 & 2032
- Table 128: South Africa Anesthesia Drugs Market Volume (K Unit) Forecast, by Application 2019 & 2032
- Table 129: Rest of Middle East and Africa Anesthesia Drugs Market Revenue (Million) Forecast, by Application 2019 & 2032
- Table 130: Rest of Middle East and Africa Anesthesia Drugs Market Volume (K Unit) Forecast, by Application 2019 & 2032
- Table 131: Global Anesthesia Drugs Market Revenue Million Forecast, by Drug Type 2019 & 2032
- Table 132: Global Anesthesia Drugs Market Volume K Unit Forecast, by Drug Type 2019 & 2032
- Table 133: Global Anesthesia Drugs Market Revenue Million Forecast, by Route of Administration 2019 & 2032
- Table 134: Global Anesthesia Drugs Market Volume K Unit Forecast, by Route of Administration 2019 & 2032
- Table 135: Global Anesthesia Drugs Market Revenue Million Forecast, by Application 2019 & 2032
- Table 136: Global Anesthesia Drugs Market Volume K Unit Forecast, by Application 2019 & 2032
- Table 137: Global Anesthesia Drugs Market Revenue Million Forecast, by Country 2019 & 2032
- Table 138: Global Anesthesia Drugs Market Volume K Unit Forecast, by Country 2019 & 2032
- Table 139: Brazil Anesthesia Drugs Market Revenue (Million) Forecast, by Application 2019 & 2032
- Table 140: Brazil Anesthesia Drugs Market Volume (K Unit) Forecast, by Application 2019 & 2032
- Table 141: Argentina Anesthesia Drugs Market Revenue (Million) Forecast, by Application 2019 & 2032
- Table 142: Argentina Anesthesia Drugs Market Volume (K Unit) Forecast, by Application 2019 & 2032
- Table 143: Rest of South America Anesthesia Drugs Market Revenue (Million) Forecast, by Application 2019 & 2032
- Table 144: Rest of South America Anesthesia Drugs Market Volume (K Unit) Forecast, by Application 2019 & 2032
Frequently Asked Questions
1. What is the projected Compound Annual Growth Rate (CAGR) of the Anesthesia Drugs Market?
The projected CAGR is approximately 3.40%.
2. Which companies are prominent players in the Anesthesia Drugs Market?
Key companies in the market include Novartis AG, Dr Reddy's Laboratories, Apsen Pharmacare Holdings Limited, Teva Pharmaceutical Industries Limited, Eisai Inc , Fresenius SE & Co KGaA, AbbVie Inc, B Braun Melsungen AG, Abbott Laboratories Inc, Baxter International Inc, Pfizer Inc.
3. What are the main segments of the Anesthesia Drugs Market?
The market segments include Drug Type, Route of Administration, Application.
4. Can you provide details about the market size?
The market size is estimated to be USD 7.26 Million as of 2022.
5. What are some drivers contributing to market growth?
Increasing Number of Surgeries; New Approvals of Anesthesia Drugs; Reduction in the Cost of Newly Invented Drugs.
6. What are the notable trends driving market growth?
The Propofol Segment is Expected to Show the Fastest Growth in the General Anesthesia Drugs Segment.
7. Are there any restraints impacting market growth?
Side Effects of General Anesthetics; Lack of Skilled Anesthetics.
8. Can you provide examples of recent developments in the market?
In January 2022, Laboratoires Théa SAS (Théa) entered an agreement to purchase seven branded ophthalmic products from Akorn Operating Company LLC. The strategic move will enable Théa to add Akorn branded products to its portfolio, including Akten (lidocaine HCl ophthalmic gel), a local anesthetic indicated for ocular surface anesthesia during ophthalmologic procedures.
9. What pricing options are available for accessing the report?
Pricing options include single-user, multi-user, and enterprise licenses priced at USD 4750, USD 5250, and USD 8750 respectively.
10. Is the market size provided in terms of value or volume?
The market size is provided in terms of value, measured in Million and volume, measured in K Unit.
11. Are there any specific market keywords associated with the report?
Yes, the market keyword associated with the report is "Anesthesia Drugs Market," which aids in identifying and referencing the specific market segment covered.
12. How do I determine which pricing option suits my needs best?
The pricing options vary based on user requirements and access needs. Individual users may opt for single-user licenses, while businesses requiring broader access may choose multi-user or enterprise licenses for cost-effective access to the report.
13. Are there any additional resources or data provided in the Anesthesia Drugs Market report?
While the report offers comprehensive insights, it's advisable to review the specific contents or supplementary materials provided to ascertain if additional resources or data are available.
14. How can I stay updated on further developments or reports in the Anesthesia Drugs Market?
To stay informed about further developments, trends, and reports in the Anesthesia Drugs Market, consider subscribing to industry newsletters, following relevant companies and organizations, or regularly checking reputable industry news sources and publications.
Methodology
Step 1 - Identification of Relevant Samples Size from Population Database


Step 2 - Approaches for Defining Global Market Size (Value, Volume* & Price*)

Note*: In applicable scenarios
Step 3 - Data Sources
Primary Research
- Web Analytics
- Survey Reports
- Research Institute
- Latest Research Reports
- Opinion Leaders
Secondary Research
- Annual Reports
- White Paper
- Latest Press Release
- Industry Association
- Paid Database
- Investor Presentations

Step 4 - Data Triangulation
Involves using different sources of information in order to increase the validity of a study
These sources are likely to be stakeholders in a program - participants, other researchers, program staff, other community members, and so on.
Then we put all data in single framework & apply various statistical tools to find out the dynamic on the market.
During the analysis stage, feedback from the stakeholder groups would be compared to determine areas of agreement as well as areas of divergence


