
Key Insights
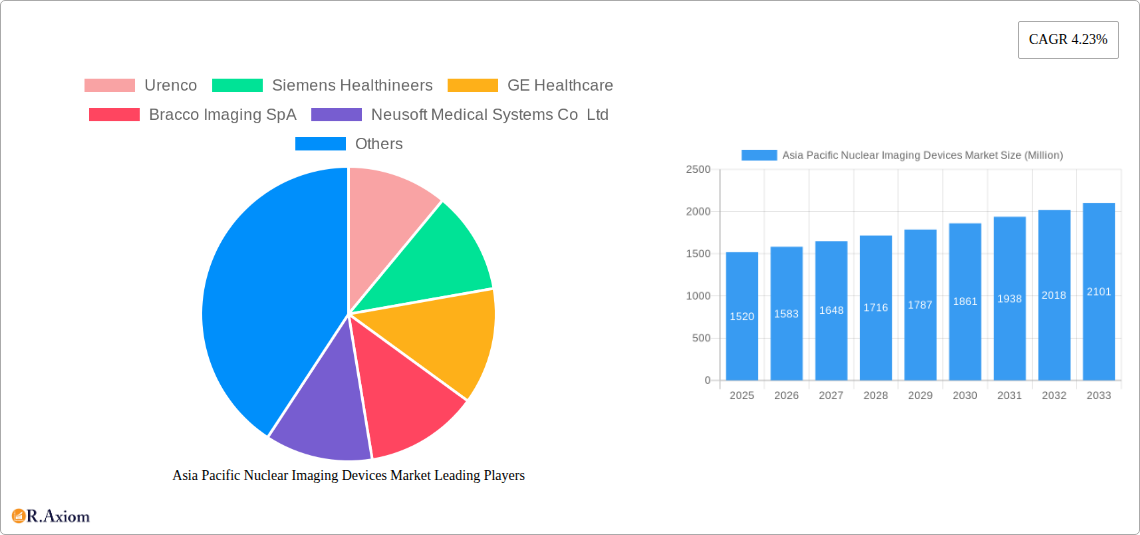
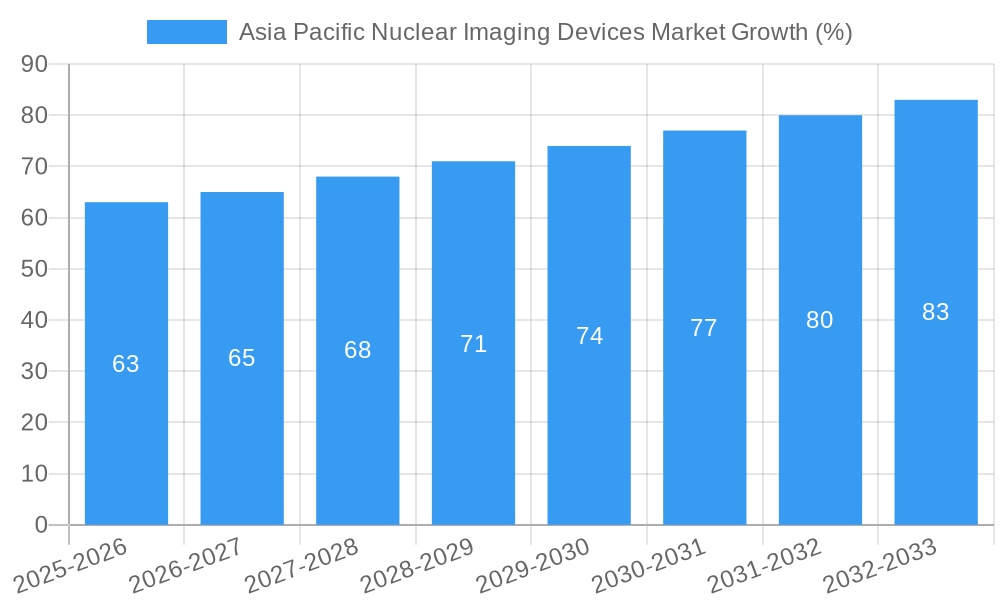
The Asia Pacific Nuclear Imaging Devices market is experiencing robust growth, projected to reach a market size of $1.52 billion in 2025 and maintain a Compound Annual Growth Rate (CAGR) of 4.23% from 2025 to 2033. This expansion is fueled by several key drivers. Rising prevalence of chronic diseases like cancer and cardiovascular ailments necessitates advanced diagnostic tools, significantly boosting demand for nuclear imaging devices. Technological advancements, such as the development of more precise and efficient SPECT and PET radioisotopes and improved imaging equipment, enhance diagnostic capabilities and contribute to market growth. Government initiatives promoting healthcare infrastructure development and increased investments in medical research and technology across the region, particularly in countries like China, Japan, and India, further accelerate market expansion. The increasing adoption of minimally invasive procedures and the rising preference for outpatient diagnostic services also positively impact market growth. However, high costs associated with purchasing and maintaining nuclear imaging devices, stringent regulatory frameworks surrounding the use of radioisotopes, and the need for skilled professionals to operate and interpret images present challenges to market growth. The segment breakdown reveals significant contributions from both SPECT and PET radioisotopes, with Technetium-99m (Tc-99m) and Fluorine-18 (F-18) being the leading radioisotopes. The application segment is predominantly driven by the demand for SPECT and PET applications in oncology and cardiology. Major players like Siemens Healthineers, GE Healthcare, and Philips are driving innovation and expanding their market presence through strategic partnerships and technological advancements.
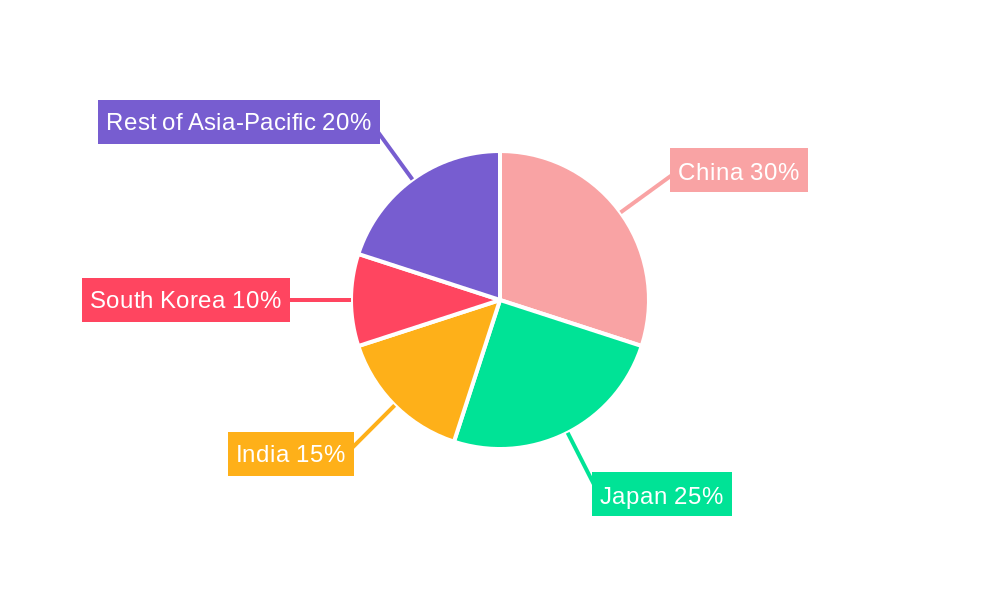
Within the Asia-Pacific region, China, Japan, India, and South Korea are leading the market, driven by their expanding healthcare infrastructure, growing populations, and increasing healthcare expenditure. The "Rest of Asia-Pacific" segment also demonstrates substantial potential for future growth due to rising awareness of advanced diagnostic techniques and improving healthcare access in emerging economies. The market is characterized by a competitive landscape with both established multinational corporations and regional players vying for market share. This competitive dynamic is likely to drive further innovation and potentially lead to more cost-effective solutions, which could help address some of the current market restraints. Looking forward, continued technological innovation, coupled with supportive government policies and increasing healthcare spending, will be critical in propelling the sustained growth of the Asia Pacific Nuclear Imaging Devices market.
Asia Pacific Nuclear Imaging Devices Market: A Comprehensive Report (2019-2033)
This detailed report provides a comprehensive analysis of the Asia Pacific Nuclear Imaging Devices market, offering invaluable insights for stakeholders across the industry. The study period spans from 2019 to 2033, with 2025 serving as the base and estimated year. The forecast period covers 2025-2033, and the historical period encompasses 2019-2024. The report segments the market by product type (Equipment and Radioisotope), radioisotope type (SPECT and PET, further categorized by specific isotopes like Technetium-99m (Tc-99m), Thallium-201 (Tl-201), Gallium (Ga-67), Iodine (I-123), Fluorine-18 (F-18), and Rubidium-82 (Rb-82)), and application (SPECT Applications, PET Applications, and Other Applications). Key market players analyzed include Urenco, Siemens Healthineers, GE Healthcare, Bracco Imaging SpA, Neusoft Medical Systems Co Ltd, Koninklijke Philips NV, Canon Medical Systems Corporation, Taiyo Nippon Sanso, and MiE GmbH.
Asia Pacific Nuclear Imaging Devices Market Concentration & Innovation
The Asia Pacific nuclear imaging devices market exhibits a moderately concentrated landscape, with a few major players holding significant market share. The estimated market share of the top five companies in 2025 is approximately xx%. Innovation is a key driver, fueled by advancements in detector technology, radiopharmaceutical development, and image processing algorithms. Regulatory frameworks, including those governing radiation safety and medical device approvals, play a crucial role in shaping market dynamics. While limited, product substitutes exist, such as advanced MRI and ultrasound techniques, but nuclear imaging remains essential for certain diagnostic applications. End-user trends indicate a growing preference for high-resolution, faster imaging systems with improved patient comfort. M&A activity within the sector has been moderate in recent years, with deal values averaging approximately xx Million in the period 2020-2024. Future M&A activity is expected to focus on expanding geographic reach and strengthening product portfolios.
- Market Concentration: Top 5 players hold approximately xx% market share in 2025.
- Innovation Drivers: Advanced detector technology, radiopharmaceutical development, improved image processing.
- Regulatory Landscape: Stringent regulations governing radiation safety and medical device approvals.
- Product Substitutes: Limited substitutes, primarily advanced MRI and Ultrasound.
- End-User Trends: Preference for high-resolution, faster imaging, and improved patient comfort.
- M&A Activity (2020-2024): Average deal value approximately xx Million.
Asia Pacific Nuclear Imaging Devices Market Industry Trends & Insights
The Asia Pacific nuclear imaging devices market is projected to experience robust growth, with a Compound Annual Growth Rate (CAGR) of xx% during the forecast period (2025-2033). This growth is primarily driven by the increasing prevalence of chronic diseases, rising healthcare expenditure, and expanding diagnostic imaging infrastructure across the region. Technological advancements, such as the development of hybrid imaging systems combining PET and CT or SPECT and CT, are further boosting market penetration. Consumer preferences are shifting towards more sophisticated, user-friendly systems with enhanced image quality and reduced radiation exposure. Intense competition among established players and new entrants is driving innovation and price optimization, while government initiatives promoting healthcare infrastructure development are creating a favorable market environment. Market penetration of PET imaging is growing at a faster rate compared to SPECT, driven by its superior diagnostic capabilities.
Dominant Markets & Segments in Asia Pacific Nuclear Imaging Devices Market
The Equipment segment dominates the market, accounting for approximately xx% of the total revenue in 2025. Within radioisotopes, Technetium-99m (Tc-99m) holds the largest share due to its widespread use in SPECT imaging. Japan and China are the leading national markets, driven by factors such as:
- Japan: High healthcare expenditure, advanced healthcare infrastructure, and a large aging population.
- China: Rapid economic growth, increasing healthcare awareness, and government investments in healthcare infrastructure.
- Other key growth drivers: Increasing prevalence of cardiovascular diseases, cancer, and neurological disorders; growing demand for early diagnosis and personalized medicine.
The SPECT Applications segment currently holds the largest share of the application market, largely owing to the established use of Tc-99m. However, the PET Applications segment is witnessing the fastest growth rate due to increased adoption of advanced imaging techniques and growing awareness of its diagnostic capabilities.
Asia Pacific Nuclear Imaging Devices Market Product Developments
Recent product innovations focus on enhancing image resolution, reducing scan times, and improving patient comfort. This includes the development of hybrid imaging systems, advanced detector technologies, and improved radiopharmaceuticals. These innovations offer competitive advantages by providing more accurate and efficient diagnoses, leading to better patient outcomes and improved market competitiveness. The ongoing trend is toward miniaturization and improved portability of equipment, making imaging more accessible in remote locations.
Report Scope & Segmentation Analysis
This report comprehensively analyzes the Asia Pacific nuclear imaging devices market across various segments. The Product Type segment is divided into Equipment and Radioisotopes. The Radioisotope segment is further categorized into SPECT Radioisotopes (including Tc-99m, Tl-201, Ga-67, I-123, and others) and PET Radioisotopes (including F-18, Rb-82, and others). The Application segment includes SPECT Applications, PET Applications, and Other Applications. Each segment's growth projection, market size (in Million), and competitive dynamics are thoroughly examined, providing a granular understanding of market trends and opportunities.
Key Drivers of Asia Pacific Nuclear Imaging Devices Market Growth
Several factors are propelling the growth of the Asia Pacific nuclear imaging devices market. These include:
- Technological advancements: Development of hybrid imaging systems and advanced detector technologies, enabling faster, higher-resolution images.
- Rising healthcare expenditure: Increased investments in healthcare infrastructure and diagnostic facilities across the region.
- Favorable government policies: Initiatives promoting the adoption of advanced medical technologies.
- Increasing prevalence of chronic diseases: Growing incidence of cancer, cardiovascular diseases, and neurological disorders driving demand for early diagnosis.
Challenges in the Asia Pacific Nuclear Imaging Devices Market Sector
The Asia Pacific nuclear imaging devices market faces certain challenges, including:
- Regulatory hurdles: Strict regulatory requirements for medical device approval and radiation safety can slow down market entry and increase costs.
- Supply chain complexities: Ensuring a consistent supply of radioisotopes can be challenging due to logistical and production constraints.
- High cost of equipment and procedures: The high initial investment and ongoing operational costs can limit accessibility for some healthcare facilities.
- Competition: The presence of established players and new entrants creates a competitive environment.
Emerging Opportunities in Asia Pacific Nuclear Imaging Devices Market
Several opportunities exist for growth in this market:
- Expansion into underserved markets: Increasing healthcare access in rural and remote areas offers substantial growth potential.
- Development of new radiopharmaceuticals: Targeted therapies and advanced imaging agents can revolutionize diagnostics.
- Adoption of telemedicine and remote diagnostics: Integrating nuclear imaging with remote monitoring solutions.
Leading Players in the Asia Pacific Nuclear Imaging Devices Market Market
- Urenco
- Siemens Healthineers
- GE Healthcare
- Bracco Imaging SpA
- Neusoft Medical Systems Co Ltd
- Koninklijke Philips NV
- Canon Medical Systems Corporation
- Taiyo Nippon Sanso
- MiE GmbH
Key Developments in Asia Pacific Nuclear Imaging Devices Market Industry
- 2022 Q4: Siemens Healthineers launched a new PET/CT scanner with advanced image reconstruction capabilities.
- 2023 Q1: GE Healthcare announced a strategic partnership to expand its radioisotope supply chain in Asia.
- 2024 Q2: A major merger between two regional players resulted in expanded market reach and product portfolio. (Further details need to be added based on actual events).
Strategic Outlook for Asia Pacific Nuclear Imaging Devices Market Market
The Asia Pacific nuclear imaging devices market presents substantial growth potential, driven by technological advancements, increasing healthcare spending, and rising prevalence of chronic diseases. Strategic investments in R&D, expansion into underserved markets, and partnerships to enhance supply chain efficiency will be crucial for companies to capitalize on this growth. The market is expected to see further consolidation through M&A activity, leading to a more concentrated landscape dominated by global players with robust product portfolios and strong distribution networks. The focus will remain on developing advanced imaging modalities that are faster, more accurate, and offer improved patient outcomes.
Asia Pacific Nuclear Imaging Devices Market Segmentation
-
1. Product Type
- 1.1. Equipment
-
1.2. Radioisotope
-
1.2.1. SPECT Radioisotopes
- 1.2.1.1. Technetium-99m (TC-99m)
- 1.2.1.2. Thallium-201 (TI-201)
- 1.2.1.3. Gallium(Ga-67)
- 1.2.1.4. Iodine (I-123)
- 1.2.1.5. Other SPECT Radioisotopes
-
1.2.2. PET Radioisotopes
- 1.2.2.1. Fluorine-18 (F-18)
- 1.2.2.2. Rubidium-82 (RB-82)
- 1.2.2.3. Other PET Radioisotopes
-
1.2.1. SPECT Radioisotopes
-
2. Application
-
2.1. SPECT Applications
- 2.1.1. Cardiology
- 2.1.2. Neurology
- 2.1.3. Thyroid
- 2.1.4. Other SPECT Applications
-
2.2. PET Applications
- 2.2.1. Oncology
- 2.2.2. Other PET Applications
-
2.1. SPECT Applications
-
3. Geography
-
3.1. Asia-Pacific
- 3.1.1. China
- 3.1.2. Japan
- 3.1.3. India
- 3.1.4. Australia
- 3.1.5. South Korea
- 3.1.6. Rest of Asia-Pacific
-
3.1. Asia-Pacific
Asia Pacific Nuclear Imaging Devices Market Segmentation By Geography
-
1. Asia Pacific
- 1.1. China
- 1.2. Japan
- 1.3. India
- 1.4. Australia
- 1.5. South Korea
- 1.6. Rest of Asia Pacific
Asia Pacific Nuclear Imaging Devices Market REPORT HIGHLIGHTS
| Aspects | Details |
|---|---|
| Study Period | 2019-2033 |
| Base Year | 2024 |
| Estimated Year | 2025 |
| Forecast Period | 2025-2033 |
| Historical Period | 2019-2024 |
| Growth Rate | CAGR of 4.23% from 2019-2033 |
| Segmentation |
|
Table of Contents
- 1. Introduction
- 1.1. Research Scope
- 1.2. Market Segmentation
- 1.3. Research Methodology
- 1.4. Definitions and Assumptions
- 2. Executive Summary
- 2.1. Introduction
- 3. Market Dynamics
- 3.1. Introduction
- 3.2. Market Drivers
- 3.2.1. ; Rise in Prevalence of Cancer and Cardiac Disorders; Increase in Technological Advancements
- 3.3. Market Restrains
- 3.3.1. ; Limited Reimbursement and Stringent Regulatory Procedures
- 3.4. Market Trends
- 3.4.1. Cardiology is Expected to Hold the Highest Market Share in the Region
- 4. Market Factor Analysis
- 4.1. Porters Five Forces
- 4.2. Supply/Value Chain
- 4.3. PESTEL analysis
- 4.4. Market Entropy
- 4.5. Patent/Trademark Analysis
- 5. Asia Pacific Nuclear Imaging Devices Market Analysis, Insights and Forecast, 2019-2031
- 5.1. Market Analysis, Insights and Forecast - by Product Type
- 5.1.1. Equipment
- 5.1.2. Radioisotope
- 5.1.2.1. SPECT Radioisotopes
- 5.1.2.1.1. Technetium-99m (TC-99m)
- 5.1.2.1.2. Thallium-201 (TI-201)
- 5.1.2.1.3. Gallium(Ga-67)
- 5.1.2.1.4. Iodine (I-123)
- 5.1.2.1.5. Other SPECT Radioisotopes
- 5.1.2.2. PET Radioisotopes
- 5.1.2.2.1. Fluorine-18 (F-18)
- 5.1.2.2.2. Rubidium-82 (RB-82)
- 5.1.2.2.3. Other PET Radioisotopes
- 5.1.2.1. SPECT Radioisotopes
- 5.2. Market Analysis, Insights and Forecast - by Application
- 5.2.1. SPECT Applications
- 5.2.1.1. Cardiology
- 5.2.1.2. Neurology
- 5.2.1.3. Thyroid
- 5.2.1.4. Other SPECT Applications
- 5.2.2. PET Applications
- 5.2.2.1. Oncology
- 5.2.2.2. Other PET Applications
- 5.2.1. SPECT Applications
- 5.3. Market Analysis, Insights and Forecast - by Geography
- 5.3.1. Asia-Pacific
- 5.3.1.1. China
- 5.3.1.2. Japan
- 5.3.1.3. India
- 5.3.1.4. Australia
- 5.3.1.5. South Korea
- 5.3.1.6. Rest of Asia-Pacific
- 5.3.1. Asia-Pacific
- 5.4. Market Analysis, Insights and Forecast - by Region
- 5.4.1. Asia Pacific
- 5.1. Market Analysis, Insights and Forecast - by Product Type
- 6. China Asia Pacific Nuclear Imaging Devices Market Analysis, Insights and Forecast, 2019-2031
- 7. Japan Asia Pacific Nuclear Imaging Devices Market Analysis, Insights and Forecast, 2019-2031
- 8. India Asia Pacific Nuclear Imaging Devices Market Analysis, Insights and Forecast, 2019-2031
- 9. South Korea Asia Pacific Nuclear Imaging Devices Market Analysis, Insights and Forecast, 2019-2031
- 10. Taiwan Asia Pacific Nuclear Imaging Devices Market Analysis, Insights and Forecast, 2019-2031
- 11. Australia Asia Pacific Nuclear Imaging Devices Market Analysis, Insights and Forecast, 2019-2031
- 12. Rest of Asia-Pacific Asia Pacific Nuclear Imaging Devices Market Analysis, Insights and Forecast, 2019-2031
- 13. Competitive Analysis
- 13.1. Market Share Analysis 2024
- 13.2. Company Profiles
- 13.2.1 Urenco
- 13.2.1.1. Overview
- 13.2.1.2. Products
- 13.2.1.3. SWOT Analysis
- 13.2.1.4. Recent Developments
- 13.2.1.5. Financials (Based on Availability)
- 13.2.2 Siemens Healthineers
- 13.2.2.1. Overview
- 13.2.2.2. Products
- 13.2.2.3. SWOT Analysis
- 13.2.2.4. Recent Developments
- 13.2.2.5. Financials (Based on Availability)
- 13.2.3 GE Healthcare
- 13.2.3.1. Overview
- 13.2.3.2. Products
- 13.2.3.3. SWOT Analysis
- 13.2.3.4. Recent Developments
- 13.2.3.5. Financials (Based on Availability)
- 13.2.4 Bracco Imaging SpA
- 13.2.4.1. Overview
- 13.2.4.2. Products
- 13.2.4.3. SWOT Analysis
- 13.2.4.4. Recent Developments
- 13.2.4.5. Financials (Based on Availability)
- 13.2.5 Neusoft Medical Systems Co Ltd
- 13.2.5.1. Overview
- 13.2.5.2. Products
- 13.2.5.3. SWOT Analysis
- 13.2.5.4. Recent Developments
- 13.2.5.5. Financials (Based on Availability)
- 13.2.6 Koninklijke Philips NV
- 13.2.6.1. Overview
- 13.2.6.2. Products
- 13.2.6.3. SWOT Analysis
- 13.2.6.4. Recent Developments
- 13.2.6.5. Financials (Based on Availability)
- 13.2.7 Canon Medical Systems Corporation
- 13.2.7.1. Overview
- 13.2.7.2. Products
- 13.2.7.3. SWOT Analysis
- 13.2.7.4. Recent Developments
- 13.2.7.5. Financials (Based on Availability)
- 13.2.8 Taiyo Nippon Sanso
- 13.2.8.1. Overview
- 13.2.8.2. Products
- 13.2.8.3. SWOT Analysis
- 13.2.8.4. Recent Developments
- 13.2.8.5. Financials (Based on Availability)
- 13.2.9 MiE GmbH
- 13.2.9.1. Overview
- 13.2.9.2. Products
- 13.2.9.3. SWOT Analysis
- 13.2.9.4. Recent Developments
- 13.2.9.5. Financials (Based on Availability)
- 13.2.1 Urenco
List of Figures
- Figure 1: Asia Pacific Nuclear Imaging Devices Market Revenue Breakdown (Million, %) by Product 2024 & 2032
- Figure 2: Asia Pacific Nuclear Imaging Devices Market Share (%) by Company 2024
List of Tables
- Table 1: Asia Pacific Nuclear Imaging Devices Market Revenue Million Forecast, by Region 2019 & 2032
- Table 2: Asia Pacific Nuclear Imaging Devices Market Volume K Unit Forecast, by Region 2019 & 2032
- Table 3: Asia Pacific Nuclear Imaging Devices Market Revenue Million Forecast, by Product Type 2019 & 2032
- Table 4: Asia Pacific Nuclear Imaging Devices Market Volume K Unit Forecast, by Product Type 2019 & 2032
- Table 5: Asia Pacific Nuclear Imaging Devices Market Revenue Million Forecast, by Application 2019 & 2032
- Table 6: Asia Pacific Nuclear Imaging Devices Market Volume K Unit Forecast, by Application 2019 & 2032
- Table 7: Asia Pacific Nuclear Imaging Devices Market Revenue Million Forecast, by Geography 2019 & 2032
- Table 8: Asia Pacific Nuclear Imaging Devices Market Volume K Unit Forecast, by Geography 2019 & 2032
- Table 9: Asia Pacific Nuclear Imaging Devices Market Revenue Million Forecast, by Region 2019 & 2032
- Table 10: Asia Pacific Nuclear Imaging Devices Market Volume K Unit Forecast, by Region 2019 & 2032
- Table 11: Asia Pacific Nuclear Imaging Devices Market Revenue Million Forecast, by Country 2019 & 2032
- Table 12: Asia Pacific Nuclear Imaging Devices Market Volume K Unit Forecast, by Country 2019 & 2032
- Table 13: China Asia Pacific Nuclear Imaging Devices Market Revenue (Million) Forecast, by Application 2019 & 2032
- Table 14: China Asia Pacific Nuclear Imaging Devices Market Volume (K Unit) Forecast, by Application 2019 & 2032
- Table 15: Japan Asia Pacific Nuclear Imaging Devices Market Revenue (Million) Forecast, by Application 2019 & 2032
- Table 16: Japan Asia Pacific Nuclear Imaging Devices Market Volume (K Unit) Forecast, by Application 2019 & 2032
- Table 17: India Asia Pacific Nuclear Imaging Devices Market Revenue (Million) Forecast, by Application 2019 & 2032
- Table 18: India Asia Pacific Nuclear Imaging Devices Market Volume (K Unit) Forecast, by Application 2019 & 2032
- Table 19: South Korea Asia Pacific Nuclear Imaging Devices Market Revenue (Million) Forecast, by Application 2019 & 2032
- Table 20: South Korea Asia Pacific Nuclear Imaging Devices Market Volume (K Unit) Forecast, by Application 2019 & 2032
- Table 21: Taiwan Asia Pacific Nuclear Imaging Devices Market Revenue (Million) Forecast, by Application 2019 & 2032
- Table 22: Taiwan Asia Pacific Nuclear Imaging Devices Market Volume (K Unit) Forecast, by Application 2019 & 2032
- Table 23: Australia Asia Pacific Nuclear Imaging Devices Market Revenue (Million) Forecast, by Application 2019 & 2032
- Table 24: Australia Asia Pacific Nuclear Imaging Devices Market Volume (K Unit) Forecast, by Application 2019 & 2032
- Table 25: Rest of Asia-Pacific Asia Pacific Nuclear Imaging Devices Market Revenue (Million) Forecast, by Application 2019 & 2032
- Table 26: Rest of Asia-Pacific Asia Pacific Nuclear Imaging Devices Market Volume (K Unit) Forecast, by Application 2019 & 2032
- Table 27: Asia Pacific Nuclear Imaging Devices Market Revenue Million Forecast, by Product Type 2019 & 2032
- Table 28: Asia Pacific Nuclear Imaging Devices Market Volume K Unit Forecast, by Product Type 2019 & 2032
- Table 29: Asia Pacific Nuclear Imaging Devices Market Revenue Million Forecast, by Application 2019 & 2032
- Table 30: Asia Pacific Nuclear Imaging Devices Market Volume K Unit Forecast, by Application 2019 & 2032
- Table 31: Asia Pacific Nuclear Imaging Devices Market Revenue Million Forecast, by Geography 2019 & 2032
- Table 32: Asia Pacific Nuclear Imaging Devices Market Volume K Unit Forecast, by Geography 2019 & 2032
- Table 33: Asia Pacific Nuclear Imaging Devices Market Revenue Million Forecast, by Country 2019 & 2032
- Table 34: Asia Pacific Nuclear Imaging Devices Market Volume K Unit Forecast, by Country 2019 & 2032
- Table 35: China Asia Pacific Nuclear Imaging Devices Market Revenue (Million) Forecast, by Application 2019 & 2032
- Table 36: China Asia Pacific Nuclear Imaging Devices Market Volume (K Unit) Forecast, by Application 2019 & 2032
- Table 37: Japan Asia Pacific Nuclear Imaging Devices Market Revenue (Million) Forecast, by Application 2019 & 2032
- Table 38: Japan Asia Pacific Nuclear Imaging Devices Market Volume (K Unit) Forecast, by Application 2019 & 2032
- Table 39: India Asia Pacific Nuclear Imaging Devices Market Revenue (Million) Forecast, by Application 2019 & 2032
- Table 40: India Asia Pacific Nuclear Imaging Devices Market Volume (K Unit) Forecast, by Application 2019 & 2032
- Table 41: Australia Asia Pacific Nuclear Imaging Devices Market Revenue (Million) Forecast, by Application 2019 & 2032
- Table 42: Australia Asia Pacific Nuclear Imaging Devices Market Volume (K Unit) Forecast, by Application 2019 & 2032
- Table 43: South Korea Asia Pacific Nuclear Imaging Devices Market Revenue (Million) Forecast, by Application 2019 & 2032
- Table 44: South Korea Asia Pacific Nuclear Imaging Devices Market Volume (K Unit) Forecast, by Application 2019 & 2032
- Table 45: Rest of Asia Pacific Asia Pacific Nuclear Imaging Devices Market Revenue (Million) Forecast, by Application 2019 & 2032
- Table 46: Rest of Asia Pacific Asia Pacific Nuclear Imaging Devices Market Volume (K Unit) Forecast, by Application 2019 & 2032
Frequently Asked Questions
1. What is the projected Compound Annual Growth Rate (CAGR) of the Asia Pacific Nuclear Imaging Devices Market?
The projected CAGR is approximately 4.23%.
2. Which companies are prominent players in the Asia Pacific Nuclear Imaging Devices Market?
Key companies in the market include Urenco, Siemens Healthineers, GE Healthcare, Bracco Imaging SpA, Neusoft Medical Systems Co Ltd, Koninklijke Philips NV, Canon Medical Systems Corporation, Taiyo Nippon Sanso, MiE GmbH.
3. What are the main segments of the Asia Pacific Nuclear Imaging Devices Market?
The market segments include Product Type, Application, Geography.
4. Can you provide details about the market size?
The market size is estimated to be USD 1.52 Million as of 2022.
5. What are some drivers contributing to market growth?
; Rise in Prevalence of Cancer and Cardiac Disorders; Increase in Technological Advancements.
6. What are the notable trends driving market growth?
Cardiology is Expected to Hold the Highest Market Share in the Region.
7. Are there any restraints impacting market growth?
; Limited Reimbursement and Stringent Regulatory Procedures.
8. Can you provide examples of recent developments in the market?
N/A
9. What pricing options are available for accessing the report?
Pricing options include single-user, multi-user, and enterprise licenses priced at USD 4750, USD 5250, and USD 8750 respectively.
10. Is the market size provided in terms of value or volume?
The market size is provided in terms of value, measured in Million and volume, measured in K Unit.
11. Are there any specific market keywords associated with the report?
Yes, the market keyword associated with the report is "Asia Pacific Nuclear Imaging Devices Market," which aids in identifying and referencing the specific market segment covered.
12. How do I determine which pricing option suits my needs best?
The pricing options vary based on user requirements and access needs. Individual users may opt for single-user licenses, while businesses requiring broader access may choose multi-user or enterprise licenses for cost-effective access to the report.
13. Are there any additional resources or data provided in the Asia Pacific Nuclear Imaging Devices Market report?
While the report offers comprehensive insights, it's advisable to review the specific contents or supplementary materials provided to ascertain if additional resources or data are available.
14. How can I stay updated on further developments or reports in the Asia Pacific Nuclear Imaging Devices Market?
To stay informed about further developments, trends, and reports in the Asia Pacific Nuclear Imaging Devices Market, consider subscribing to industry newsletters, following relevant companies and organizations, or regularly checking reputable industry news sources and publications.
Methodology
Step 1 - Identification of Relevant Samples Size from Population Database


Step 2 - Approaches for Defining Global Market Size (Value, Volume* & Price*)

Note*: In applicable scenarios
Step 3 - Data Sources
Primary Research
- Web Analytics
- Survey Reports
- Research Institute
- Latest Research Reports
- Opinion Leaders
Secondary Research
- Annual Reports
- White Paper
- Latest Press Release
- Industry Association
- Paid Database
- Investor Presentations

Step 4 - Data Triangulation
Involves using different sources of information in order to increase the validity of a study
These sources are likely to be stakeholders in a program - participants, other researchers, program staff, other community members, and so on.
Then we put all data in single framework & apply various statistical tools to find out the dynamic on the market.
During the analysis stage, feedback from the stakeholder groups would be compared to determine areas of agreement as well as areas of divergence


