
Key Insights
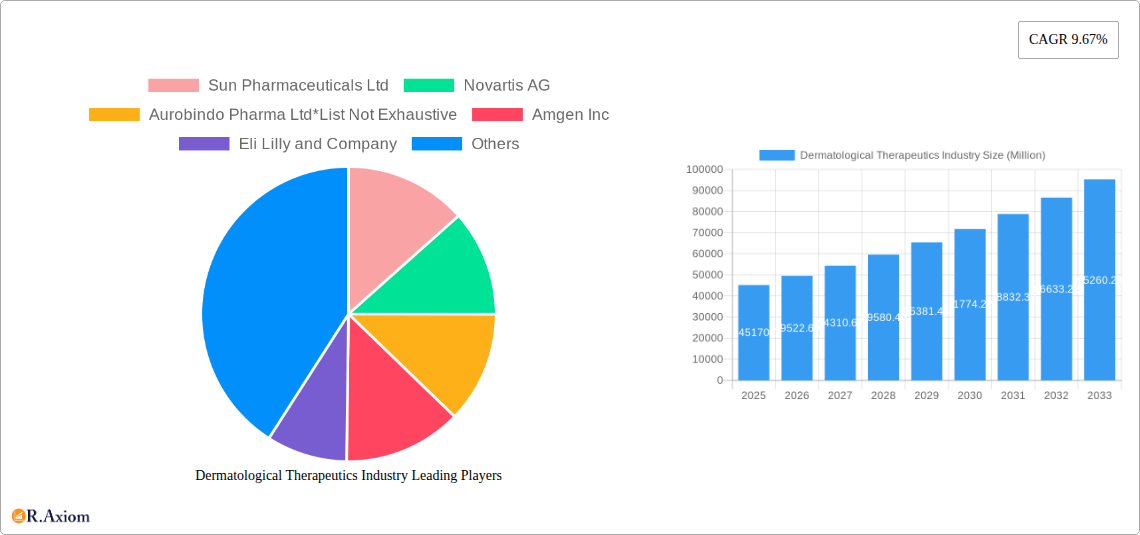
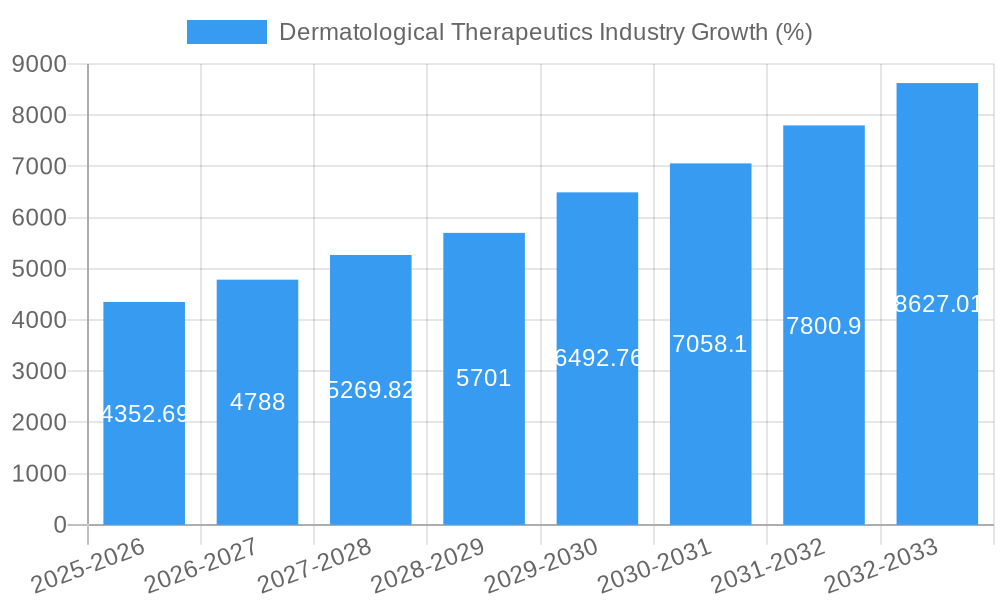
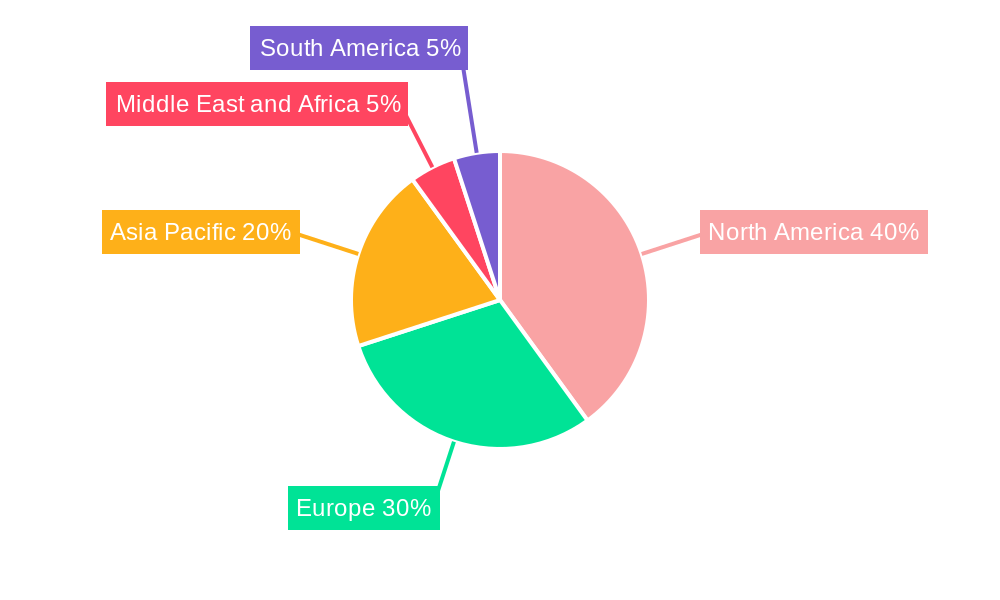
The dermatological therapeutics market, valued at $45.17 billion in 2025, is projected to experience robust growth, exhibiting a Compound Annual Growth Rate (CAGR) of 9.67% from 2025 to 2033. This expansion is driven by several key factors. The rising prevalence of skin diseases like atopic dermatitis, psoriasis, and acne, coupled with an aging global population increasingly susceptible to skin conditions, fuels market demand. Furthermore, advancements in drug development, leading to more effective and targeted therapies, including biologics and topical treatments, contribute significantly to market growth. Increased healthcare expenditure and rising awareness about skin health among consumers further bolster the market's trajectory. The market segmentation reveals significant opportunities across various applications (Alopecia, Herpes, Psoriasis, Rosacea, Atopic Dermatitis) and drug classes (Anti-infectives, Corticosteroids, Anti-acne, Calcineurin Inhibitors, Retinoids). North America currently holds a substantial market share, driven by high healthcare spending and advanced medical infrastructure, but the Asia-Pacific region is poised for significant growth due to its expanding population and rising disposable incomes. Competitive landscape analysis reveals a multitude of established pharmaceutical giants like Johnson & Johnson, Novartis, and AbbVie, alongside emerging players like Aclaris Therapeutics, vying for market dominance through research and development, strategic partnerships, and expansion into lucrative geographical regions.
The market's growth is not without challenges. High research and development costs associated with developing novel dermatological therapies can present a barrier to entry for smaller companies. Furthermore, stringent regulatory approvals and potential side effects associated with certain treatments could restrain market growth to some extent. However, the overall market outlook remains optimistic, fuelled by continuous innovation, technological advancements, and the unmet medical needs of a growing patient population globally. The market's future trajectory is likely shaped by the continued emergence of innovative treatments, personalized medicine approaches, and an increasing focus on preventative skincare solutions. The successful navigation of regulatory hurdles and cost-effectiveness of new therapies will play a crucial role in shaping the market’s future.
Dermatological Therapeutics Industry: A Comprehensive Market Report (2019-2033)
This detailed report provides a comprehensive analysis of the Dermatological Therapeutics industry, covering market size, segmentation, competitive landscape, growth drivers, and future outlook. The study period spans from 2019 to 2033, with 2025 serving as the base and estimated year. The forecast period is 2025-2033, and the historical period is 2019-2024. This report is crucial for industry stakeholders, investors, and researchers seeking actionable insights into this dynamic market. The total market size is projected to reach xx Million by 2033.
Dermatological Therapeutics Industry Market Concentration & Innovation
The dermatological therapeutics market exhibits a moderately concentrated landscape, with several multinational pharmaceutical companies holding significant market share. Key players like Johnson & Johnson, Abbvie Inc (Allergan PLC), and Novartis AG dominate the market, driven by strong R&D pipelines and extensive global distribution networks. Sun Pharmaceuticals Ltd, Aurobindo Pharma Ltd, Amgen Inc, Eli Lilly and Company, Galderma SA, Almirall SA, Bausch Health Companies Inc, LEO Pharma AS, Aclaris Therapeutics Inc, Bristol-Myers Squibb Company, GlaxoSmithKline PLC, and Pfizer Inc also contribute substantially. Market share data for 2024 indicates Johnson & Johnson holding approximately xx% market share, followed by Abbvie Inc (Allergan PLC) at xx%, and Novartis AG at xx%. These figures are subject to change based on evolving market dynamics.
Innovation is a key driver, with significant investments in developing novel therapies targeting unmet needs in dermatological conditions. The regulatory landscape influences the pace of innovation, with stringent approval processes impacting time-to-market. Mergers and acquisitions (M&A) activities are also prevalent, with deal values exceeding xx Million in recent years, reflecting the strategic importance of expanding product portfolios and market presence. For example, the acquisition of [Company A] by [Company B] in [Year] for xx Million significantly altered market dynamics.
- Key Market Drivers: R&D investments, M&A activities, increasing prevalence of dermatological diseases.
- Key Challenges: Stringent regulatory approvals, high R&D costs, competition from biosimilars.
- Key Trends: Personalized medicine, focus on biologics and targeted therapies.
Dermatological Therapeutics Industry Industry Trends & Insights
The dermatological therapeutics market is experiencing robust growth, driven by rising prevalence of skin diseases globally, increasing healthcare expenditure, and growing awareness among consumers. The market is expected to exhibit a Compound Annual Growth Rate (CAGR) of xx% during the forecast period (2025-2033). This growth is fueled by several factors: the increasing incidence of skin conditions such as psoriasis, atopic dermatitis, and acne; the rising adoption of advanced therapies; and the launch of innovative products.
Technological advancements, including the development of targeted therapies, personalized medicine, and improved diagnostic tools, are transforming the treatment landscape. Consumer preferences are shifting towards minimally invasive procedures and convenient treatment options. Competitive dynamics are characterized by intense rivalry among established players and the emergence of new entrants with innovative products. Market penetration of biologics and targeted therapies is increasing, representing a significant growth opportunity for the industry. The introduction of biosimilars is also impacting market dynamics, leading to increased competition and price pressures.
Dominant Markets & Segments in Dermatological Therapeutics Industry
The North American region holds the dominant position in the global dermatological therapeutics market, followed by Europe and Asia Pacific. Within these regions, the United States represents a key market due to high healthcare expenditure, robust regulatory framework, and substantial investments in R&D.
By Application: Psoriasis and atopic dermatitis represent the largest segments by application, driven by their high prevalence and the availability of effective treatment options. The rosacea segment is also experiencing significant growth.
Key Drivers for Dominant Segments: High prevalence of target diseases, availability of effective treatments, strong research & development efforts, rising healthcare expenditure.
By Drug Class: Corticosteroids remain a significant segment due to their widespread use and established efficacy. However, the market for biologics and targeted therapies is expanding rapidly, due to their superior efficacy and improved safety profiles. Anti-infectives and anti-acne medications also represent sizable markets.
Key Drivers for Dominant Drug Classes: Established efficacy and safety profiles, high market penetration, growing adoption of innovative therapies.
The dominance of specific regions and segments is attributed to several factors, including: economic growth, healthcare infrastructure, disease prevalence, and access to healthcare services.
Dermatological Therapeutics Industry Product Developments
Recent years have witnessed significant advancements in dermatological therapeutics, focusing on developing targeted therapies with improved efficacy and safety profiles. This includes the development of biologics, topical therapies with novel mechanisms of action, and personalized medicine approaches. For instance, the approval of Sotyktu (deucravacitinib) represents a significant milestone in the treatment of psoriasis. These innovations are gaining market acceptance due to their enhanced efficacy and patient convenience, compared to traditional treatments. Technological advancements, such as advancements in drug delivery systems, are also driving product innovation.
Report Scope & Segmentation Analysis
This report comprehensively segments the dermatological therapeutics market by application (Alopecia, Herpes, Psoriasis, Rosacea, Atopic Dermatitis, Other Applications) and by drug class (Anti-infectives, Corticosteroids, Anti-acne, Calcineurin Inhibitors, Retinoids, Other Drug Classes). Each segment is analyzed based on market size, growth projections, and competitive dynamics. For instance, the psoriasis segment is projected to experience significant growth due to its high prevalence and the launch of newer therapies. Similarly, the biologics segment within the drug class categorization shows promising growth trajectory. The report provides detailed insights into each segment's market characteristics and future prospects.
Key Drivers of Dermatological Therapeutics Industry Growth
Several factors contribute to the growth of the dermatological therapeutics market. The increasing prevalence of skin diseases globally is a primary driver, fueled by lifestyle changes and environmental factors. Technological advancements, leading to the development of innovative treatments, are another key driver. Furthermore, rising healthcare expenditure and improved access to healthcare services are supporting market expansion. Favorable regulatory environments also play a crucial role in accelerating product development and market entry.
Challenges in the Dermatological Therapeutics Industry Sector
The dermatological therapeutics industry faces several challenges. Stringent regulatory processes can delay product approvals, increasing time-to-market and development costs. The high cost of R&D and clinical trials represents a significant financial burden. Furthermore, intense competition among established players and the emergence of new entrants can create price pressure. Supply chain disruptions can also impact the availability of raw materials and finished products. These factors collectively influence profitability and overall market growth.
Emerging Opportunities in Dermatological Therapeutics Industry
The dermatological therapeutics industry presents significant emerging opportunities. The development of personalized medicine approaches holds immense potential for tailoring treatment to individual patient needs. Technological advancements in drug delivery systems can improve treatment efficacy and patient compliance. Expanding into emerging markets with high unmet needs represents a significant growth avenue. Exploring novel therapeutic targets and mechanisms of action will continue to drive innovation.
Leading Players in the Dermatological Therapeutics Industry Market
- Sun Pharmaceuticals Ltd
- Novartis AG
- Aurobindo Pharma Ltd
- Amgen Inc
- Eli Lilly and Company
- Galderma SA
- Abbvie Inc (Allergan PLC)
- Almirall SA
- Johnson & Johnson
- Bausch Health Companies Inc
- LEO Pharma AS
- Aclaris Therapeutics Inc
- Bristol-Myers Squibb Company
- GlaxoSmithKline PLC
- Pfizer Inc
Key Developments in Dermatological Therapeutics Industry Industry
- September 2022: US FDA approved Sotyktu (deucravacitinib) for moderate-to-severe plaque psoriasis.
- July 2022: FDA approved roflumilast cream (ZORYVE) 0.3% for plaque psoriasis in patients aged 12 years and above.
- January 2022: Abbvie announced FDA approval of Rinvoq for refractory, moderate-to-severe atopic dermatitis in patients aged 12 years and older. These approvals represent significant advancements in the treatment of prevalent skin diseases and significantly impact market dynamics by offering new treatment options and increasing competition.
Strategic Outlook for Dermatological Therapeutics Industry Market
The dermatological therapeutics market exhibits strong growth potential driven by several factors, including the increasing prevalence of skin diseases, technological advancements, and rising healthcare expenditure. The market is poised for continued expansion, driven by the launch of innovative therapies, personalized medicine approaches, and growth in emerging markets. The focus on developing targeted therapies with improved efficacy and safety profiles will continue to shape the industry landscape. Strategic partnerships and collaborations will be key to maintaining a competitive edge in this rapidly evolving market.
Dermatological Therapeutics Industry Segmentation
-
1. Application
- 1.1. Alopecia
- 1.2. Herpes
- 1.3. Psoriasis
- 1.4. Rosacea
- 1.5. Atopic Dermatitis
- 1.6. Other Applications
-
2. Drug Class
- 2.1. Anti-infectives
- 2.2. Corticosteroids
- 2.3. Anti-acne
- 2.4. Calcineurin Inhibitors
- 2.5. Retinoids
- 2.6. Other Drug Classes
Dermatological Therapeutics Industry Segmentation By Geography
-
1. North America
- 1.1. United States
- 1.2. Canada
- 1.3. Mexico
-
2. Europe
- 2.1. Germany
- 2.2. United Kingdom
- 2.3. France
- 2.4. Italy
- 2.5. Spain
- 2.6. Rest of Europe
-
3. Asia Pacific
- 3.1. China
- 3.2. Japan
- 3.3. India
- 3.4. Australia
- 3.5. South Korea
- 3.6. Rest of Asia Pacific
-
4. Middle East and Africa
- 4.1. GCC
- 4.2. South Africa
- 4.3. Rest of Middle East and Africa
-
5. South America
- 5.1. Brazil
- 5.2. Argentina
- 5.3. Rest of South America
Dermatological Therapeutics Industry REPORT HIGHLIGHTS
| Aspects | Details |
|---|---|
| Study Period | 2019-2033 |
| Base Year | 2024 |
| Estimated Year | 2025 |
| Forecast Period | 2025-2033 |
| Historical Period | 2019-2024 |
| Growth Rate | CAGR of 9.67% from 2019-2033 |
| Segmentation |
|
Table of Contents
- 1. Introduction
- 1.1. Research Scope
- 1.2. Market Segmentation
- 1.3. Research Methodology
- 1.4. Definitions and Assumptions
- 2. Executive Summary
- 2.1. Introduction
- 3. Market Dynamics
- 3.1. Introduction
- 3.2. Market Drivers
- 3.2.1. Growing Burden of Dermatology Diseases; Increasing Awareness Levels of Disease Progression and Etiology; Increasing Elderly Population
- 3.3. Market Restrains
- 3.3.1. Serious Side Effects for Certain Classes of Therapeutic Drugs
- 3.4. Market Trends
- 3.4.1. Psoriasis Segment is Expected to Hold a Significant Market Share Over the Forecast Period
- 4. Market Factor Analysis
- 4.1. Porters Five Forces
- 4.2. Supply/Value Chain
- 4.3. PESTEL analysis
- 4.4. Market Entropy
- 4.5. Patent/Trademark Analysis
- 5. Global Dermatological Therapeutics Industry Analysis, Insights and Forecast, 2019-2031
- 5.1. Market Analysis, Insights and Forecast - by Application
- 5.1.1. Alopecia
- 5.1.2. Herpes
- 5.1.3. Psoriasis
- 5.1.4. Rosacea
- 5.1.5. Atopic Dermatitis
- 5.1.6. Other Applications
- 5.2. Market Analysis, Insights and Forecast - by Drug Class
- 5.2.1. Anti-infectives
- 5.2.2. Corticosteroids
- 5.2.3. Anti-acne
- 5.2.4. Calcineurin Inhibitors
- 5.2.5. Retinoids
- 5.2.6. Other Drug Classes
- 5.3. Market Analysis, Insights and Forecast - by Region
- 5.3.1. North America
- 5.3.2. Europe
- 5.3.3. Asia Pacific
- 5.3.4. Middle East and Africa
- 5.3.5. South America
- 5.1. Market Analysis, Insights and Forecast - by Application
- 6. North America Dermatological Therapeutics Industry Analysis, Insights and Forecast, 2019-2031
- 6.1. Market Analysis, Insights and Forecast - by Application
- 6.1.1. Alopecia
- 6.1.2. Herpes
- 6.1.3. Psoriasis
- 6.1.4. Rosacea
- 6.1.5. Atopic Dermatitis
- 6.1.6. Other Applications
- 6.2. Market Analysis, Insights and Forecast - by Drug Class
- 6.2.1. Anti-infectives
- 6.2.2. Corticosteroids
- 6.2.3. Anti-acne
- 6.2.4. Calcineurin Inhibitors
- 6.2.5. Retinoids
- 6.2.6. Other Drug Classes
- 6.1. Market Analysis, Insights and Forecast - by Application
- 7. Europe Dermatological Therapeutics Industry Analysis, Insights and Forecast, 2019-2031
- 7.1. Market Analysis, Insights and Forecast - by Application
- 7.1.1. Alopecia
- 7.1.2. Herpes
- 7.1.3. Psoriasis
- 7.1.4. Rosacea
- 7.1.5. Atopic Dermatitis
- 7.1.6. Other Applications
- 7.2. Market Analysis, Insights and Forecast - by Drug Class
- 7.2.1. Anti-infectives
- 7.2.2. Corticosteroids
- 7.2.3. Anti-acne
- 7.2.4. Calcineurin Inhibitors
- 7.2.5. Retinoids
- 7.2.6. Other Drug Classes
- 7.1. Market Analysis, Insights and Forecast - by Application
- 8. Asia Pacific Dermatological Therapeutics Industry Analysis, Insights and Forecast, 2019-2031
- 8.1. Market Analysis, Insights and Forecast - by Application
- 8.1.1. Alopecia
- 8.1.2. Herpes
- 8.1.3. Psoriasis
- 8.1.4. Rosacea
- 8.1.5. Atopic Dermatitis
- 8.1.6. Other Applications
- 8.2. Market Analysis, Insights and Forecast - by Drug Class
- 8.2.1. Anti-infectives
- 8.2.2. Corticosteroids
- 8.2.3. Anti-acne
- 8.2.4. Calcineurin Inhibitors
- 8.2.5. Retinoids
- 8.2.6. Other Drug Classes
- 8.1. Market Analysis, Insights and Forecast - by Application
- 9. Middle East and Africa Dermatological Therapeutics Industry Analysis, Insights and Forecast, 2019-2031
- 9.1. Market Analysis, Insights and Forecast - by Application
- 9.1.1. Alopecia
- 9.1.2. Herpes
- 9.1.3. Psoriasis
- 9.1.4. Rosacea
- 9.1.5. Atopic Dermatitis
- 9.1.6. Other Applications
- 9.2. Market Analysis, Insights and Forecast - by Drug Class
- 9.2.1. Anti-infectives
- 9.2.2. Corticosteroids
- 9.2.3. Anti-acne
- 9.2.4. Calcineurin Inhibitors
- 9.2.5. Retinoids
- 9.2.6. Other Drug Classes
- 9.1. Market Analysis, Insights and Forecast - by Application
- 10. South America Dermatological Therapeutics Industry Analysis, Insights and Forecast, 2019-2031
- 10.1. Market Analysis, Insights and Forecast - by Application
- 10.1.1. Alopecia
- 10.1.2. Herpes
- 10.1.3. Psoriasis
- 10.1.4. Rosacea
- 10.1.5. Atopic Dermatitis
- 10.1.6. Other Applications
- 10.2. Market Analysis, Insights and Forecast - by Drug Class
- 10.2.1. Anti-infectives
- 10.2.2. Corticosteroids
- 10.2.3. Anti-acne
- 10.2.4. Calcineurin Inhibitors
- 10.2.5. Retinoids
- 10.2.6. Other Drug Classes
- 10.1. Market Analysis, Insights and Forecast - by Application
- 11. North America Dermatological Therapeutics Industry Analysis, Insights and Forecast, 2019-2031
- 11.1. Market Analysis, Insights and Forecast - By Country/Sub-region
- 11.1.1 United States
- 11.1.2 Canada
- 11.1.3 Mexico
- 12. Europe Dermatological Therapeutics Industry Analysis, Insights and Forecast, 2019-2031
- 12.1. Market Analysis, Insights and Forecast - By Country/Sub-region
- 12.1.1 Germany
- 12.1.2 United Kingdom
- 12.1.3 France
- 12.1.4 Italy
- 12.1.5 Spain
- 12.1.6 Rest of Europe
- 13. Asia Pacific Dermatological Therapeutics Industry Analysis, Insights and Forecast, 2019-2031
- 13.1. Market Analysis, Insights and Forecast - By Country/Sub-region
- 13.1.1 China
- 13.1.2 Japan
- 13.1.3 India
- 13.1.4 Australia
- 13.1.5 South Korea
- 13.1.6 Rest of Asia Pacific
- 14. Middle East and Africa Dermatological Therapeutics Industry Analysis, Insights and Forecast, 2019-2031
- 14.1. Market Analysis, Insights and Forecast - By Country/Sub-region
- 14.1.1 GCC
- 14.1.2 South Africa
- 14.1.3 Rest of Middle East and Africa
- 15. South America Dermatological Therapeutics Industry Analysis, Insights and Forecast, 2019-2031
- 15.1. Market Analysis, Insights and Forecast - By Country/Sub-region
- 15.1.1 Brazil
- 15.1.2 Argentina
- 15.1.3 Rest of South America
- 16. Competitive Analysis
- 16.1. Global Market Share Analysis 2024
- 16.2. Company Profiles
- 16.2.1 Sun Pharmaceuticals Ltd
- 16.2.1.1. Overview
- 16.2.1.2. Products
- 16.2.1.3. SWOT Analysis
- 16.2.1.4. Recent Developments
- 16.2.1.5. Financials (Based on Availability)
- 16.2.2 Novartis AG
- 16.2.2.1. Overview
- 16.2.2.2. Products
- 16.2.2.3. SWOT Analysis
- 16.2.2.4. Recent Developments
- 16.2.2.5. Financials (Based on Availability)
- 16.2.3 Aurobindo Pharma Ltd*List Not Exhaustive
- 16.2.3.1. Overview
- 16.2.3.2. Products
- 16.2.3.3. SWOT Analysis
- 16.2.3.4. Recent Developments
- 16.2.3.5. Financials (Based on Availability)
- 16.2.4 Amgen Inc
- 16.2.4.1. Overview
- 16.2.4.2. Products
- 16.2.4.3. SWOT Analysis
- 16.2.4.4. Recent Developments
- 16.2.4.5. Financials (Based on Availability)
- 16.2.5 Eli Lilly and Company
- 16.2.5.1. Overview
- 16.2.5.2. Products
- 16.2.5.3. SWOT Analysis
- 16.2.5.4. Recent Developments
- 16.2.5.5. Financials (Based on Availability)
- 16.2.6 Galderma SA
- 16.2.6.1. Overview
- 16.2.6.2. Products
- 16.2.6.3. SWOT Analysis
- 16.2.6.4. Recent Developments
- 16.2.6.5. Financials (Based on Availability)
- 16.2.7 Abbvie Inc (Allergan PLC)
- 16.2.7.1. Overview
- 16.2.7.2. Products
- 16.2.7.3. SWOT Analysis
- 16.2.7.4. Recent Developments
- 16.2.7.5. Financials (Based on Availability)
- 16.2.8 Almirall SA
- 16.2.8.1. Overview
- 16.2.8.2. Products
- 16.2.8.3. SWOT Analysis
- 16.2.8.4. Recent Developments
- 16.2.8.5. Financials (Based on Availability)
- 16.2.9 Johnson & Johnson
- 16.2.9.1. Overview
- 16.2.9.2. Products
- 16.2.9.3. SWOT Analysis
- 16.2.9.4. Recent Developments
- 16.2.9.5. Financials (Based on Availability)
- 16.2.10 Bausch Health Companies Inc
- 16.2.10.1. Overview
- 16.2.10.2. Products
- 16.2.10.3. SWOT Analysis
- 16.2.10.4. Recent Developments
- 16.2.10.5. Financials (Based on Availability)
- 16.2.11 LEO Pharma AS
- 16.2.11.1. Overview
- 16.2.11.2. Products
- 16.2.11.3. SWOT Analysis
- 16.2.11.4. Recent Developments
- 16.2.11.5. Financials (Based on Availability)
- 16.2.12 Aclaris Therapeutics Inc
- 16.2.12.1. Overview
- 16.2.12.2. Products
- 16.2.12.3. SWOT Analysis
- 16.2.12.4. Recent Developments
- 16.2.12.5. Financials (Based on Availability)
- 16.2.13 Bristol-Myers Squibb Company
- 16.2.13.1. Overview
- 16.2.13.2. Products
- 16.2.13.3. SWOT Analysis
- 16.2.13.4. Recent Developments
- 16.2.13.5. Financials (Based on Availability)
- 16.2.14 GlaxoSmithKline PLC
- 16.2.14.1. Overview
- 16.2.14.2. Products
- 16.2.14.3. SWOT Analysis
- 16.2.14.4. Recent Developments
- 16.2.14.5. Financials (Based on Availability)
- 16.2.15 Pfizer Inc
- 16.2.15.1. Overview
- 16.2.15.2. Products
- 16.2.15.3. SWOT Analysis
- 16.2.15.4. Recent Developments
- 16.2.15.5. Financials (Based on Availability)
- 16.2.1 Sun Pharmaceuticals Ltd
List of Figures
- Figure 1: Global Dermatological Therapeutics Industry Revenue Breakdown (Million, %) by Region 2024 & 2032
- Figure 2: North America Dermatological Therapeutics Industry Revenue (Million), by Country 2024 & 2032
- Figure 3: North America Dermatological Therapeutics Industry Revenue Share (%), by Country 2024 & 2032
- Figure 4: Europe Dermatological Therapeutics Industry Revenue (Million), by Country 2024 & 2032
- Figure 5: Europe Dermatological Therapeutics Industry Revenue Share (%), by Country 2024 & 2032
- Figure 6: Asia Pacific Dermatological Therapeutics Industry Revenue (Million), by Country 2024 & 2032
- Figure 7: Asia Pacific Dermatological Therapeutics Industry Revenue Share (%), by Country 2024 & 2032
- Figure 8: Middle East and Africa Dermatological Therapeutics Industry Revenue (Million), by Country 2024 & 2032
- Figure 9: Middle East and Africa Dermatological Therapeutics Industry Revenue Share (%), by Country 2024 & 2032
- Figure 10: South America Dermatological Therapeutics Industry Revenue (Million), by Country 2024 & 2032
- Figure 11: South America Dermatological Therapeutics Industry Revenue Share (%), by Country 2024 & 2032
- Figure 12: North America Dermatological Therapeutics Industry Revenue (Million), by Application 2024 & 2032
- Figure 13: North America Dermatological Therapeutics Industry Revenue Share (%), by Application 2024 & 2032
- Figure 14: North America Dermatological Therapeutics Industry Revenue (Million), by Drug Class 2024 & 2032
- Figure 15: North America Dermatological Therapeutics Industry Revenue Share (%), by Drug Class 2024 & 2032
- Figure 16: North America Dermatological Therapeutics Industry Revenue (Million), by Country 2024 & 2032
- Figure 17: North America Dermatological Therapeutics Industry Revenue Share (%), by Country 2024 & 2032
- Figure 18: Europe Dermatological Therapeutics Industry Revenue (Million), by Application 2024 & 2032
- Figure 19: Europe Dermatological Therapeutics Industry Revenue Share (%), by Application 2024 & 2032
- Figure 20: Europe Dermatological Therapeutics Industry Revenue (Million), by Drug Class 2024 & 2032
- Figure 21: Europe Dermatological Therapeutics Industry Revenue Share (%), by Drug Class 2024 & 2032
- Figure 22: Europe Dermatological Therapeutics Industry Revenue (Million), by Country 2024 & 2032
- Figure 23: Europe Dermatological Therapeutics Industry Revenue Share (%), by Country 2024 & 2032
- Figure 24: Asia Pacific Dermatological Therapeutics Industry Revenue (Million), by Application 2024 & 2032
- Figure 25: Asia Pacific Dermatological Therapeutics Industry Revenue Share (%), by Application 2024 & 2032
- Figure 26: Asia Pacific Dermatological Therapeutics Industry Revenue (Million), by Drug Class 2024 & 2032
- Figure 27: Asia Pacific Dermatological Therapeutics Industry Revenue Share (%), by Drug Class 2024 & 2032
- Figure 28: Asia Pacific Dermatological Therapeutics Industry Revenue (Million), by Country 2024 & 2032
- Figure 29: Asia Pacific Dermatological Therapeutics Industry Revenue Share (%), by Country 2024 & 2032
- Figure 30: Middle East and Africa Dermatological Therapeutics Industry Revenue (Million), by Application 2024 & 2032
- Figure 31: Middle East and Africa Dermatological Therapeutics Industry Revenue Share (%), by Application 2024 & 2032
- Figure 32: Middle East and Africa Dermatological Therapeutics Industry Revenue (Million), by Drug Class 2024 & 2032
- Figure 33: Middle East and Africa Dermatological Therapeutics Industry Revenue Share (%), by Drug Class 2024 & 2032
- Figure 34: Middle East and Africa Dermatological Therapeutics Industry Revenue (Million), by Country 2024 & 2032
- Figure 35: Middle East and Africa Dermatological Therapeutics Industry Revenue Share (%), by Country 2024 & 2032
- Figure 36: South America Dermatological Therapeutics Industry Revenue (Million), by Application 2024 & 2032
- Figure 37: South America Dermatological Therapeutics Industry Revenue Share (%), by Application 2024 & 2032
- Figure 38: South America Dermatological Therapeutics Industry Revenue (Million), by Drug Class 2024 & 2032
- Figure 39: South America Dermatological Therapeutics Industry Revenue Share (%), by Drug Class 2024 & 2032
- Figure 40: South America Dermatological Therapeutics Industry Revenue (Million), by Country 2024 & 2032
- Figure 41: South America Dermatological Therapeutics Industry Revenue Share (%), by Country 2024 & 2032
List of Tables
- Table 1: Global Dermatological Therapeutics Industry Revenue Million Forecast, by Region 2019 & 2032
- Table 2: Global Dermatological Therapeutics Industry Revenue Million Forecast, by Application 2019 & 2032
- Table 3: Global Dermatological Therapeutics Industry Revenue Million Forecast, by Drug Class 2019 & 2032
- Table 4: Global Dermatological Therapeutics Industry Revenue Million Forecast, by Region 2019 & 2032
- Table 5: Global Dermatological Therapeutics Industry Revenue Million Forecast, by Country 2019 & 2032
- Table 6: United States Dermatological Therapeutics Industry Revenue (Million) Forecast, by Application 2019 & 2032
- Table 7: Canada Dermatological Therapeutics Industry Revenue (Million) Forecast, by Application 2019 & 2032
- Table 8: Mexico Dermatological Therapeutics Industry Revenue (Million) Forecast, by Application 2019 & 2032
- Table 9: Global Dermatological Therapeutics Industry Revenue Million Forecast, by Country 2019 & 2032
- Table 10: Germany Dermatological Therapeutics Industry Revenue (Million) Forecast, by Application 2019 & 2032
- Table 11: United Kingdom Dermatological Therapeutics Industry Revenue (Million) Forecast, by Application 2019 & 2032
- Table 12: France Dermatological Therapeutics Industry Revenue (Million) Forecast, by Application 2019 & 2032
- Table 13: Italy Dermatological Therapeutics Industry Revenue (Million) Forecast, by Application 2019 & 2032
- Table 14: Spain Dermatological Therapeutics Industry Revenue (Million) Forecast, by Application 2019 & 2032
- Table 15: Rest of Europe Dermatological Therapeutics Industry Revenue (Million) Forecast, by Application 2019 & 2032
- Table 16: Global Dermatological Therapeutics Industry Revenue Million Forecast, by Country 2019 & 2032
- Table 17: China Dermatological Therapeutics Industry Revenue (Million) Forecast, by Application 2019 & 2032
- Table 18: Japan Dermatological Therapeutics Industry Revenue (Million) Forecast, by Application 2019 & 2032
- Table 19: India Dermatological Therapeutics Industry Revenue (Million) Forecast, by Application 2019 & 2032
- Table 20: Australia Dermatological Therapeutics Industry Revenue (Million) Forecast, by Application 2019 & 2032
- Table 21: South Korea Dermatological Therapeutics Industry Revenue (Million) Forecast, by Application 2019 & 2032
- Table 22: Rest of Asia Pacific Dermatological Therapeutics Industry Revenue (Million) Forecast, by Application 2019 & 2032
- Table 23: Global Dermatological Therapeutics Industry Revenue Million Forecast, by Country 2019 & 2032
- Table 24: GCC Dermatological Therapeutics Industry Revenue (Million) Forecast, by Application 2019 & 2032
- Table 25: South Africa Dermatological Therapeutics Industry Revenue (Million) Forecast, by Application 2019 & 2032
- Table 26: Rest of Middle East and Africa Dermatological Therapeutics Industry Revenue (Million) Forecast, by Application 2019 & 2032
- Table 27: Global Dermatological Therapeutics Industry Revenue Million Forecast, by Country 2019 & 2032
- Table 28: Brazil Dermatological Therapeutics Industry Revenue (Million) Forecast, by Application 2019 & 2032
- Table 29: Argentina Dermatological Therapeutics Industry Revenue (Million) Forecast, by Application 2019 & 2032
- Table 30: Rest of South America Dermatological Therapeutics Industry Revenue (Million) Forecast, by Application 2019 & 2032
- Table 31: Global Dermatological Therapeutics Industry Revenue Million Forecast, by Application 2019 & 2032
- Table 32: Global Dermatological Therapeutics Industry Revenue Million Forecast, by Drug Class 2019 & 2032
- Table 33: Global Dermatological Therapeutics Industry Revenue Million Forecast, by Country 2019 & 2032
- Table 34: United States Dermatological Therapeutics Industry Revenue (Million) Forecast, by Application 2019 & 2032
- Table 35: Canada Dermatological Therapeutics Industry Revenue (Million) Forecast, by Application 2019 & 2032
- Table 36: Mexico Dermatological Therapeutics Industry Revenue (Million) Forecast, by Application 2019 & 2032
- Table 37: Global Dermatological Therapeutics Industry Revenue Million Forecast, by Application 2019 & 2032
- Table 38: Global Dermatological Therapeutics Industry Revenue Million Forecast, by Drug Class 2019 & 2032
- Table 39: Global Dermatological Therapeutics Industry Revenue Million Forecast, by Country 2019 & 2032
- Table 40: Germany Dermatological Therapeutics Industry Revenue (Million) Forecast, by Application 2019 & 2032
- Table 41: United Kingdom Dermatological Therapeutics Industry Revenue (Million) Forecast, by Application 2019 & 2032
- Table 42: France Dermatological Therapeutics Industry Revenue (Million) Forecast, by Application 2019 & 2032
- Table 43: Italy Dermatological Therapeutics Industry Revenue (Million) Forecast, by Application 2019 & 2032
- Table 44: Spain Dermatological Therapeutics Industry Revenue (Million) Forecast, by Application 2019 & 2032
- Table 45: Rest of Europe Dermatological Therapeutics Industry Revenue (Million) Forecast, by Application 2019 & 2032
- Table 46: Global Dermatological Therapeutics Industry Revenue Million Forecast, by Application 2019 & 2032
- Table 47: Global Dermatological Therapeutics Industry Revenue Million Forecast, by Drug Class 2019 & 2032
- Table 48: Global Dermatological Therapeutics Industry Revenue Million Forecast, by Country 2019 & 2032
- Table 49: China Dermatological Therapeutics Industry Revenue (Million) Forecast, by Application 2019 & 2032
- Table 50: Japan Dermatological Therapeutics Industry Revenue (Million) Forecast, by Application 2019 & 2032
- Table 51: India Dermatological Therapeutics Industry Revenue (Million) Forecast, by Application 2019 & 2032
- Table 52: Australia Dermatological Therapeutics Industry Revenue (Million) Forecast, by Application 2019 & 2032
- Table 53: South Korea Dermatological Therapeutics Industry Revenue (Million) Forecast, by Application 2019 & 2032
- Table 54: Rest of Asia Pacific Dermatological Therapeutics Industry Revenue (Million) Forecast, by Application 2019 & 2032
- Table 55: Global Dermatological Therapeutics Industry Revenue Million Forecast, by Application 2019 & 2032
- Table 56: Global Dermatological Therapeutics Industry Revenue Million Forecast, by Drug Class 2019 & 2032
- Table 57: Global Dermatological Therapeutics Industry Revenue Million Forecast, by Country 2019 & 2032
- Table 58: GCC Dermatological Therapeutics Industry Revenue (Million) Forecast, by Application 2019 & 2032
- Table 59: South Africa Dermatological Therapeutics Industry Revenue (Million) Forecast, by Application 2019 & 2032
- Table 60: Rest of Middle East and Africa Dermatological Therapeutics Industry Revenue (Million) Forecast, by Application 2019 & 2032
- Table 61: Global Dermatological Therapeutics Industry Revenue Million Forecast, by Application 2019 & 2032
- Table 62: Global Dermatological Therapeutics Industry Revenue Million Forecast, by Drug Class 2019 & 2032
- Table 63: Global Dermatological Therapeutics Industry Revenue Million Forecast, by Country 2019 & 2032
- Table 64: Brazil Dermatological Therapeutics Industry Revenue (Million) Forecast, by Application 2019 & 2032
- Table 65: Argentina Dermatological Therapeutics Industry Revenue (Million) Forecast, by Application 2019 & 2032
- Table 66: Rest of South America Dermatological Therapeutics Industry Revenue (Million) Forecast, by Application 2019 & 2032
Frequently Asked Questions
1. What is the projected Compound Annual Growth Rate (CAGR) of the Dermatological Therapeutics Industry?
The projected CAGR is approximately 9.67%.
2. Which companies are prominent players in the Dermatological Therapeutics Industry?
Key companies in the market include Sun Pharmaceuticals Ltd, Novartis AG, Aurobindo Pharma Ltd*List Not Exhaustive, Amgen Inc, Eli Lilly and Company, Galderma SA, Abbvie Inc (Allergan PLC), Almirall SA, Johnson & Johnson, Bausch Health Companies Inc, LEO Pharma AS, Aclaris Therapeutics Inc, Bristol-Myers Squibb Company, GlaxoSmithKline PLC, Pfizer Inc.
3. What are the main segments of the Dermatological Therapeutics Industry?
The market segments include Application, Drug Class.
4. Can you provide details about the market size?
The market size is estimated to be USD 45.17 Million as of 2022.
5. What are some drivers contributing to market growth?
Growing Burden of Dermatology Diseases; Increasing Awareness Levels of Disease Progression and Etiology; Increasing Elderly Population.
6. What are the notable trends driving market growth?
Psoriasis Segment is Expected to Hold a Significant Market Share Over the Forecast Period.
7. Are there any restraints impacting market growth?
Serious Side Effects for Certain Classes of Therapeutic Drugs.
8. Can you provide examples of recent developments in the market?
In September 2022, the US FDA approved Sotyktu (deucravacitinib), an oral treatment for adults with moderate-to-severe plaque psoriasis who are candidates for systemic therapy or phototherapy.
9. What pricing options are available for accessing the report?
Pricing options include single-user, multi-user, and enterprise licenses priced at USD 4750, USD 5250, and USD 8750 respectively.
10. Is the market size provided in terms of value or volume?
The market size is provided in terms of value, measured in Million.
11. Are there any specific market keywords associated with the report?
Yes, the market keyword associated with the report is "Dermatological Therapeutics Industry," which aids in identifying and referencing the specific market segment covered.
12. How do I determine which pricing option suits my needs best?
The pricing options vary based on user requirements and access needs. Individual users may opt for single-user licenses, while businesses requiring broader access may choose multi-user or enterprise licenses for cost-effective access to the report.
13. Are there any additional resources or data provided in the Dermatological Therapeutics Industry report?
While the report offers comprehensive insights, it's advisable to review the specific contents or supplementary materials provided to ascertain if additional resources or data are available.
14. How can I stay updated on further developments or reports in the Dermatological Therapeutics Industry?
To stay informed about further developments, trends, and reports in the Dermatological Therapeutics Industry, consider subscribing to industry newsletters, following relevant companies and organizations, or regularly checking reputable industry news sources and publications.
Methodology
Step 1 - Identification of Relevant Samples Size from Population Database


Step 2 - Approaches for Defining Global Market Size (Value, Volume* & Price*)

Note*: In applicable scenarios
Step 3 - Data Sources
Primary Research
- Web Analytics
- Survey Reports
- Research Institute
- Latest Research Reports
- Opinion Leaders
Secondary Research
- Annual Reports
- White Paper
- Latest Press Release
- Industry Association
- Paid Database
- Investor Presentations

Step 4 - Data Triangulation
Involves using different sources of information in order to increase the validity of a study
These sources are likely to be stakeholders in a program - participants, other researchers, program staff, other community members, and so on.
Then we put all data in single framework & apply various statistical tools to find out the dynamic on the market.
During the analysis stage, feedback from the stakeholder groups would be compared to determine areas of agreement as well as areas of divergence


