
Key Insights
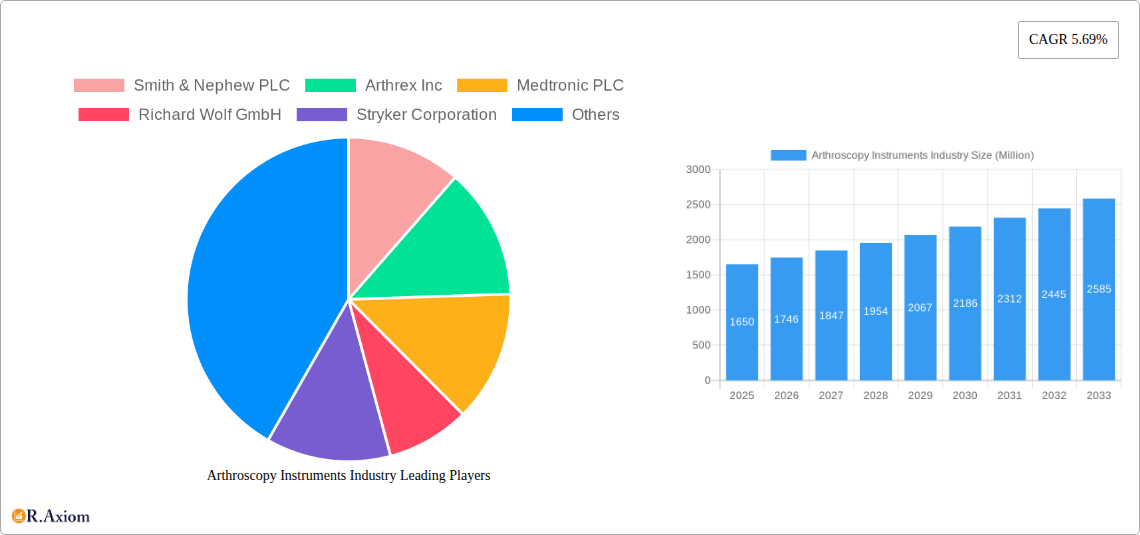
The global arthroscopy instruments market, valued at $1.65 billion in 2025, is projected to experience robust growth, driven by an increasing prevalence of orthopedic conditions like osteoarthritis and sports injuries. A compound annual growth rate (CAGR) of 5.69% is anticipated from 2025 to 2033, indicating a substantial market expansion. This growth is fueled by several key factors. Technological advancements in arthroscopic techniques, such as minimally invasive surgeries and improved visualization systems, are enhancing surgical precision and patient outcomes, driving market adoption. The rising geriatric population, susceptible to age-related joint degeneration, further contributes to the market's expansion. Additionally, increasing healthcare expenditure and rising awareness regarding arthroscopic procedures are bolstering market growth across various regions. While high procedure costs and potential complications associated with arthroscopy could pose some challenges, the overall market outlook remains positive.
Segment-wise, arthroscopes, arthroscopic implants, and visualization systems are expected to dominate the product segment, due to their essential role in arthroscopic procedures. Knee arthroscopy remains the leading application segment, given the high incidence of knee-related injuries and degenerative diseases. Geographically, North America and Europe currently hold significant market shares, attributed to advanced healthcare infrastructure and high adoption rates. However, rapidly developing economies in the Asia-Pacific region are expected to show substantial growth in the coming years, presenting lucrative opportunities for market players. Key players like Smith & Nephew, Arthrex, Medtronic, and Stryker are investing heavily in R&D and strategic partnerships to maintain their competitive edge in this expanding market. The focus is on innovation, introducing advanced instruments and improving existing technologies to cater to the evolving needs of surgeons and patients.
Arthroscopy Instruments Industry: A Comprehensive Market Report (2019-2033)
This in-depth report provides a comprehensive analysis of the Arthroscopy Instruments market, offering valuable insights for stakeholders across the value chain. Covering the period from 2019 to 2033, with a focus on 2025, this report examines market dynamics, key players, and future growth potential. The report leverages extensive data analysis to deliver actionable intelligence, equipping businesses to make informed strategic decisions.
Arthroscopy Instruments Industry Market Concentration & Innovation
The Arthroscopy Instruments market exhibits moderate concentration, with key players such as Smith & Nephew PLC, Arthrex Inc, Medtronic PLC, Richard Wolf GmbH, Stryker Corporation, Karl Storz GmbH & Co KG, Conmed Corporation, and Johnson & Johnson holding significant market share. Precise market share figures for 2025 are currently under estimation (xx%). However, analysis of historical data suggests a relatively stable competitive landscape with a gradual increase in consolidation through mergers and acquisitions (M&A). Innovation is a key driver, with continuous advancements in arthroscopic instruments, including improved visualization systems, minimally invasive techniques, and smart technologies.
- Innovation Drivers: Miniaturization of instruments, enhanced imaging capabilities, robotic-assisted surgery, and development of biocompatible materials.
- Regulatory Frameworks: Stringent regulatory approvals (e.g., FDA clearance) impact product launches and market entry.
- Product Substitutes: Limited direct substitutes, but alternative surgical procedures pose indirect competition.
- End-User Trends: Increasing demand for minimally invasive procedures and improved patient outcomes drives market growth.
- M&A Activity: While precise deal values for the historical period (2019-2024) are under analysis (xx Million), the industry has seen strategic acquisitions aimed at expanding product portfolios and geographical reach.
Arthroscopy Instruments Industry Industry Trends & Insights
The global Arthroscopy Instruments market is experiencing robust growth, driven by several key factors. The increasing prevalence of osteoarthritis, sports injuries, and other musculoskeletal disorders is significantly fueling demand for arthroscopic procedures. Technological advancements, such as the development of smaller, more precise instruments and improved imaging systems, further enhance the efficiency and effectiveness of arthroscopy, boosting market adoption. This is reflected in a projected Compound Annual Growth Rate (CAGR) of xx% during the forecast period (2025-2033), with market penetration steadily increasing across various geographical regions. Consumer preferences are shifting towards minimally invasive procedures due to their faster recovery times and reduced scarring, reinforcing the positive growth trajectory. The competitive landscape is dynamic, with established players focusing on R&D and strategic partnerships to maintain a competitive edge.

Dominant Markets & Segments in Arthroscopy Instruments Industry
The North American market currently holds the largest share of the global Arthroscopy Instruments market, driven by high healthcare expenditure, advanced medical infrastructure, and a large patient pool. However, Asia-Pacific is projected to witness the fastest growth rate during the forecast period due to rising disposable incomes, increasing healthcare awareness, and expanding medical tourism.
Dominant Product Segments:
- Arthroscopes: High demand due to their essential role in minimally invasive procedures.
- Arthroscopic Implants: Significant growth potential due to advancements in biocompatible materials and improved designs.
- Visualization Systems: Technological advancements, like improved imaging clarity and 3D visualization, are driving market expansion.
Dominant Application Segments:
- Knee Arthroscopy: Largest segment due to the high incidence of knee injuries and osteoarthritis.
- Shoulder and Elbow Arthroscopy: Growing segment driven by increasing sports participation and related injuries.
Key Drivers for Dominant Segments:
- Economic Policies: Government funding and initiatives for healthcare infrastructure development impact market growth.
- Healthcare Infrastructure: Availability of advanced surgical facilities and skilled surgeons contributes to market expansion.
- Technological Advancements: Improved instrument designs and imaging technologies enhance procedural outcomes, boosting adoption.
Arthroscopy Instruments Industry Product Developments
Recent product innovations have focused on enhancing precision, minimizing invasiveness, and improving visualization capabilities. New arthroscopic instruments incorporate advanced materials, enabling greater durability and biocompatibility. Technological trends are towards smaller, more flexible instruments, alongside integration with robotics and AI-powered imaging systems to improve surgical accuracy. This focus on technological advancement is directly shaping market fit by catering to the growing demand for minimally invasive, effective, and efficient arthroscopic procedures.
Report Scope & Segmentation Analysis
This report segments the Arthroscopy Instruments market by product (Arthroscope, Arthroscopic Implant, Fluid Management System, Radiofrequency (RF) System, Visualization System, Other Products) and application (Knee Arthroscopy, Hip Arthroscopy, Spine Arthroscopy, Shoulder and Elbow Arthroscopy, Other Arthroscopy Applications). Each segment is analyzed in detail, providing growth projections, market size estimations, and competitive dynamics. For instance, the arthroscopic implants segment is projected to experience substantial growth due to increasing demand for minimally invasive joint replacement procedures. Similarly, the knee arthroscopy application segment is expected to dominate due to the high incidence of knee-related ailments.
Key Drivers of Arthroscopy Instruments Growth
Growth in the Arthroscopy Instruments market is propelled by several factors: the rising prevalence of osteoarthritis and sports injuries, technological advancements resulting in smaller, more precise instruments and better visualization systems, a growing preference for minimally invasive procedures among patients and surgeons, increasing healthcare expenditure globally, and supportive regulatory frameworks promoting innovation in medical devices. These elements collectively drive market expansion and adoption.
Challenges in the Arthroscopy Instruments Industry Sector
The Arthroscopy Instruments industry faces challenges such as stringent regulatory approvals and compliance requirements, increasing competition from both established players and new entrants, potential supply chain disruptions affecting raw material availability and manufacturing processes, and pressure to reduce costs while maintaining high quality standards. These factors can impact profitability and market share. The estimated impact of these challenges on market growth is currently under review (xx%).
Emerging Opportunities in Arthroscopy Instruments Industry
The market presents opportunities in developing new arthroscopic instruments for minimally invasive procedures, integrating advanced imaging technologies (AI, 3D) into surgical systems, expanding into emerging markets with rising healthcare expenditure, and focusing on personalized medicine approaches. Furthermore, collaborations and partnerships to develop innovative products and technologies are key for seizing opportunities and maintaining a competitive edge.
Leading Players in the Arthroscopy Instruments Industry Market
- Smith & Nephew PLC
- Arthrex Inc
- Medtronic PLC
- Richard Wolf GmbH
- Stryker Corporation
- Karl Storz GmbH & Co KG
- Conmed Corporation
- Johnson & Johnson
Key Developments in Arthroscopy Instruments Industry
- December 2020: Arthrex Inc. launched SwiveLock ACL Repair Kit, the first and only Food and Drug Administration-cleared primary repair kit for repairing anterior cruciate ligament (ACL) tears. This launch significantly impacted the market by introducing a novel, effective solution for ACL repair.
- February 2022: Formus Labs raised USD 5 Million and struck a partnership with Zimmer Biomet for the co-development and global distribution of its technology. This partnership signifies a significant move towards expanding the reach and adoption of innovative arthroscopy technologies.
Strategic Outlook for Arthroscopy Instruments Market
The Arthroscopy Instruments market is poised for continued growth, driven by technological advancements, a rising prevalence of musculoskeletal disorders, and an increasing preference for minimally invasive surgeries. Future market potential lies in developing advanced instruments, integrating AI and robotics, expanding into new markets, and focusing on providing personalized solutions to improve patient outcomes. Strategic partnerships and collaborations will play a crucial role in shaping the future of the Arthroscopy Instruments market.
Arthroscopy Instruments Industry Segmentation
-
1. Application
- 1.1. Knee Arthroscopy
- 1.2. Hip Arthroscopy
- 1.3. Spine Arthroscopy
- 1.4. Shoulder and Elbow Arthroscopy
- 1.5. Other Arthroscopy Applications
-
2. Product
- 2.1. Arthroscope
- 2.2. Arthroscopic Implant
- 2.3. Fluid Management System
- 2.4. Radiofrequency (RF) System
- 2.5. Visualization System
- 2.6. Other Products
Arthroscopy Instruments Industry Segmentation By Geography
-
1. North America
- 1.1. United States
- 1.2. Canada
- 1.3. Mexico
-
2. Europe
- 2.1. Germany
- 2.2. United Kingdom
- 2.3. France
- 2.4. Italy
- 2.5. Spain
- 2.6. Rest of Europe
-
3. Asia Pacific
- 3.1. China
- 3.2. Japan
- 3.3. India
- 3.4. Australia
- 3.5. South korea
- 3.6. Rest of Asia Pacific
- 4. Middle East
-
5. GCC
- 5.1. South Africa
- 5.2. Rest of Middle East
-
6. South America
- 6.1. Brazil
- 6.2. Argentina
- 6.3. Rest of South America

Arthroscopy Instruments Industry REPORT HIGHLIGHTS
| Aspects | Details |
|---|---|
| Study Period | 2019-2033 |
| Base Year | 2024 |
| Estimated Year | 2025 |
| Forecast Period | 2025-2033 |
| Historical Period | 2019-2024 |
| Growth Rate | CAGR of 5.69% from 2019-2033 |
| Segmentation |
|
Table of Contents
- 1. Introduction
- 1.1. Research Scope
- 1.2. Market Segmentation
- 1.3. Research Methodology
- 1.4. Definitions and Assumptions
- 2. Executive Summary
- 2.1. Introduction
- 3. Market Dynamics
- 3.1. Introduction
- 3.2. Market Drivers
- 3.2.1. Increasing Incidences of Sports Injuries; Rising Geriatric Population; Technological Advancements in Arthroscopic Implants
- 3.3. Market Restrains
- 3.3.1. Lack of Skilled Surgeons; Stringent Regulatory Requirements; High Cost of Arthroscopy Devices
- 3.4. Market Trends
- 3.4.1. Knee Arthroscopy Segment is Expected to Witness Growth Over the Forecast Period
- 4. Market Factor Analysis
- 4.1. Porters Five Forces
- 4.2. Supply/Value Chain
- 4.3. PESTEL analysis
- 4.4. Market Entropy
- 4.5. Patent/Trademark Analysis
- 5. Global Arthroscopy Instruments Industry Analysis, Insights and Forecast, 2019-2031
- 5.1. Market Analysis, Insights and Forecast - by Application
- 5.1.1. Knee Arthroscopy
- 5.1.2. Hip Arthroscopy
- 5.1.3. Spine Arthroscopy
- 5.1.4. Shoulder and Elbow Arthroscopy
- 5.1.5. Other Arthroscopy Applications
- 5.2. Market Analysis, Insights and Forecast - by Product
- 5.2.1. Arthroscope
- 5.2.2. Arthroscopic Implant
- 5.2.3. Fluid Management System
- 5.2.4. Radiofrequency (RF) System
- 5.2.5. Visualization System
- 5.2.6. Other Products
- 5.3. Market Analysis, Insights and Forecast - by Region
- 5.3.1. North America
- 5.3.2. Europe
- 5.3.3. Asia Pacific
- 5.3.4. Middle East
- 5.3.5. GCC
- 5.3.6. South America
- 5.1. Market Analysis, Insights and Forecast - by Application
- 6. North America Arthroscopy Instruments Industry Analysis, Insights and Forecast, 2019-2031
- 6.1. Market Analysis, Insights and Forecast - by Application
- 6.1.1. Knee Arthroscopy
- 6.1.2. Hip Arthroscopy
- 6.1.3. Spine Arthroscopy
- 6.1.4. Shoulder and Elbow Arthroscopy
- 6.1.5. Other Arthroscopy Applications
- 6.2. Market Analysis, Insights and Forecast - by Product
- 6.2.1. Arthroscope
- 6.2.2. Arthroscopic Implant
- 6.2.3. Fluid Management System
- 6.2.4. Radiofrequency (RF) System
- 6.2.5. Visualization System
- 6.2.6. Other Products
- 6.1. Market Analysis, Insights and Forecast - by Application
- 7. Europe Arthroscopy Instruments Industry Analysis, Insights and Forecast, 2019-2031
- 7.1. Market Analysis, Insights and Forecast - by Application
- 7.1.1. Knee Arthroscopy
- 7.1.2. Hip Arthroscopy
- 7.1.3. Spine Arthroscopy
- 7.1.4. Shoulder and Elbow Arthroscopy
- 7.1.5. Other Arthroscopy Applications
- 7.2. Market Analysis, Insights and Forecast - by Product
- 7.2.1. Arthroscope
- 7.2.2. Arthroscopic Implant
- 7.2.3. Fluid Management System
- 7.2.4. Radiofrequency (RF) System
- 7.2.5. Visualization System
- 7.2.6. Other Products
- 7.1. Market Analysis, Insights and Forecast - by Application
- 8. Asia Pacific Arthroscopy Instruments Industry Analysis, Insights and Forecast, 2019-2031
- 8.1. Market Analysis, Insights and Forecast - by Application
- 8.1.1. Knee Arthroscopy
- 8.1.2. Hip Arthroscopy
- 8.1.3. Spine Arthroscopy
- 8.1.4. Shoulder and Elbow Arthroscopy
- 8.1.5. Other Arthroscopy Applications
- 8.2. Market Analysis, Insights and Forecast - by Product
- 8.2.1. Arthroscope
- 8.2.2. Arthroscopic Implant
- 8.2.3. Fluid Management System
- 8.2.4. Radiofrequency (RF) System
- 8.2.5. Visualization System
- 8.2.6. Other Products
- 8.1. Market Analysis, Insights and Forecast - by Application
- 9. Middle East Arthroscopy Instruments Industry Analysis, Insights and Forecast, 2019-2031
- 9.1. Market Analysis, Insights and Forecast - by Application
- 9.1.1. Knee Arthroscopy
- 9.1.2. Hip Arthroscopy
- 9.1.3. Spine Arthroscopy
- 9.1.4. Shoulder and Elbow Arthroscopy
- 9.1.5. Other Arthroscopy Applications
- 9.2. Market Analysis, Insights and Forecast - by Product
- 9.2.1. Arthroscope
- 9.2.2. Arthroscopic Implant
- 9.2.3. Fluid Management System
- 9.2.4. Radiofrequency (RF) System
- 9.2.5. Visualization System
- 9.2.6. Other Products
- 9.1. Market Analysis, Insights and Forecast - by Application
- 10. GCC Arthroscopy Instruments Industry Analysis, Insights and Forecast, 2019-2031
- 10.1. Market Analysis, Insights and Forecast - by Application
- 10.1.1. Knee Arthroscopy
- 10.1.2. Hip Arthroscopy
- 10.1.3. Spine Arthroscopy
- 10.1.4. Shoulder and Elbow Arthroscopy
- 10.1.5. Other Arthroscopy Applications
- 10.2. Market Analysis, Insights and Forecast - by Product
- 10.2.1. Arthroscope
- 10.2.2. Arthroscopic Implant
- 10.2.3. Fluid Management System
- 10.2.4. Radiofrequency (RF) System
- 10.2.5. Visualization System
- 10.2.6. Other Products
- 10.1. Market Analysis, Insights and Forecast - by Application
- 11. South America Arthroscopy Instruments Industry Analysis, Insights and Forecast, 2019-2031
- 11.1. Market Analysis, Insights and Forecast - by Application
- 11.1.1. Knee Arthroscopy
- 11.1.2. Hip Arthroscopy
- 11.1.3. Spine Arthroscopy
- 11.1.4. Shoulder and Elbow Arthroscopy
- 11.1.5. Other Arthroscopy Applications
- 11.2. Market Analysis, Insights and Forecast - by Product
- 11.2.1. Arthroscope
- 11.2.2. Arthroscopic Implant
- 11.2.3. Fluid Management System
- 11.2.4. Radiofrequency (RF) System
- 11.2.5. Visualization System
- 11.2.6. Other Products
- 11.1. Market Analysis, Insights and Forecast - by Application
- 12. North America Arthroscopy Instruments Industry Analysis, Insights and Forecast, 2019-2031
- 12.1. Market Analysis, Insights and Forecast - By Country/Sub-region
- 12.1.1. undefined
- 13. Europe Arthroscopy Instruments Industry Analysis, Insights and Forecast, 2019-2031
- 13.1. Market Analysis, Insights and Forecast - By Country/Sub-region
- 13.1.1. undefined
- 14. Asia Pacific Arthroscopy Instruments Industry Analysis, Insights and Forecast, 2019-2031
- 14.1. Market Analysis, Insights and Forecast - By Country/Sub-region
- 14.1.1. undefined
- 15. GCC Arthroscopy Instruments Industry Analysis, Insights and Forecast, 2019-2031
- 15.1. Market Analysis, Insights and Forecast - By Country/Sub-region
- 15.1.1. undefined
- 16. South America Arthroscopy Instruments Industry Analysis, Insights and Forecast, 2019-2031
- 16.1. Market Analysis, Insights and Forecast - By Country/Sub-region
- 16.1.1. undefined
- 17. Competitive Analysis
- 17.1. Global Market Share Analysis 2024
- 17.2. Company Profiles
- 17.2.1 Smith & Nephew PLC
- 17.2.1.1. Overview
- 17.2.1.2. Products
- 17.2.1.3. SWOT Analysis
- 17.2.1.4. Recent Developments
- 17.2.1.5. Financials (Based on Availability)
- 17.2.2 Arthrex Inc
- 17.2.2.1. Overview
- 17.2.2.2. Products
- 17.2.2.3. SWOT Analysis
- 17.2.2.4. Recent Developments
- 17.2.2.5. Financials (Based on Availability)
- 17.2.3 Medtronic PLC
- 17.2.3.1. Overview
- 17.2.3.2. Products
- 17.2.3.3. SWOT Analysis
- 17.2.3.4. Recent Developments
- 17.2.3.5. Financials (Based on Availability)
- 17.2.4 Richard Wolf GmbH
- 17.2.4.1. Overview
- 17.2.4.2. Products
- 17.2.4.3. SWOT Analysis
- 17.2.4.4. Recent Developments
- 17.2.4.5. Financials (Based on Availability)
- 17.2.5 Stryker Corporation
- 17.2.5.1. Overview
- 17.2.5.2. Products
- 17.2.5.3. SWOT Analysis
- 17.2.5.4. Recent Developments
- 17.2.5.5. Financials (Based on Availability)
- 17.2.6 Karl Storz GmbH & Co KG
- 17.2.6.1. Overview
- 17.2.6.2. Products
- 17.2.6.3. SWOT Analysis
- 17.2.6.4. Recent Developments
- 17.2.6.5. Financials (Based on Availability)
- 17.2.7 Conmed Corporation
- 17.2.7.1. Overview
- 17.2.7.2. Products
- 17.2.7.3. SWOT Analysis
- 17.2.7.4. Recent Developments
- 17.2.7.5. Financials (Based on Availability)
- 17.2.8 Johnson & Johnson
- 17.2.8.1. Overview
- 17.2.8.2. Products
- 17.2.8.3. SWOT Analysis
- 17.2.8.4. Recent Developments
- 17.2.8.5. Financials (Based on Availability)
- 17.2.1 Smith & Nephew PLC
List of Figures
- Figure 1: Global Arthroscopy Instruments Industry Revenue Breakdown (Million, %) by Region 2024 & 2032
- Figure 2: Global Arthroscopy Instruments Industry Volume Breakdown (K Unit, %) by Region 2024 & 2032
- Figure 3: North America Arthroscopy Instruments Industry Revenue (Million), by Country 2024 & 2032
- Figure 4: North America Arthroscopy Instruments Industry Volume (K Unit), by Country 2024 & 2032
- Figure 5: North America Arthroscopy Instruments Industry Revenue Share (%), by Country 2024 & 2032
- Figure 6: North America Arthroscopy Instruments Industry Volume Share (%), by Country 2024 & 2032
- Figure 7: Europe Arthroscopy Instruments Industry Revenue (Million), by Country 2024 & 2032
- Figure 8: Europe Arthroscopy Instruments Industry Volume (K Unit), by Country 2024 & 2032
- Figure 9: Europe Arthroscopy Instruments Industry Revenue Share (%), by Country 2024 & 2032
- Figure 10: Europe Arthroscopy Instruments Industry Volume Share (%), by Country 2024 & 2032
- Figure 11: Asia Pacific Arthroscopy Instruments Industry Revenue (Million), by Country 2024 & 2032
- Figure 12: Asia Pacific Arthroscopy Instruments Industry Volume (K Unit), by Country 2024 & 2032
- Figure 13: Asia Pacific Arthroscopy Instruments Industry Revenue Share (%), by Country 2024 & 2032
- Figure 14: Asia Pacific Arthroscopy Instruments Industry Volume Share (%), by Country 2024 & 2032
- Figure 15: GCC Arthroscopy Instruments Industry Revenue (Million), by Country 2024 & 2032
- Figure 16: GCC Arthroscopy Instruments Industry Volume (K Unit), by Country 2024 & 2032
- Figure 17: GCC Arthroscopy Instruments Industry Revenue Share (%), by Country 2024 & 2032
- Figure 18: GCC Arthroscopy Instruments Industry Volume Share (%), by Country 2024 & 2032
- Figure 19: South America Arthroscopy Instruments Industry Revenue (Million), by Country 2024 & 2032
- Figure 20: South America Arthroscopy Instruments Industry Volume (K Unit), by Country 2024 & 2032
- Figure 21: South America Arthroscopy Instruments Industry Revenue Share (%), by Country 2024 & 2032
- Figure 22: South America Arthroscopy Instruments Industry Volume Share (%), by Country 2024 & 2032
- Figure 23: North America Arthroscopy Instruments Industry Revenue (Million), by Application 2024 & 2032
- Figure 24: North America Arthroscopy Instruments Industry Volume (K Unit), by Application 2024 & 2032
- Figure 25: North America Arthroscopy Instruments Industry Revenue Share (%), by Application 2024 & 2032
- Figure 26: North America Arthroscopy Instruments Industry Volume Share (%), by Application 2024 & 2032
- Figure 27: North America Arthroscopy Instruments Industry Revenue (Million), by Product 2024 & 2032
- Figure 28: North America Arthroscopy Instruments Industry Volume (K Unit), by Product 2024 & 2032
- Figure 29: North America Arthroscopy Instruments Industry Revenue Share (%), by Product 2024 & 2032
- Figure 30: North America Arthroscopy Instruments Industry Volume Share (%), by Product 2024 & 2032
- Figure 31: North America Arthroscopy Instruments Industry Revenue (Million), by Country 2024 & 2032
- Figure 32: North America Arthroscopy Instruments Industry Volume (K Unit), by Country 2024 & 2032
- Figure 33: North America Arthroscopy Instruments Industry Revenue Share (%), by Country 2024 & 2032
- Figure 34: North America Arthroscopy Instruments Industry Volume Share (%), by Country 2024 & 2032
- Figure 35: Europe Arthroscopy Instruments Industry Revenue (Million), by Application 2024 & 2032
- Figure 36: Europe Arthroscopy Instruments Industry Volume (K Unit), by Application 2024 & 2032
- Figure 37: Europe Arthroscopy Instruments Industry Revenue Share (%), by Application 2024 & 2032
- Figure 38: Europe Arthroscopy Instruments Industry Volume Share (%), by Application 2024 & 2032
- Figure 39: Europe Arthroscopy Instruments Industry Revenue (Million), by Product 2024 & 2032
- Figure 40: Europe Arthroscopy Instruments Industry Volume (K Unit), by Product 2024 & 2032
- Figure 41: Europe Arthroscopy Instruments Industry Revenue Share (%), by Product 2024 & 2032
- Figure 42: Europe Arthroscopy Instruments Industry Volume Share (%), by Product 2024 & 2032
- Figure 43: Europe Arthroscopy Instruments Industry Revenue (Million), by Country 2024 & 2032
- Figure 44: Europe Arthroscopy Instruments Industry Volume (K Unit), by Country 2024 & 2032
- Figure 45: Europe Arthroscopy Instruments Industry Revenue Share (%), by Country 2024 & 2032
- Figure 46: Europe Arthroscopy Instruments Industry Volume Share (%), by Country 2024 & 2032
- Figure 47: Asia Pacific Arthroscopy Instruments Industry Revenue (Million), by Application 2024 & 2032
- Figure 48: Asia Pacific Arthroscopy Instruments Industry Volume (K Unit), by Application 2024 & 2032
- Figure 49: Asia Pacific Arthroscopy Instruments Industry Revenue Share (%), by Application 2024 & 2032
- Figure 50: Asia Pacific Arthroscopy Instruments Industry Volume Share (%), by Application 2024 & 2032
- Figure 51: Asia Pacific Arthroscopy Instruments Industry Revenue (Million), by Product 2024 & 2032
- Figure 52: Asia Pacific Arthroscopy Instruments Industry Volume (K Unit), by Product 2024 & 2032
- Figure 53: Asia Pacific Arthroscopy Instruments Industry Revenue Share (%), by Product 2024 & 2032
- Figure 54: Asia Pacific Arthroscopy Instruments Industry Volume Share (%), by Product 2024 & 2032
- Figure 55: Asia Pacific Arthroscopy Instruments Industry Revenue (Million), by Country 2024 & 2032
- Figure 56: Asia Pacific Arthroscopy Instruments Industry Volume (K Unit), by Country 2024 & 2032
- Figure 57: Asia Pacific Arthroscopy Instruments Industry Revenue Share (%), by Country 2024 & 2032
- Figure 58: Asia Pacific Arthroscopy Instruments Industry Volume Share (%), by Country 2024 & 2032
- Figure 59: Middle East Arthroscopy Instruments Industry Revenue (Million), by Application 2024 & 2032
- Figure 60: Middle East Arthroscopy Instruments Industry Volume (K Unit), by Application 2024 & 2032
- Figure 61: Middle East Arthroscopy Instruments Industry Revenue Share (%), by Application 2024 & 2032
- Figure 62: Middle East Arthroscopy Instruments Industry Volume Share (%), by Application 2024 & 2032
- Figure 63: Middle East Arthroscopy Instruments Industry Revenue (Million), by Product 2024 & 2032
- Figure 64: Middle East Arthroscopy Instruments Industry Volume (K Unit), by Product 2024 & 2032
- Figure 65: Middle East Arthroscopy Instruments Industry Revenue Share (%), by Product 2024 & 2032
- Figure 66: Middle East Arthroscopy Instruments Industry Volume Share (%), by Product 2024 & 2032
- Figure 67: Middle East Arthroscopy Instruments Industry Revenue (Million), by Country 2024 & 2032
- Figure 68: Middle East Arthroscopy Instruments Industry Volume (K Unit), by Country 2024 & 2032
- Figure 69: Middle East Arthroscopy Instruments Industry Revenue Share (%), by Country 2024 & 2032
- Figure 70: Middle East Arthroscopy Instruments Industry Volume Share (%), by Country 2024 & 2032
- Figure 71: GCC Arthroscopy Instruments Industry Revenue (Million), by Application 2024 & 2032
- Figure 72: GCC Arthroscopy Instruments Industry Volume (K Unit), by Application 2024 & 2032
- Figure 73: GCC Arthroscopy Instruments Industry Revenue Share (%), by Application 2024 & 2032
- Figure 74: GCC Arthroscopy Instruments Industry Volume Share (%), by Application 2024 & 2032
- Figure 75: GCC Arthroscopy Instruments Industry Revenue (Million), by Product 2024 & 2032
- Figure 76: GCC Arthroscopy Instruments Industry Volume (K Unit), by Product 2024 & 2032
- Figure 77: GCC Arthroscopy Instruments Industry Revenue Share (%), by Product 2024 & 2032
- Figure 78: GCC Arthroscopy Instruments Industry Volume Share (%), by Product 2024 & 2032
- Figure 79: GCC Arthroscopy Instruments Industry Revenue (Million), by Country 2024 & 2032
- Figure 80: GCC Arthroscopy Instruments Industry Volume (K Unit), by Country 2024 & 2032
- Figure 81: GCC Arthroscopy Instruments Industry Revenue Share (%), by Country 2024 & 2032
- Figure 82: GCC Arthroscopy Instruments Industry Volume Share (%), by Country 2024 & 2032
- Figure 83: South America Arthroscopy Instruments Industry Revenue (Million), by Application 2024 & 2032
- Figure 84: South America Arthroscopy Instruments Industry Volume (K Unit), by Application 2024 & 2032
- Figure 85: South America Arthroscopy Instruments Industry Revenue Share (%), by Application 2024 & 2032
- Figure 86: South America Arthroscopy Instruments Industry Volume Share (%), by Application 2024 & 2032
- Figure 87: South America Arthroscopy Instruments Industry Revenue (Million), by Product 2024 & 2032
- Figure 88: South America Arthroscopy Instruments Industry Volume (K Unit), by Product 2024 & 2032
- Figure 89: South America Arthroscopy Instruments Industry Revenue Share (%), by Product 2024 & 2032
- Figure 90: South America Arthroscopy Instruments Industry Volume Share (%), by Product 2024 & 2032
- Figure 91: South America Arthroscopy Instruments Industry Revenue (Million), by Country 2024 & 2032
- Figure 92: South America Arthroscopy Instruments Industry Volume (K Unit), by Country 2024 & 2032
- Figure 93: South America Arthroscopy Instruments Industry Revenue Share (%), by Country 2024 & 2032
- Figure 94: South America Arthroscopy Instruments Industry Volume Share (%), by Country 2024 & 2032
List of Tables
- Table 1: Global Arthroscopy Instruments Industry Revenue Million Forecast, by Region 2019 & 2032
- Table 2: Global Arthroscopy Instruments Industry Volume K Unit Forecast, by Region 2019 & 2032
- Table 3: Global Arthroscopy Instruments Industry Revenue Million Forecast, by Application 2019 & 2032
- Table 4: Global Arthroscopy Instruments Industry Volume K Unit Forecast, by Application 2019 & 2032
- Table 5: Global Arthroscopy Instruments Industry Revenue Million Forecast, by Product 2019 & 2032
- Table 6: Global Arthroscopy Instruments Industry Volume K Unit Forecast, by Product 2019 & 2032
- Table 7: Global Arthroscopy Instruments Industry Revenue Million Forecast, by Region 2019 & 2032
- Table 8: Global Arthroscopy Instruments Industry Volume K Unit Forecast, by Region 2019 & 2032
- Table 9: Global Arthroscopy Instruments Industry Revenue Million Forecast, by Country 2019 & 2032
- Table 10: Global Arthroscopy Instruments Industry Volume K Unit Forecast, by Country 2019 & 2032
- Table 11: Global Arthroscopy Instruments Industry Revenue Million Forecast, by Country 2019 & 2032
- Table 12: Global Arthroscopy Instruments Industry Volume K Unit Forecast, by Country 2019 & 2032
- Table 13: Global Arthroscopy Instruments Industry Revenue Million Forecast, by Country 2019 & 2032
- Table 14: Global Arthroscopy Instruments Industry Volume K Unit Forecast, by Country 2019 & 2032
- Table 15: Global Arthroscopy Instruments Industry Revenue Million Forecast, by Country 2019 & 2032
- Table 16: Global Arthroscopy Instruments Industry Volume K Unit Forecast, by Country 2019 & 2032
- Table 17: Global Arthroscopy Instruments Industry Revenue Million Forecast, by Country 2019 & 2032
- Table 18: Global Arthroscopy Instruments Industry Volume K Unit Forecast, by Country 2019 & 2032
- Table 19: Global Arthroscopy Instruments Industry Revenue Million Forecast, by Application 2019 & 2032
- Table 20: Global Arthroscopy Instruments Industry Volume K Unit Forecast, by Application 2019 & 2032
- Table 21: Global Arthroscopy Instruments Industry Revenue Million Forecast, by Product 2019 & 2032
- Table 22: Global Arthroscopy Instruments Industry Volume K Unit Forecast, by Product 2019 & 2032
- Table 23: Global Arthroscopy Instruments Industry Revenue Million Forecast, by Country 2019 & 2032
- Table 24: Global Arthroscopy Instruments Industry Volume K Unit Forecast, by Country 2019 & 2032
- Table 25: United States Arthroscopy Instruments Industry Revenue (Million) Forecast, by Application 2019 & 2032
- Table 26: United States Arthroscopy Instruments Industry Volume (K Unit) Forecast, by Application 2019 & 2032
- Table 27: Canada Arthroscopy Instruments Industry Revenue (Million) Forecast, by Application 2019 & 2032
- Table 28: Canada Arthroscopy Instruments Industry Volume (K Unit) Forecast, by Application 2019 & 2032
- Table 29: Mexico Arthroscopy Instruments Industry Revenue (Million) Forecast, by Application 2019 & 2032
- Table 30: Mexico Arthroscopy Instruments Industry Volume (K Unit) Forecast, by Application 2019 & 2032
- Table 31: Global Arthroscopy Instruments Industry Revenue Million Forecast, by Application 2019 & 2032
- Table 32: Global Arthroscopy Instruments Industry Volume K Unit Forecast, by Application 2019 & 2032
- Table 33: Global Arthroscopy Instruments Industry Revenue Million Forecast, by Product 2019 & 2032
- Table 34: Global Arthroscopy Instruments Industry Volume K Unit Forecast, by Product 2019 & 2032
- Table 35: Global Arthroscopy Instruments Industry Revenue Million Forecast, by Country 2019 & 2032
- Table 36: Global Arthroscopy Instruments Industry Volume K Unit Forecast, by Country 2019 & 2032
- Table 37: Germany Arthroscopy Instruments Industry Revenue (Million) Forecast, by Application 2019 & 2032
- Table 38: Germany Arthroscopy Instruments Industry Volume (K Unit) Forecast, by Application 2019 & 2032
- Table 39: United Kingdom Arthroscopy Instruments Industry Revenue (Million) Forecast, by Application 2019 & 2032
- Table 40: United Kingdom Arthroscopy Instruments Industry Volume (K Unit) Forecast, by Application 2019 & 2032
- Table 41: France Arthroscopy Instruments Industry Revenue (Million) Forecast, by Application 2019 & 2032
- Table 42: France Arthroscopy Instruments Industry Volume (K Unit) Forecast, by Application 2019 & 2032
- Table 43: Italy Arthroscopy Instruments Industry Revenue (Million) Forecast, by Application 2019 & 2032
- Table 44: Italy Arthroscopy Instruments Industry Volume (K Unit) Forecast, by Application 2019 & 2032
- Table 45: Spain Arthroscopy Instruments Industry Revenue (Million) Forecast, by Application 2019 & 2032
- Table 46: Spain Arthroscopy Instruments Industry Volume (K Unit) Forecast, by Application 2019 & 2032
- Table 47: Rest of Europe Arthroscopy Instruments Industry Revenue (Million) Forecast, by Application 2019 & 2032
- Table 48: Rest of Europe Arthroscopy Instruments Industry Volume (K Unit) Forecast, by Application 2019 & 2032
- Table 49: Global Arthroscopy Instruments Industry Revenue Million Forecast, by Application 2019 & 2032
- Table 50: Global Arthroscopy Instruments Industry Volume K Unit Forecast, by Application 2019 & 2032
- Table 51: Global Arthroscopy Instruments Industry Revenue Million Forecast, by Product 2019 & 2032
- Table 52: Global Arthroscopy Instruments Industry Volume K Unit Forecast, by Product 2019 & 2032
- Table 53: Global Arthroscopy Instruments Industry Revenue Million Forecast, by Country 2019 & 2032
- Table 54: Global Arthroscopy Instruments Industry Volume K Unit Forecast, by Country 2019 & 2032
- Table 55: China Arthroscopy Instruments Industry Revenue (Million) Forecast, by Application 2019 & 2032
- Table 56: China Arthroscopy Instruments Industry Volume (K Unit) Forecast, by Application 2019 & 2032
- Table 57: Japan Arthroscopy Instruments Industry Revenue (Million) Forecast, by Application 2019 & 2032
- Table 58: Japan Arthroscopy Instruments Industry Volume (K Unit) Forecast, by Application 2019 & 2032
- Table 59: India Arthroscopy Instruments Industry Revenue (Million) Forecast, by Application 2019 & 2032
- Table 60: India Arthroscopy Instruments Industry Volume (K Unit) Forecast, by Application 2019 & 2032
- Table 61: Australia Arthroscopy Instruments Industry Revenue (Million) Forecast, by Application 2019 & 2032
- Table 62: Australia Arthroscopy Instruments Industry Volume (K Unit) Forecast, by Application 2019 & 2032
- Table 63: South korea Arthroscopy Instruments Industry Revenue (Million) Forecast, by Application 2019 & 2032
- Table 64: South korea Arthroscopy Instruments Industry Volume (K Unit) Forecast, by Application 2019 & 2032
- Table 65: Rest of Asia Pacific Arthroscopy Instruments Industry Revenue (Million) Forecast, by Application 2019 & 2032
- Table 66: Rest of Asia Pacific Arthroscopy Instruments Industry Volume (K Unit) Forecast, by Application 2019 & 2032
- Table 67: Global Arthroscopy Instruments Industry Revenue Million Forecast, by Application 2019 & 2032
- Table 68: Global Arthroscopy Instruments Industry Volume K Unit Forecast, by Application 2019 & 2032
- Table 69: Global Arthroscopy Instruments Industry Revenue Million Forecast, by Product 2019 & 2032
- Table 70: Global Arthroscopy Instruments Industry Volume K Unit Forecast, by Product 2019 & 2032
- Table 71: Global Arthroscopy Instruments Industry Revenue Million Forecast, by Country 2019 & 2032
- Table 72: Global Arthroscopy Instruments Industry Volume K Unit Forecast, by Country 2019 & 2032
- Table 73: Global Arthroscopy Instruments Industry Revenue Million Forecast, by Application 2019 & 2032
- Table 74: Global Arthroscopy Instruments Industry Volume K Unit Forecast, by Application 2019 & 2032
- Table 75: Global Arthroscopy Instruments Industry Revenue Million Forecast, by Product 2019 & 2032
- Table 76: Global Arthroscopy Instruments Industry Volume K Unit Forecast, by Product 2019 & 2032
- Table 77: Global Arthroscopy Instruments Industry Revenue Million Forecast, by Country 2019 & 2032
- Table 78: Global Arthroscopy Instruments Industry Volume K Unit Forecast, by Country 2019 & 2032
- Table 79: South Africa Arthroscopy Instruments Industry Revenue (Million) Forecast, by Application 2019 & 2032
- Table 80: South Africa Arthroscopy Instruments Industry Volume (K Unit) Forecast, by Application 2019 & 2032
- Table 81: Rest of Middle East Arthroscopy Instruments Industry Revenue (Million) Forecast, by Application 2019 & 2032
- Table 82: Rest of Middle East Arthroscopy Instruments Industry Volume (K Unit) Forecast, by Application 2019 & 2032
- Table 83: Global Arthroscopy Instruments Industry Revenue Million Forecast, by Application 2019 & 2032
- Table 84: Global Arthroscopy Instruments Industry Volume K Unit Forecast, by Application 2019 & 2032
- Table 85: Global Arthroscopy Instruments Industry Revenue Million Forecast, by Product 2019 & 2032
- Table 86: Global Arthroscopy Instruments Industry Volume K Unit Forecast, by Product 2019 & 2032
- Table 87: Global Arthroscopy Instruments Industry Revenue Million Forecast, by Country 2019 & 2032
- Table 88: Global Arthroscopy Instruments Industry Volume K Unit Forecast, by Country 2019 & 2032
- Table 89: Brazil Arthroscopy Instruments Industry Revenue (Million) Forecast, by Application 2019 & 2032
- Table 90: Brazil Arthroscopy Instruments Industry Volume (K Unit) Forecast, by Application 2019 & 2032
- Table 91: Argentina Arthroscopy Instruments Industry Revenue (Million) Forecast, by Application 2019 & 2032
- Table 92: Argentina Arthroscopy Instruments Industry Volume (K Unit) Forecast, by Application 2019 & 2032
- Table 93: Rest of South America Arthroscopy Instruments Industry Revenue (Million) Forecast, by Application 2019 & 2032
- Table 94: Rest of South America Arthroscopy Instruments Industry Volume (K Unit) Forecast, by Application 2019 & 2032
Frequently Asked Questions
1. What is the projected Compound Annual Growth Rate (CAGR) of the Arthroscopy Instruments Industry?
The projected CAGR is approximately 5.69%.
2. Which companies are prominent players in the Arthroscopy Instruments Industry?
Key companies in the market include Smith & Nephew PLC, Arthrex Inc, Medtronic PLC, Richard Wolf GmbH, Stryker Corporation, Karl Storz GmbH & Co KG, Conmed Corporation, Johnson & Johnson.
3. What are the main segments of the Arthroscopy Instruments Industry?
The market segments include Application, Product.
4. Can you provide details about the market size?
The market size is estimated to be USD 1.65 Million as of 2022.
5. What are some drivers contributing to market growth?
Increasing Incidences of Sports Injuries; Rising Geriatric Population; Technological Advancements in Arthroscopic Implants.
6. What are the notable trends driving market growth?
Knee Arthroscopy Segment is Expected to Witness Growth Over the Forecast Period.
7. Are there any restraints impacting market growth?
Lack of Skilled Surgeons; Stringent Regulatory Requirements; High Cost of Arthroscopy Devices.
8. Can you provide examples of recent developments in the market?
In February 2022, Formus Labs raised USD 5 million and struck a partnership with Zimmer Biomet for the co-development and global distribution of its technology.
9. What pricing options are available for accessing the report?
Pricing options include single-user, multi-user, and enterprise licenses priced at USD 4750, USD 5250, and USD 8750 respectively.
10. Is the market size provided in terms of value or volume?
The market size is provided in terms of value, measured in Million and volume, measured in K Unit.
11. Are there any specific market keywords associated with the report?
Yes, the market keyword associated with the report is "Arthroscopy Instruments Industry," which aids in identifying and referencing the specific market segment covered.
12. How do I determine which pricing option suits my needs best?
The pricing options vary based on user requirements and access needs. Individual users may opt for single-user licenses, while businesses requiring broader access may choose multi-user or enterprise licenses for cost-effective access to the report.
13. Are there any additional resources or data provided in the Arthroscopy Instruments Industry report?
While the report offers comprehensive insights, it's advisable to review the specific contents or supplementary materials provided to ascertain if additional resources or data are available.
14. How can I stay updated on further developments or reports in the Arthroscopy Instruments Industry?
To stay informed about further developments, trends, and reports in the Arthroscopy Instruments Industry, consider subscribing to industry newsletters, following relevant companies and organizations, or regularly checking reputable industry news sources and publications.
Methodology
Step 1 - Identification of Relevant Samples Size from Population Database


Step 2 - Approaches for Defining Global Market Size (Value, Volume* & Price*)

Note*: In applicable scenarios
Step 3 - Data Sources
Primary Research
- Web Analytics
- Survey Reports
- Research Institute
- Latest Research Reports
- Opinion Leaders
Secondary Research
- Annual Reports
- White Paper
- Latest Press Release
- Industry Association
- Paid Database
- Investor Presentations

Step 4 - Data Triangulation
Involves using different sources of information in order to increase the validity of a study
These sources are likely to be stakeholders in a program - participants, other researchers, program staff, other community members, and so on.
Then we put all data in single framework & apply various statistical tools to find out the dynamic on the market.
During the analysis stage, feedback from the stakeholder groups would be compared to determine areas of agreement as well as areas of divergence


