

Key Insights
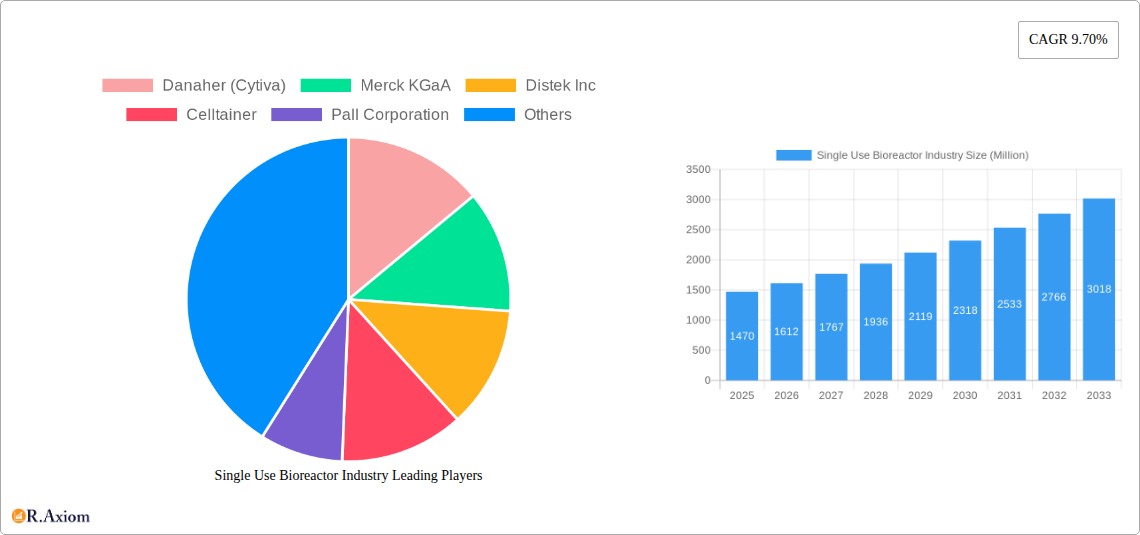
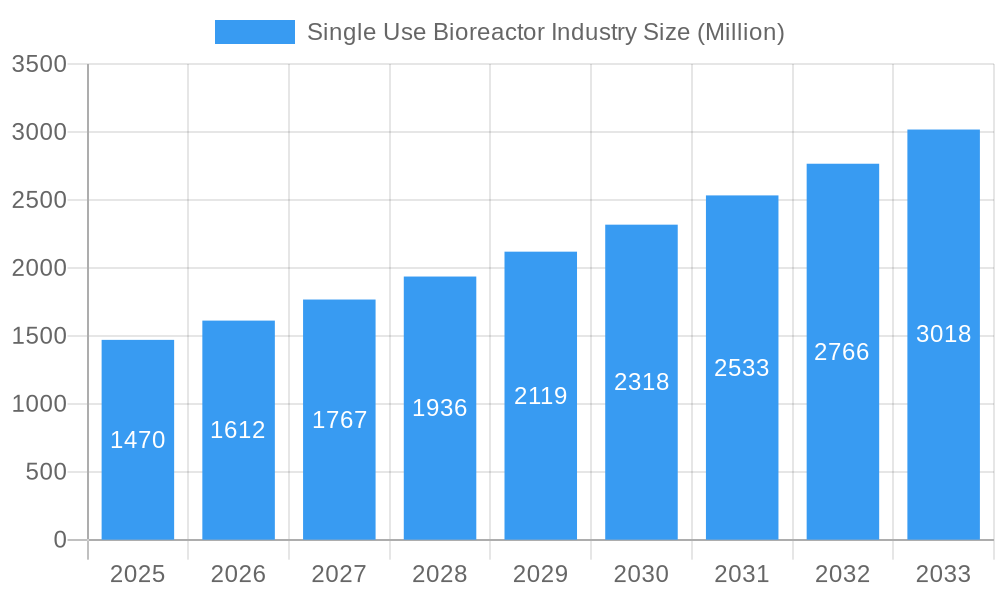
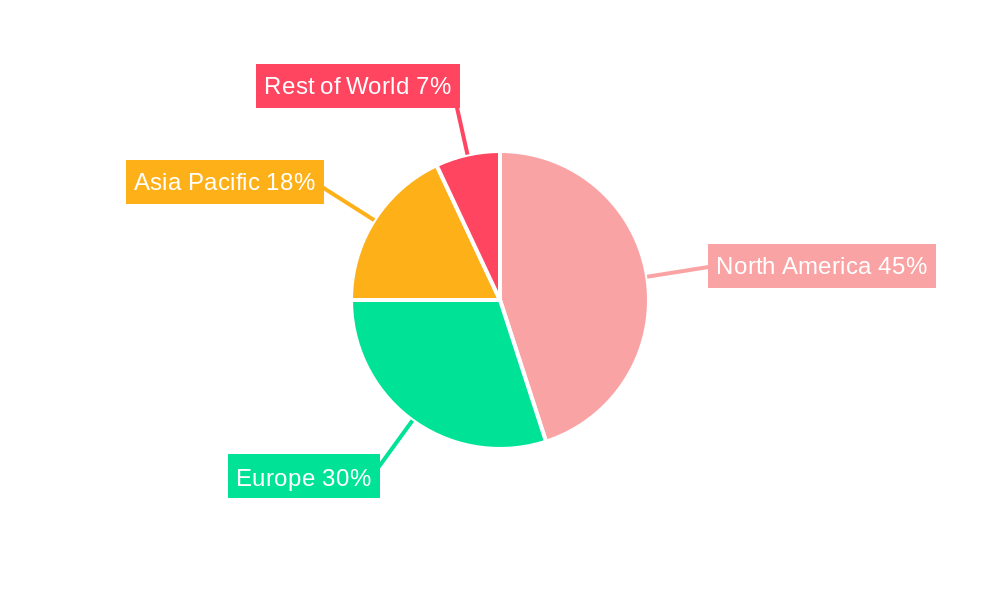
The single-use bioreactor market, valued at $1.47 billion in 2025, is experiencing robust growth, projected to expand at a compound annual growth rate (CAGR) of 9.70% from 2025 to 2033. This significant expansion is driven by several key factors. The increasing demand for biologics, particularly monoclonal antibodies and vaccines, fuels the need for efficient and cost-effective bioprocessing solutions. Single-use bioreactors offer advantages over traditional stainless steel systems, including reduced cleaning validation costs, faster turnaround times, and lower risk of cross-contamination. Furthermore, the rising adoption of cell-based therapies and personalized medicine is further bolstering market growth. Technological advancements in bioreactor design, such as improved sensors and control systems, are also contributing to the market's expansion. The pharmaceutical and biopharmaceutical industries, along with contract research organizations (CROs), are the primary end-users, driving the demand for these systems across various segments including mammalian cell, bacteria, and yeast cultures for diverse molecule types. The market is geographically diverse, with North America currently holding a dominant share, followed by Europe and Asia-Pacific, each exhibiting substantial growth potential.
Single Use Bioreactor Industry Market Size (In Billion)
The market segmentation reveals significant opportunities within specific product types. Media bags and filtration assemblies are experiencing high demand, driven by their crucial role in maintaining sterility and efficient processing. Similarly, the mammalian cell segment dominates the cell type category due to its prevalent use in biopharmaceutical production. Within molecule types, vaccines and monoclonal antibodies represent significant portions of the market, reflecting the high demand for these therapeutic agents. The market's future growth trajectory depends heavily on sustained investment in biopharmaceutical research and development, regulatory approvals for novel biologics, and continuous advancements in single-use bioreactor technology. Competition among major players like Danaher (Cytiva), Merck KGaA, and Thermo Fisher Scientific is intensifying, leading to innovations and enhanced product offerings that cater to the evolving needs of the industry.
Single Use Bioreactor Industry Company Market Share
This comprehensive report provides an in-depth analysis of the Single Use Bioreactor industry, covering market size, growth drivers, challenges, and opportunities from 2019 to 2033. The report segments the market by product type, cell type, molecule type, and end-user, offering a granular view of the competitive landscape and future trends. With a base year of 2025 and a forecast period of 2025-2033, this report is an essential resource for industry stakeholders, investors, and researchers seeking actionable insights into this dynamic market. The report includes detailed profiles of key players such as Danaher (Cytiva), Merck KGaA, Distek Inc, Celltainer, Pall Corporation, Eppendorf SE, Sartorius AG, Thermo Fisher Scientific, OmniBRx Biotechnologies, and ABEC. The report's value exceeds $xx Million.
Single Use Bioreactor Industry Market Concentration & Innovation
The single-use bioreactor market exhibits a moderately concentrated structure, with several large players holding significant market share. Danaher (Cytiva), Sartorius AG, and Thermo Fisher Scientific are among the dominant players, collectively accounting for an estimated xx% of the global market in 2024. However, smaller specialized companies and emerging players are also contributing significantly to innovation and market growth.
Innovation Drivers:
- Advancements in bioprocess technology, leading to improved efficiency and scalability of single-use bioreactors.
- Growing demand for flexible manufacturing solutions to accommodate diverse therapeutic modalities.
- Increasing adoption of single-use systems to reduce contamination risk and improve product quality.
Regulatory Frameworks:
Stringent regulatory requirements, particularly regarding Good Manufacturing Practices (GMP) compliance, influence the design, manufacturing, and validation of single-use bioreactors.
Product Substitutes:
Traditional stainless steel bioreactors remain a viable alternative, but single-use systems are gaining traction due to advantages in cost-effectiveness and flexibility.
End-User Trends:
The increasing adoption of single-use systems by pharmaceutical and biopharmaceutical companies, Contract Research Organizations (CROs), and Contract Development and Manufacturing Organizations (CDMOs) is a key market driver.
M&A Activities:
The industry has witnessed significant M&A activity in recent years, with larger companies acquiring smaller players to expand their product portfolios and market reach. The total value of M&A deals in the single-use bioreactor market from 2019 to 2024 is estimated at $xx Million. The average deal size was approximately $xx Million.
Single Use Bioreactor Industry Industry Trends & Insights
The single-use bioreactor market is experiencing robust growth, driven by several key factors. The market is projected to exhibit a Compound Annual Growth Rate (CAGR) of xx% during the forecast period (2025-2033), reaching a market value of $xx Million by 2033. This growth is fueled by the increasing demand for biologics, the rising adoption of single-use technologies in biopharmaceutical manufacturing, and continuous innovation in bioreactor design and functionality. Technological advancements such as the development of larger-capacity bioreactors, improved sensors for real-time monitoring, and automated systems are further propelling market expansion. The market penetration of single-use bioreactors is expected to increase from xx% in 2024 to xx% by 2033. Increased investment in R&D by major market players and the entry of new entrants are strengthening the competitive landscape. Consumer preferences are shifting towards single-use bioreactors due to their ease of use, reduced cleaning validation requirements, and minimized risk of cross-contamination.
Dominant Markets & Segments in Single Use Bioreactor Industry
Leading Region/Country: North America currently holds the largest market share, driven by the presence of major pharmaceutical and biotechnology companies, robust R&D investments, and favorable regulatory environments. Europe and Asia Pacific are also significant markets, exhibiting strong growth potential.
Dominant Segments:
- Product Type: Single-use bioreactor systems account for the largest share of the market due to their versatility and suitability for various applications. Media bags and filtration assemblies are also experiencing significant demand.
- Cell Type: Mammalian cell cultures dominate the market due to their high-yield potential in the production of biologics. Bacterial and yeast cultures remain important for specific applications.
- Molecule Type: Monoclonal antibodies and vaccines represent major segments of the market, driven by the high demand for these products. Recombinant proteins and stem cells are also significant segments.
- End User: Pharmaceutical and biopharmaceutical companies are the largest end-users of single-use bioreactors, followed by contract research organizations (CROs).
Key Drivers for Dominant Segments:
- North America: Strong presence of pharmaceutical and biotech companies, significant R&D investments, stringent regulatory frameworks, and early adoption of new technologies.
- Single-use bioreactor systems: Versatility, cost-effectiveness, reduced cleaning validation, and lower risk of contamination.
- Mammalian cells: High-yield production of complex biopharmaceuticals.
- Monoclonal antibodies and vaccines: High demand for these therapeutic products.
Single Use Bioreactor Industry Product Developments
Recent product innovations focus on enhancing scalability, automation, and process control in single-use bioreactors. New designs incorporate advanced sensors, software integration for real-time monitoring, and improved material compatibility to broaden the range of applications and ensure compatibility with different cell types and biomolecules. These advancements provide competitive advantages by increasing efficiency, productivity, and the quality of the final product. The market is seeing a trend towards larger-scale single-use systems suitable for commercial manufacturing.
Report Scope & Segmentation Analysis
This report comprehensively segments the single-use bioreactor market across various parameters:
Product Type: Single-use bioreactor systems, media bags, filtration assemblies, and other products. Growth projections vary across segments, with single-use bioreactor systems expected to maintain the largest market share.
Cell Type: Mammalian cell, bacteria, yeast, and other cell types. Mammalian cells are projected to remain the dominant segment due to their importance in the production of complex biopharmaceuticals.
Molecule Type: Vaccines, monoclonal antibodies, stem cells, recombinant proteins, and other molecule types. Monoclonal antibodies and vaccines are expected to continue driving market growth.
End User: Pharmaceutical and biopharmaceutical industries, contract research organizations (CROs), and other end users. Pharmaceutical and biopharmaceutical companies are the largest end-users. Market size and competitive dynamics vary across segments.
Key Drivers of Single Use Bioreactor Industry Growth
The single-use bioreactor market is propelled by several key factors: the increasing demand for biologics, the growing adoption of single-use systems in biopharmaceutical manufacturing due to their reduced risk of contamination and increased efficiency, and continuous innovations in bioreactor design and functionality. The rising prevalence of chronic diseases globally and the increasing investments in R&D are further boosting the market. Favorable regulatory environments also promote market growth.
Challenges in the Single Use Bioreactor Industry Sector
Challenges include the high initial cost of investment in single-use systems, potential compatibility issues with certain cell lines and processes, and the need for robust validation procedures to ensure GMP compliance. Supply chain disruptions can also impact the availability of raw materials and finished products. The industry faces intensifying competitive pressures, particularly from established players with significant market share. These factors can affect overall profitability.
Emerging Opportunities in Single Use Bioreactor Industry
Emerging opportunities lie in the development of novel single-use bioreactor designs for advanced cell therapies and personalized medicine, continuous manufacturing processes, and the integration of advanced process analytical technologies (PAT) for enhanced process monitoring and control. Expansion into emerging markets with rising healthcare expenditure and growing demand for biologics presents significant growth potential. The focus on sustainability and the development of eco-friendly bioreactor materials are also emerging trends.
Leading Players in the Single Use Bioreactor Industry Market
- Danaher (Cytiva)
- Merck KGaA
- Distek Inc
- Celltainer
- Pall Corporation
- Eppendorf SE
- Sartorius AG
- Thermo Fisher Scientific
- OmniBRx Biotechnologies
- ABEC
Key Developments in Single Use Bioreactor Industry Industry
- June 2022: mAbxience installed an additional ABEC 4,000L CSR bioreactor at their cGMP facility in León, Spain, expanding their CDMO capabilities.
- May 2022: RD-Biotech partnered with Pall Corporation to leverage single-use solutions for GMP-grade pDNA production.
Strategic Outlook for Single Use Bioreactor Industry Market
The single-use bioreactor market is poised for continued growth, driven by technological advancements, increasing demand for biologics, and the growing adoption of single-use technologies across various sectors. Opportunities exist in the development of innovative bioreactor designs, process optimization, and the expansion into emerging markets. The strategic focus should be on innovation, collaboration, and meeting the evolving needs of the biopharmaceutical industry. The market is projected to reach $xx Million by 2033, presenting significant growth opportunities for established players and new entrants.
Single Use Bioreactor Industry Segmentation
-
1. Type of Product
- 1.1. Single-use Bioreactor Systems
- 1.2. Media Bags
- 1.3. Filtration Assemblies
- 1.4. Other Products
-
2. Cell Type
- 2.1. Mammalian Cell
- 2.2. Bacteria
- 2.3. Yeast
- 2.4. Other Cell Types
-
3. Molecule Type
- 3.1. Vaccines
- 3.2. Monoclonal Antibodies
- 3.3. Stem Cells
- 3.4. Recombinant Proteins
- 3.5. Other Molecule Types
-
4. End User
- 4.1. Pharmaceutical and Biopharmaceutical Industries
- 4.2. Contract Research Organizations (CRO)
- 4.3. Other End Users
Single Use Bioreactor Industry Segmentation By Geography
-
1. North America
- 1.1. United States
- 1.2. Canada
- 1.3. Mexico
-
2. Europe
- 2.1. Germany
- 2.2. United Kingdom
- 2.3. France
- 2.4. Italy
- 2.5. Spain
- 2.6. Rest of Europe
-
3. Asia Pacific
- 3.1. China
- 3.2. Japan
- 3.3. India
- 3.4. Australia
- 3.5. South Korea
- 3.6. Rest of Asia Pacific
-
4. Middle East and Africa
- 4.1. GCC
- 4.2. South Africa
- 4.3. Rest of Middle East and Africa
-
5. South America
- 5.1. Brazil
- 5.2. Argentina
- 5.3. Rest of South America
Single Use Bioreactor Industry Regional Market Share
Geographic Coverage of Single Use Bioreactor Industry
Single Use Bioreactor Industry REPORT HIGHLIGHTS
| Aspects | Details |
|---|---|
| Study Period | 2020-2034 |
| Base Year | 2025 |
| Estimated Year | 2026 |
| Forecast Period | 2026-2034 |
| Historical Period | 2020-2025 |
| Growth Rate | CAGR of 9.70% from 2020-2034 |
| Segmentation |
|
Table of Contents
- 1. Introduction
- 1.1. Research Scope
- 1.2. Market Segmentation
- 1.3. Research Objective
- 1.4. Definitions and Assumptions
- 2. Executive Summary
- 2.1. Market Snapshot
- 3. Market Dynamics
- 3.1. Market Drivers
- 3.2. Market Restrains
- 3.3. Market Trends
- 3.4. Market Opportunities
- 4. Market Factor Analysis
- 4.1. Porters Five Forces
- 4.1.1. Bargaining Power of Suppliers
- 4.1.2. Bargaining Power of Buyers
- 4.1.3. Threat of New Entrants
- 4.1.4. Threat of Substitutes
- 4.1.5. Competitive Rivalry
- 4.2. PESTEL analysis
- 4.3. BCG Analysis
- 4.3.1. Stars (High Growth, High Market Share)
- 4.3.2. Cash Cows (Low Growth, High Market Share)
- 4.3.3. Question Mark (High Growth, Low Market Share)
- 4.3.4. Dogs (Low Growth, Low Market Share)
- 4.4. Ansoff Matrix Analysis
- 4.5. Supply Chain Analysis
- 4.6. Regulatory Landscape
- 4.7. Current Market Potential and Opportunity Assessment (TAM–SAM–SOM Framework)
- 4.8. RAX Analyst Note
- 4.1. Porters Five Forces
- 5. Market Analysis, Insights and Forecast 2021-2033
- 5.1. Market Analysis, Insights and Forecast - by Type of Product
- 5.1.1. Single-use Bioreactor Systems
- 5.1.2. Media Bags
- 5.1.3. Filtration Assemblies
- 5.1.4. Other Products
- 5.2. Market Analysis, Insights and Forecast - by Cell Type
- 5.2.1. Mammalian Cell
- 5.2.2. Bacteria
- 5.2.3. Yeast
- 5.2.4. Other Cell Types
- 5.3. Market Analysis, Insights and Forecast - by Molecule Type
- 5.3.1. Vaccines
- 5.3.2. Monoclonal Antibodies
- 5.3.3. Stem Cells
- 5.3.4. Recombinant Proteins
- 5.3.5. Other Molecule Types
- 5.4. Market Analysis, Insights and Forecast - by End User
- 5.4.1. Pharmaceutical and Biopharmaceutical Industries
- 5.4.2. Contract Research Organizations (CRO)
- 5.4.3. Other End Users
- 5.5. Market Analysis, Insights and Forecast - by Region
- 5.5.1. North America
- 5.5.2. Europe
- 5.5.3. Asia Pacific
- 5.5.4. Middle East and Africa
- 5.5.5. South America
- 5.1. Market Analysis, Insights and Forecast - by Type of Product
- 6. Global Single Use Bioreactor Industry Analysis, Insights and Forecast, 2021-2033
- 6.1. Market Analysis, Insights and Forecast - by Type of Product
- 6.1.1. Single-use Bioreactor Systems
- 6.1.2. Media Bags
- 6.1.3. Filtration Assemblies
- 6.1.4. Other Products
- 6.2. Market Analysis, Insights and Forecast - by Cell Type
- 6.2.1. Mammalian Cell
- 6.2.2. Bacteria
- 6.2.3. Yeast
- 6.2.4. Other Cell Types
- 6.3. Market Analysis, Insights and Forecast - by Molecule Type
- 6.3.1. Vaccines
- 6.3.2. Monoclonal Antibodies
- 6.3.3. Stem Cells
- 6.3.4. Recombinant Proteins
- 6.3.5. Other Molecule Types
- 6.4. Market Analysis, Insights and Forecast - by End User
- 6.4.1. Pharmaceutical and Biopharmaceutical Industries
- 6.4.2. Contract Research Organizations (CRO)
- 6.4.3. Other End Users
- 6.1. Market Analysis, Insights and Forecast - by Type of Product
- 7. North America Single Use Bioreactor Industry Analysis, Insights and Forecast, 2020-2032
- 7.1. Market Analysis, Insights and Forecast - by Type of Product
- 7.1.1. Single-use Bioreactor Systems
- 7.1.2. Media Bags
- 7.1.3. Filtration Assemblies
- 7.1.4. Other Products
- 7.2. Market Analysis, Insights and Forecast - by Cell Type
- 7.2.1. Mammalian Cell
- 7.2.2. Bacteria
- 7.2.3. Yeast
- 7.2.4. Other Cell Types
- 7.3. Market Analysis, Insights and Forecast - by Molecule Type
- 7.3.1. Vaccines
- 7.3.2. Monoclonal Antibodies
- 7.3.3. Stem Cells
- 7.3.4. Recombinant Proteins
- 7.3.5. Other Molecule Types
- 7.4. Market Analysis, Insights and Forecast - by End User
- 7.4.1. Pharmaceutical and Biopharmaceutical Industries
- 7.4.2. Contract Research Organizations (CRO)
- 7.4.3. Other End Users
- 7.1. Market Analysis, Insights and Forecast - by Type of Product
- 8. Europe Single Use Bioreactor Industry Analysis, Insights and Forecast, 2020-2032
- 8.1. Market Analysis, Insights and Forecast - by Type of Product
- 8.1.1. Single-use Bioreactor Systems
- 8.1.2. Media Bags
- 8.1.3. Filtration Assemblies
- 8.1.4. Other Products
- 8.2. Market Analysis, Insights and Forecast - by Cell Type
- 8.2.1. Mammalian Cell
- 8.2.2. Bacteria
- 8.2.3. Yeast
- 8.2.4. Other Cell Types
- 8.3. Market Analysis, Insights and Forecast - by Molecule Type
- 8.3.1. Vaccines
- 8.3.2. Monoclonal Antibodies
- 8.3.3. Stem Cells
- 8.3.4. Recombinant Proteins
- 8.3.5. Other Molecule Types
- 8.4. Market Analysis, Insights and Forecast - by End User
- 8.4.1. Pharmaceutical and Biopharmaceutical Industries
- 8.4.2. Contract Research Organizations (CRO)
- 8.4.3. Other End Users
- 8.1. Market Analysis, Insights and Forecast - by Type of Product
- 9. Asia Pacific Single Use Bioreactor Industry Analysis, Insights and Forecast, 2020-2032
- 9.1. Market Analysis, Insights and Forecast - by Type of Product
- 9.1.1. Single-use Bioreactor Systems
- 9.1.2. Media Bags
- 9.1.3. Filtration Assemblies
- 9.1.4. Other Products
- 9.2. Market Analysis, Insights and Forecast - by Cell Type
- 9.2.1. Mammalian Cell
- 9.2.2. Bacteria
- 9.2.3. Yeast
- 9.2.4. Other Cell Types
- 9.3. Market Analysis, Insights and Forecast - by Molecule Type
- 9.3.1. Vaccines
- 9.3.2. Monoclonal Antibodies
- 9.3.3. Stem Cells
- 9.3.4. Recombinant Proteins
- 9.3.5. Other Molecule Types
- 9.4. Market Analysis, Insights and Forecast - by End User
- 9.4.1. Pharmaceutical and Biopharmaceutical Industries
- 9.4.2. Contract Research Organizations (CRO)
- 9.4.3. Other End Users
- 9.1. Market Analysis, Insights and Forecast - by Type of Product
- 10. Middle East and Africa Single Use Bioreactor Industry Analysis, Insights and Forecast, 2020-2032
- 10.1. Market Analysis, Insights and Forecast - by Type of Product
- 10.1.1. Single-use Bioreactor Systems
- 10.1.2. Media Bags
- 10.1.3. Filtration Assemblies
- 10.1.4. Other Products
- 10.2. Market Analysis, Insights and Forecast - by Cell Type
- 10.2.1. Mammalian Cell
- 10.2.2. Bacteria
- 10.2.3. Yeast
- 10.2.4. Other Cell Types
- 10.3. Market Analysis, Insights and Forecast - by Molecule Type
- 10.3.1. Vaccines
- 10.3.2. Monoclonal Antibodies
- 10.3.3. Stem Cells
- 10.3.4. Recombinant Proteins
- 10.3.5. Other Molecule Types
- 10.4. Market Analysis, Insights and Forecast - by End User
- 10.4.1. Pharmaceutical and Biopharmaceutical Industries
- 10.4.2. Contract Research Organizations (CRO)
- 10.4.3. Other End Users
- 10.1. Market Analysis, Insights and Forecast - by Type of Product
- 11. South America Single Use Bioreactor Industry Analysis, Insights and Forecast, 2020-2032
- 11.1. Market Analysis, Insights and Forecast - by Type of Product
- 11.1.1. Single-use Bioreactor Systems
- 11.1.2. Media Bags
- 11.1.3. Filtration Assemblies
- 11.1.4. Other Products
- 11.2. Market Analysis, Insights and Forecast - by Cell Type
- 11.2.1. Mammalian Cell
- 11.2.2. Bacteria
- 11.2.3. Yeast
- 11.2.4. Other Cell Types
- 11.3. Market Analysis, Insights and Forecast - by Molecule Type
- 11.3.1. Vaccines
- 11.3.2. Monoclonal Antibodies
- 11.3.3. Stem Cells
- 11.3.4. Recombinant Proteins
- 11.3.5. Other Molecule Types
- 11.4. Market Analysis, Insights and Forecast - by End User
- 11.4.1. Pharmaceutical and Biopharmaceutical Industries
- 11.4.2. Contract Research Organizations (CRO)
- 11.4.3. Other End Users
- 11.1. Market Analysis, Insights and Forecast - by Type of Product
- 12. Competitive Analysis
- 12.1. Company Profiles
- 12.1.1 Danaher (Cytiva)
- 12.1.1.1. Company Overview
- 12.1.1.2. Products
- 12.1.1.3. Company Financials
- 12.1.1.4. SWOT Analysis
- 12.1.2 Merck KGaA
- 12.1.2.1. Company Overview
- 12.1.2.2. Products
- 12.1.2.3. Company Financials
- 12.1.2.4. SWOT Analysis
- 12.1.3 Distek Inc
- 12.1.3.1. Company Overview
- 12.1.3.2. Products
- 12.1.3.3. Company Financials
- 12.1.3.4. SWOT Analysis
- 12.1.4 Celltainer
- 12.1.4.1. Company Overview
- 12.1.4.2. Products
- 12.1.4.3. Company Financials
- 12.1.4.4. SWOT Analysis
- 12.1.5 Pall Corporation
- 12.1.5.1. Company Overview
- 12.1.5.2. Products
- 12.1.5.3. Company Financials
- 12.1.5.4. SWOT Analysis
- 12.1.6 Eppendorf SE
- 12.1.6.1. Company Overview
- 12.1.6.2. Products
- 12.1.6.3. Company Financials
- 12.1.6.4. SWOT Analysis
- 12.1.7 Sartorius AG
- 12.1.7.1. Company Overview
- 12.1.7.2. Products
- 12.1.7.3. Company Financials
- 12.1.7.4. SWOT Analysis
- 12.1.8 Thermo Fisher Scientific
- 12.1.8.1. Company Overview
- 12.1.8.2. Products
- 12.1.8.3. Company Financials
- 12.1.8.4. SWOT Analysis
- 12.1.9 OmniBRx Biotechnologies
- 12.1.9.1. Company Overview
- 12.1.9.2. Products
- 12.1.9.3. Company Financials
- 12.1.9.4. SWOT Analysis
- 12.1.10 ABEC
- 12.1.10.1. Company Overview
- 12.1.10.2. Products
- 12.1.10.3. Company Financials
- 12.1.10.4. SWOT Analysis
- 12.1.1 Danaher (Cytiva)
- 12.2. Market Entropy
- 12.2.1 Company's Key Areas Served
- 12.2.2 Recent Developments
- 12.3. Company Market Share Analysis 2025
- 12.3.1 Top 5 Companies Market Share Analysis
- 12.3.2 Top 3 Companies Market Share Analysis
- 12.4. List of Potential Customers
- 13. Research Methodology
List of Figures
- Figure 1: Global Single Use Bioreactor Industry Revenue Breakdown (Million, %) by Region 2025 & 2033
- Figure 2: Global Single Use Bioreactor Industry Volume Breakdown (K Units, %) by Region 2025 & 2033
- Figure 3: North America Single Use Bioreactor Industry Revenue (Million), by Type of Product 2025 & 2033
- Figure 4: North America Single Use Bioreactor Industry Volume (K Units), by Type of Product 2025 & 2033
- Figure 5: North America Single Use Bioreactor Industry Revenue Share (%), by Type of Product 2025 & 2033
- Figure 6: North America Single Use Bioreactor Industry Volume Share (%), by Type of Product 2025 & 2033
- Figure 7: North America Single Use Bioreactor Industry Revenue (Million), by Cell Type 2025 & 2033
- Figure 8: North America Single Use Bioreactor Industry Volume (K Units), by Cell Type 2025 & 2033
- Figure 9: North America Single Use Bioreactor Industry Revenue Share (%), by Cell Type 2025 & 2033
- Figure 10: North America Single Use Bioreactor Industry Volume Share (%), by Cell Type 2025 & 2033
- Figure 11: North America Single Use Bioreactor Industry Revenue (Million), by Molecule Type 2025 & 2033
- Figure 12: North America Single Use Bioreactor Industry Volume (K Units), by Molecule Type 2025 & 2033
- Figure 13: North America Single Use Bioreactor Industry Revenue Share (%), by Molecule Type 2025 & 2033
- Figure 14: North America Single Use Bioreactor Industry Volume Share (%), by Molecule Type 2025 & 2033
- Figure 15: North America Single Use Bioreactor Industry Revenue (Million), by End User 2025 & 2033
- Figure 16: North America Single Use Bioreactor Industry Volume (K Units), by End User 2025 & 2033
- Figure 17: North America Single Use Bioreactor Industry Revenue Share (%), by End User 2025 & 2033
- Figure 18: North America Single Use Bioreactor Industry Volume Share (%), by End User 2025 & 2033
- Figure 19: North America Single Use Bioreactor Industry Revenue (Million), by Country 2025 & 2033
- Figure 20: North America Single Use Bioreactor Industry Volume (K Units), by Country 2025 & 2033
- Figure 21: North America Single Use Bioreactor Industry Revenue Share (%), by Country 2025 & 2033
- Figure 22: North America Single Use Bioreactor Industry Volume Share (%), by Country 2025 & 2033
- Figure 23: Europe Single Use Bioreactor Industry Revenue (Million), by Type of Product 2025 & 2033
- Figure 24: Europe Single Use Bioreactor Industry Volume (K Units), by Type of Product 2025 & 2033
- Figure 25: Europe Single Use Bioreactor Industry Revenue Share (%), by Type of Product 2025 & 2033
- Figure 26: Europe Single Use Bioreactor Industry Volume Share (%), by Type of Product 2025 & 2033
- Figure 27: Europe Single Use Bioreactor Industry Revenue (Million), by Cell Type 2025 & 2033
- Figure 28: Europe Single Use Bioreactor Industry Volume (K Units), by Cell Type 2025 & 2033
- Figure 29: Europe Single Use Bioreactor Industry Revenue Share (%), by Cell Type 2025 & 2033
- Figure 30: Europe Single Use Bioreactor Industry Volume Share (%), by Cell Type 2025 & 2033
- Figure 31: Europe Single Use Bioreactor Industry Revenue (Million), by Molecule Type 2025 & 2033
- Figure 32: Europe Single Use Bioreactor Industry Volume (K Units), by Molecule Type 2025 & 2033
- Figure 33: Europe Single Use Bioreactor Industry Revenue Share (%), by Molecule Type 2025 & 2033
- Figure 34: Europe Single Use Bioreactor Industry Volume Share (%), by Molecule Type 2025 & 2033
- Figure 35: Europe Single Use Bioreactor Industry Revenue (Million), by End User 2025 & 2033
- Figure 36: Europe Single Use Bioreactor Industry Volume (K Units), by End User 2025 & 2033
- Figure 37: Europe Single Use Bioreactor Industry Revenue Share (%), by End User 2025 & 2033
- Figure 38: Europe Single Use Bioreactor Industry Volume Share (%), by End User 2025 & 2033
- Figure 39: Europe Single Use Bioreactor Industry Revenue (Million), by Country 2025 & 2033
- Figure 40: Europe Single Use Bioreactor Industry Volume (K Units), by Country 2025 & 2033
- Figure 41: Europe Single Use Bioreactor Industry Revenue Share (%), by Country 2025 & 2033
- Figure 42: Europe Single Use Bioreactor Industry Volume Share (%), by Country 2025 & 2033
- Figure 43: Asia Pacific Single Use Bioreactor Industry Revenue (Million), by Type of Product 2025 & 2033
- Figure 44: Asia Pacific Single Use Bioreactor Industry Volume (K Units), by Type of Product 2025 & 2033
- Figure 45: Asia Pacific Single Use Bioreactor Industry Revenue Share (%), by Type of Product 2025 & 2033
- Figure 46: Asia Pacific Single Use Bioreactor Industry Volume Share (%), by Type of Product 2025 & 2033
- Figure 47: Asia Pacific Single Use Bioreactor Industry Revenue (Million), by Cell Type 2025 & 2033
- Figure 48: Asia Pacific Single Use Bioreactor Industry Volume (K Units), by Cell Type 2025 & 2033
- Figure 49: Asia Pacific Single Use Bioreactor Industry Revenue Share (%), by Cell Type 2025 & 2033
- Figure 50: Asia Pacific Single Use Bioreactor Industry Volume Share (%), by Cell Type 2025 & 2033
- Figure 51: Asia Pacific Single Use Bioreactor Industry Revenue (Million), by Molecule Type 2025 & 2033
- Figure 52: Asia Pacific Single Use Bioreactor Industry Volume (K Units), by Molecule Type 2025 & 2033
- Figure 53: Asia Pacific Single Use Bioreactor Industry Revenue Share (%), by Molecule Type 2025 & 2033
- Figure 54: Asia Pacific Single Use Bioreactor Industry Volume Share (%), by Molecule Type 2025 & 2033
- Figure 55: Asia Pacific Single Use Bioreactor Industry Revenue (Million), by End User 2025 & 2033
- Figure 56: Asia Pacific Single Use Bioreactor Industry Volume (K Units), by End User 2025 & 2033
- Figure 57: Asia Pacific Single Use Bioreactor Industry Revenue Share (%), by End User 2025 & 2033
- Figure 58: Asia Pacific Single Use Bioreactor Industry Volume Share (%), by End User 2025 & 2033
- Figure 59: Asia Pacific Single Use Bioreactor Industry Revenue (Million), by Country 2025 & 2033
- Figure 60: Asia Pacific Single Use Bioreactor Industry Volume (K Units), by Country 2025 & 2033
- Figure 61: Asia Pacific Single Use Bioreactor Industry Revenue Share (%), by Country 2025 & 2033
- Figure 62: Asia Pacific Single Use Bioreactor Industry Volume Share (%), by Country 2025 & 2033
- Figure 63: Middle East and Africa Single Use Bioreactor Industry Revenue (Million), by Type of Product 2025 & 2033
- Figure 64: Middle East and Africa Single Use Bioreactor Industry Volume (K Units), by Type of Product 2025 & 2033
- Figure 65: Middle East and Africa Single Use Bioreactor Industry Revenue Share (%), by Type of Product 2025 & 2033
- Figure 66: Middle East and Africa Single Use Bioreactor Industry Volume Share (%), by Type of Product 2025 & 2033
- Figure 67: Middle East and Africa Single Use Bioreactor Industry Revenue (Million), by Cell Type 2025 & 2033
- Figure 68: Middle East and Africa Single Use Bioreactor Industry Volume (K Units), by Cell Type 2025 & 2033
- Figure 69: Middle East and Africa Single Use Bioreactor Industry Revenue Share (%), by Cell Type 2025 & 2033
- Figure 70: Middle East and Africa Single Use Bioreactor Industry Volume Share (%), by Cell Type 2025 & 2033
- Figure 71: Middle East and Africa Single Use Bioreactor Industry Revenue (Million), by Molecule Type 2025 & 2033
- Figure 72: Middle East and Africa Single Use Bioreactor Industry Volume (K Units), by Molecule Type 2025 & 2033
- Figure 73: Middle East and Africa Single Use Bioreactor Industry Revenue Share (%), by Molecule Type 2025 & 2033
- Figure 74: Middle East and Africa Single Use Bioreactor Industry Volume Share (%), by Molecule Type 2025 & 2033
- Figure 75: Middle East and Africa Single Use Bioreactor Industry Revenue (Million), by End User 2025 & 2033
- Figure 76: Middle East and Africa Single Use Bioreactor Industry Volume (K Units), by End User 2025 & 2033
- Figure 77: Middle East and Africa Single Use Bioreactor Industry Revenue Share (%), by End User 2025 & 2033
- Figure 78: Middle East and Africa Single Use Bioreactor Industry Volume Share (%), by End User 2025 & 2033
- Figure 79: Middle East and Africa Single Use Bioreactor Industry Revenue (Million), by Country 2025 & 2033
- Figure 80: Middle East and Africa Single Use Bioreactor Industry Volume (K Units), by Country 2025 & 2033
- Figure 81: Middle East and Africa Single Use Bioreactor Industry Revenue Share (%), by Country 2025 & 2033
- Figure 82: Middle East and Africa Single Use Bioreactor Industry Volume Share (%), by Country 2025 & 2033
- Figure 83: South America Single Use Bioreactor Industry Revenue (Million), by Type of Product 2025 & 2033
- Figure 84: South America Single Use Bioreactor Industry Volume (K Units), by Type of Product 2025 & 2033
- Figure 85: South America Single Use Bioreactor Industry Revenue Share (%), by Type of Product 2025 & 2033
- Figure 86: South America Single Use Bioreactor Industry Volume Share (%), by Type of Product 2025 & 2033
- Figure 87: South America Single Use Bioreactor Industry Revenue (Million), by Cell Type 2025 & 2033
- Figure 88: South America Single Use Bioreactor Industry Volume (K Units), by Cell Type 2025 & 2033
- Figure 89: South America Single Use Bioreactor Industry Revenue Share (%), by Cell Type 2025 & 2033
- Figure 90: South America Single Use Bioreactor Industry Volume Share (%), by Cell Type 2025 & 2033
- Figure 91: South America Single Use Bioreactor Industry Revenue (Million), by Molecule Type 2025 & 2033
- Figure 92: South America Single Use Bioreactor Industry Volume (K Units), by Molecule Type 2025 & 2033
- Figure 93: South America Single Use Bioreactor Industry Revenue Share (%), by Molecule Type 2025 & 2033
- Figure 94: South America Single Use Bioreactor Industry Volume Share (%), by Molecule Type 2025 & 2033
- Figure 95: South America Single Use Bioreactor Industry Revenue (Million), by End User 2025 & 2033
- Figure 96: South America Single Use Bioreactor Industry Volume (K Units), by End User 2025 & 2033
- Figure 97: South America Single Use Bioreactor Industry Revenue Share (%), by End User 2025 & 2033
- Figure 98: South America Single Use Bioreactor Industry Volume Share (%), by End User 2025 & 2033
- Figure 99: South America Single Use Bioreactor Industry Revenue (Million), by Country 2025 & 2033
- Figure 100: South America Single Use Bioreactor Industry Volume (K Units), by Country 2025 & 2033
- Figure 101: South America Single Use Bioreactor Industry Revenue Share (%), by Country 2025 & 2033
- Figure 102: South America Single Use Bioreactor Industry Volume Share (%), by Country 2025 & 2033
List of Tables
- Table 1: Global Single Use Bioreactor Industry Revenue Million Forecast, by Type of Product 2020 & 2033
- Table 2: Global Single Use Bioreactor Industry Volume K Units Forecast, by Type of Product 2020 & 2033
- Table 3: Global Single Use Bioreactor Industry Revenue Million Forecast, by Cell Type 2020 & 2033
- Table 4: Global Single Use Bioreactor Industry Volume K Units Forecast, by Cell Type 2020 & 2033
- Table 5: Global Single Use Bioreactor Industry Revenue Million Forecast, by Molecule Type 2020 & 2033
- Table 6: Global Single Use Bioreactor Industry Volume K Units Forecast, by Molecule Type 2020 & 2033
- Table 7: Global Single Use Bioreactor Industry Revenue Million Forecast, by End User 2020 & 2033
- Table 8: Global Single Use Bioreactor Industry Volume K Units Forecast, by End User 2020 & 2033
- Table 9: Global Single Use Bioreactor Industry Revenue Million Forecast, by Region 2020 & 2033
- Table 10: Global Single Use Bioreactor Industry Volume K Units Forecast, by Region 2020 & 2033
- Table 11: Global Single Use Bioreactor Industry Revenue Million Forecast, by Type of Product 2020 & 2033
- Table 12: Global Single Use Bioreactor Industry Volume K Units Forecast, by Type of Product 2020 & 2033
- Table 13: Global Single Use Bioreactor Industry Revenue Million Forecast, by Cell Type 2020 & 2033
- Table 14: Global Single Use Bioreactor Industry Volume K Units Forecast, by Cell Type 2020 & 2033
- Table 15: Global Single Use Bioreactor Industry Revenue Million Forecast, by Molecule Type 2020 & 2033
- Table 16: Global Single Use Bioreactor Industry Volume K Units Forecast, by Molecule Type 2020 & 2033
- Table 17: Global Single Use Bioreactor Industry Revenue Million Forecast, by End User 2020 & 2033
- Table 18: Global Single Use Bioreactor Industry Volume K Units Forecast, by End User 2020 & 2033
- Table 19: Global Single Use Bioreactor Industry Revenue Million Forecast, by Country 2020 & 2033
- Table 20: Global Single Use Bioreactor Industry Volume K Units Forecast, by Country 2020 & 2033
- Table 21: United States Single Use Bioreactor Industry Revenue (Million) Forecast, by Application 2020 & 2033
- Table 22: United States Single Use Bioreactor Industry Volume (K Units) Forecast, by Application 2020 & 2033
- Table 23: Canada Single Use Bioreactor Industry Revenue (Million) Forecast, by Application 2020 & 2033
- Table 24: Canada Single Use Bioreactor Industry Volume (K Units) Forecast, by Application 2020 & 2033
- Table 25: Mexico Single Use Bioreactor Industry Revenue (Million) Forecast, by Application 2020 & 2033
- Table 26: Mexico Single Use Bioreactor Industry Volume (K Units) Forecast, by Application 2020 & 2033
- Table 27: Global Single Use Bioreactor Industry Revenue Million Forecast, by Type of Product 2020 & 2033
- Table 28: Global Single Use Bioreactor Industry Volume K Units Forecast, by Type of Product 2020 & 2033
- Table 29: Global Single Use Bioreactor Industry Revenue Million Forecast, by Cell Type 2020 & 2033
- Table 30: Global Single Use Bioreactor Industry Volume K Units Forecast, by Cell Type 2020 & 2033
- Table 31: Global Single Use Bioreactor Industry Revenue Million Forecast, by Molecule Type 2020 & 2033
- Table 32: Global Single Use Bioreactor Industry Volume K Units Forecast, by Molecule Type 2020 & 2033
- Table 33: Global Single Use Bioreactor Industry Revenue Million Forecast, by End User 2020 & 2033
- Table 34: Global Single Use Bioreactor Industry Volume K Units Forecast, by End User 2020 & 2033
- Table 35: Global Single Use Bioreactor Industry Revenue Million Forecast, by Country 2020 & 2033
- Table 36: Global Single Use Bioreactor Industry Volume K Units Forecast, by Country 2020 & 2033
- Table 37: Germany Single Use Bioreactor Industry Revenue (Million) Forecast, by Application 2020 & 2033
- Table 38: Germany Single Use Bioreactor Industry Volume (K Units) Forecast, by Application 2020 & 2033
- Table 39: United Kingdom Single Use Bioreactor Industry Revenue (Million) Forecast, by Application 2020 & 2033
- Table 40: United Kingdom Single Use Bioreactor Industry Volume (K Units) Forecast, by Application 2020 & 2033
- Table 41: France Single Use Bioreactor Industry Revenue (Million) Forecast, by Application 2020 & 2033
- Table 42: France Single Use Bioreactor Industry Volume (K Units) Forecast, by Application 2020 & 2033
- Table 43: Italy Single Use Bioreactor Industry Revenue (Million) Forecast, by Application 2020 & 2033
- Table 44: Italy Single Use Bioreactor Industry Volume (K Units) Forecast, by Application 2020 & 2033
- Table 45: Spain Single Use Bioreactor Industry Revenue (Million) Forecast, by Application 2020 & 2033
- Table 46: Spain Single Use Bioreactor Industry Volume (K Units) Forecast, by Application 2020 & 2033
- Table 47: Rest of Europe Single Use Bioreactor Industry Revenue (Million) Forecast, by Application 2020 & 2033
- Table 48: Rest of Europe Single Use Bioreactor Industry Volume (K Units) Forecast, by Application 2020 & 2033
- Table 49: Global Single Use Bioreactor Industry Revenue Million Forecast, by Type of Product 2020 & 2033
- Table 50: Global Single Use Bioreactor Industry Volume K Units Forecast, by Type of Product 2020 & 2033
- Table 51: Global Single Use Bioreactor Industry Revenue Million Forecast, by Cell Type 2020 & 2033
- Table 52: Global Single Use Bioreactor Industry Volume K Units Forecast, by Cell Type 2020 & 2033
- Table 53: Global Single Use Bioreactor Industry Revenue Million Forecast, by Molecule Type 2020 & 2033
- Table 54: Global Single Use Bioreactor Industry Volume K Units Forecast, by Molecule Type 2020 & 2033
- Table 55: Global Single Use Bioreactor Industry Revenue Million Forecast, by End User 2020 & 2033
- Table 56: Global Single Use Bioreactor Industry Volume K Units Forecast, by End User 2020 & 2033
- Table 57: Global Single Use Bioreactor Industry Revenue Million Forecast, by Country 2020 & 2033
- Table 58: Global Single Use Bioreactor Industry Volume K Units Forecast, by Country 2020 & 2033
- Table 59: China Single Use Bioreactor Industry Revenue (Million) Forecast, by Application 2020 & 2033
- Table 60: China Single Use Bioreactor Industry Volume (K Units) Forecast, by Application 2020 & 2033
- Table 61: Japan Single Use Bioreactor Industry Revenue (Million) Forecast, by Application 2020 & 2033
- Table 62: Japan Single Use Bioreactor Industry Volume (K Units) Forecast, by Application 2020 & 2033
- Table 63: India Single Use Bioreactor Industry Revenue (Million) Forecast, by Application 2020 & 2033
- Table 64: India Single Use Bioreactor Industry Volume (K Units) Forecast, by Application 2020 & 2033
- Table 65: Australia Single Use Bioreactor Industry Revenue (Million) Forecast, by Application 2020 & 2033
- Table 66: Australia Single Use Bioreactor Industry Volume (K Units) Forecast, by Application 2020 & 2033
- Table 67: South Korea Single Use Bioreactor Industry Revenue (Million) Forecast, by Application 2020 & 2033
- Table 68: South Korea Single Use Bioreactor Industry Volume (K Units) Forecast, by Application 2020 & 2033
- Table 69: Rest of Asia Pacific Single Use Bioreactor Industry Revenue (Million) Forecast, by Application 2020 & 2033
- Table 70: Rest of Asia Pacific Single Use Bioreactor Industry Volume (K Units) Forecast, by Application 2020 & 2033
- Table 71: Global Single Use Bioreactor Industry Revenue Million Forecast, by Type of Product 2020 & 2033
- Table 72: Global Single Use Bioreactor Industry Volume K Units Forecast, by Type of Product 2020 & 2033
- Table 73: Global Single Use Bioreactor Industry Revenue Million Forecast, by Cell Type 2020 & 2033
- Table 74: Global Single Use Bioreactor Industry Volume K Units Forecast, by Cell Type 2020 & 2033
- Table 75: Global Single Use Bioreactor Industry Revenue Million Forecast, by Molecule Type 2020 & 2033
- Table 76: Global Single Use Bioreactor Industry Volume K Units Forecast, by Molecule Type 2020 & 2033
- Table 77: Global Single Use Bioreactor Industry Revenue Million Forecast, by End User 2020 & 2033
- Table 78: Global Single Use Bioreactor Industry Volume K Units Forecast, by End User 2020 & 2033
- Table 79: Global Single Use Bioreactor Industry Revenue Million Forecast, by Country 2020 & 2033
- Table 80: Global Single Use Bioreactor Industry Volume K Units Forecast, by Country 2020 & 2033
- Table 81: GCC Single Use Bioreactor Industry Revenue (Million) Forecast, by Application 2020 & 2033
- Table 82: GCC Single Use Bioreactor Industry Volume (K Units) Forecast, by Application 2020 & 2033
- Table 83: South Africa Single Use Bioreactor Industry Revenue (Million) Forecast, by Application 2020 & 2033
- Table 84: South Africa Single Use Bioreactor Industry Volume (K Units) Forecast, by Application 2020 & 2033
- Table 85: Rest of Middle East and Africa Single Use Bioreactor Industry Revenue (Million) Forecast, by Application 2020 & 2033
- Table 86: Rest of Middle East and Africa Single Use Bioreactor Industry Volume (K Units) Forecast, by Application 2020 & 2033
- Table 87: Global Single Use Bioreactor Industry Revenue Million Forecast, by Type of Product 2020 & 2033
- Table 88: Global Single Use Bioreactor Industry Volume K Units Forecast, by Type of Product 2020 & 2033
- Table 89: Global Single Use Bioreactor Industry Revenue Million Forecast, by Cell Type 2020 & 2033
- Table 90: Global Single Use Bioreactor Industry Volume K Units Forecast, by Cell Type 2020 & 2033
- Table 91: Global Single Use Bioreactor Industry Revenue Million Forecast, by Molecule Type 2020 & 2033
- Table 92: Global Single Use Bioreactor Industry Volume K Units Forecast, by Molecule Type 2020 & 2033
- Table 93: Global Single Use Bioreactor Industry Revenue Million Forecast, by End User 2020 & 2033
- Table 94: Global Single Use Bioreactor Industry Volume K Units Forecast, by End User 2020 & 2033
- Table 95: Global Single Use Bioreactor Industry Revenue Million Forecast, by Country 2020 & 2033
- Table 96: Global Single Use Bioreactor Industry Volume K Units Forecast, by Country 2020 & 2033
- Table 97: Brazil Single Use Bioreactor Industry Revenue (Million) Forecast, by Application 2020 & 2033
- Table 98: Brazil Single Use Bioreactor Industry Volume (K Units) Forecast, by Application 2020 & 2033
- Table 99: Argentina Single Use Bioreactor Industry Revenue (Million) Forecast, by Application 2020 & 2033
- Table 100: Argentina Single Use Bioreactor Industry Volume (K Units) Forecast, by Application 2020 & 2033
- Table 101: Rest of South America Single Use Bioreactor Industry Revenue (Million) Forecast, by Application 2020 & 2033
- Table 102: Rest of South America Single Use Bioreactor Industry Volume (K Units) Forecast, by Application 2020 & 2033
Frequently Asked Questions
1. What is the projected Compound Annual Growth Rate (CAGR) of the Single Use Bioreactor Industry?
The projected CAGR is approximately 9.70%.
2. Which companies are prominent players in the Single Use Bioreactor Industry?
Key companies in the market include Danaher (Cytiva), Merck KGaA, Distek Inc, Celltainer, Pall Corporation, Eppendorf SE, Sartorius AG, Thermo Fisher Scientific, OmniBRx Biotechnologies, ABEC.
3. What are the main segments of the Single Use Bioreactor Industry?
The market segments include Type of Product, Cell Type, Molecule Type, End User.
4. Can you provide details about the market size?
The market size is estimated to be USD 1.47 Million as of 2022.
5. What are some drivers contributing to market growth?
Rapid Adoption of Single-use Technologies (SUTs) by the Industry; Cost Effectiveness and Lower Downtime; New Product Launches.
6. What are the notable trends driving market growth?
Monoclonal Antibodies Segment is Anticipated to Witness Growth.
7. Are there any restraints impacting market growth?
High Regular Recurring Expenses; Issues with Meeting the Standards of Good Manufacturing Practices.
8. Can you provide examples of recent developments in the market?
In June 2022, mAbxience equipped their cGMP (Current Good Manufacturing Practice) facility in León, Spain with an additional ABEC 4,000L CSR bioreactor, following the successful delivery of the first 4,000L CSR bioreactor in 2021. mAbxience selected ABEC's single-use technology to increase its CDMO (contract development and manufacturing organization) business and capacity.
9. What pricing options are available for accessing the report?
Pricing options include single-user, multi-user, and enterprise licenses priced at USD 4750, USD 5250, and USD 8750 respectively.
10. Is the market size provided in terms of value or volume?
The market size is provided in terms of value, measured in Million and volume, measured in K Units.
11. Are there any specific market keywords associated with the report?
Yes, the market keyword associated with the report is "Single Use Bioreactor Industry," which aids in identifying and referencing the specific market segment covered.
12. How do I determine which pricing option suits my needs best?
The pricing options vary based on user requirements and access needs. Individual users may opt for single-user licenses, while businesses requiring broader access may choose multi-user or enterprise licenses for cost-effective access to the report.
13. Are there any additional resources or data provided in the Single Use Bioreactor Industry report?
While the report offers comprehensive insights, it's advisable to review the specific contents or supplementary materials provided to ascertain if additional resources or data are available.
14. How can I stay updated on further developments or reports in the Single Use Bioreactor Industry?
To stay informed about further developments, trends, and reports in the Single Use Bioreactor Industry, consider subscribing to industry newsletters, following relevant companies and organizations, or regularly checking reputable industry news sources and publications.
Methodology
Step 1 - Identification of Relevant Samples Size from Population Database


Step 2 - Approaches for Defining Global Market Size (Value, Volume* & Price*)

Note*: In applicable scenarios
Step 3 - Data Sources
Primary Research
- Web Analytics
- Survey Reports
- Research Institute
- Latest Research Reports
- Opinion Leaders
Secondary Research
- Annual Reports
- White Paper
- Latest Press Release
- Industry Association
- Paid Database
- Investor Presentations

Step 4 - Data Triangulation
Involves using different sources of information in order to increase the validity of a study
These sources are likely to be stakeholders in a program - participants, other researchers, program staff, other community members, and so on.
Then we put all data in single framework & apply various statistical tools to find out the dynamic on the market.
During the analysis stage, feedback from the stakeholder groups would be compared to determine areas of agreement as well as areas of divergence