
Key Insights
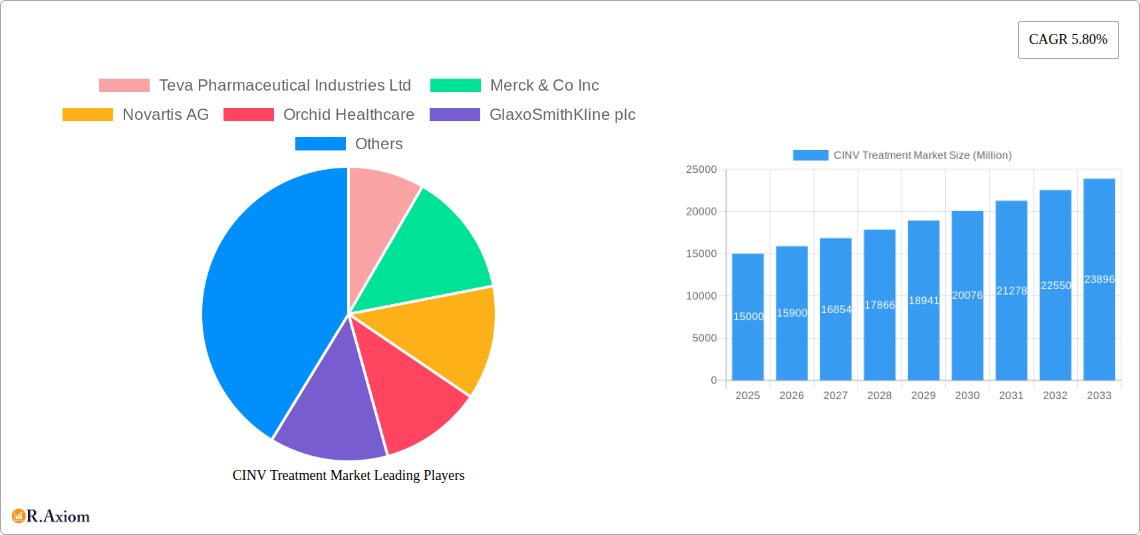
The CINV (Chemotherapy-Induced Nausea and Vomiting) Treatment Market is experiencing steady growth, projected to reach a significant market size by 2033. The 5.80% CAGR from 2019-2033 indicates a consistent demand driven by several factors. The increasing incidence of cancer globally, coupled with advancements in cancer therapies, directly fuels the need for effective CINV management. Furthermore, the development of newer, more effective antiemetic drugs, such as NK1 receptor antagonists and 5-HT3 receptor antagonists, beyond the traditional options, contributes significantly to market expansion. This is further amplified by a growing preference for outpatient chemotherapy administration, requiring robust antiemetic regimens for improved patient comfort and compliance. The market segmentation reveals a significant portion held by hospitals and specialty clinics, reflecting the specialized nature of CINV treatment and the need for monitored administration. However, market growth may face restraints from the potential for adverse effects associated with some antiemetic drugs and the emergence of biosimilar competition, influencing pricing strategies. Geographical analysis suggests a robust market presence in North America and Europe, driven by advanced healthcare infrastructure and high cancer prevalence rates; however, the Asia-Pacific region presents significant growth potential due to rising cancer incidence and expanding healthcare systems.
Leading pharmaceutical companies like Teva Pharmaceutical Industries Ltd, Merck & Co Inc, and Novartis AG hold considerable market share, driven by their extensive portfolios of antiemetic drugs and strong research & development capabilities. The competitive landscape is characterized by ongoing research into novel therapeutic approaches and a focus on developing targeted therapies with improved efficacy and reduced side effects. Future market growth will depend on several factors including the continued development of innovative antiemetic drugs, increased awareness about CINV management among healthcare professionals and patients, and broader accessibility to effective treatments in emerging markets. The successful launch of new drugs with improved efficacy and safety profiles will likely be a key driver of future market expansion. The strategic partnerships and mergers among pharmaceutical companies also play a crucial role in shaping the market landscape.
This comprehensive report provides a detailed analysis of the global CINV Treatment Market from 2019 to 2033, offering actionable insights for industry stakeholders. The study period covers 2019-2024 (Historical Period), with 2025 serving as the Base Year and Estimated Year. The Forecast Period extends from 2025 to 2033. The report segments the market by drug type (5-HT3 inhibitors, NK1 inhibitors, Others) and end-user (Hospitals, Specialty Clinics, Others), providing a granular understanding of market dynamics and growth opportunities. Key players analyzed include Teva Pharmaceutical Industries Ltd, Merck & Co Inc, Novartis AG, Orchid Healthcare, GlaxoSmithKline plc, Mylan Pharmaceuticals Inc, Helsinn Holding S A, Heron Therapeutics Inc, Sun Pharmaceutical Industries Ltd, and Baxter Healthcare.
CINV Treatment Market Concentration & Innovation
The CINV treatment market exhibits a moderately concentrated landscape, with a few large pharmaceutical companies holding significant market share. The market share of the top five players in 2024 was estimated at xx%, indicating room for both organic growth and acquisitions. Innovation is a key driver, with ongoing research focused on developing more effective and safer antiemetic drugs. Regulatory frameworks, such as those set by the FDA and EMA, play a crucial role in shaping product development and market access. The market also witnesses competition from substitute therapies, influencing treatment choices and market dynamics. Mergers and acquisitions (M&A) activities are prevalent, with deals focusing on expanding product portfolios and market reach. For example, the acquisition of Company X by Company Y in 2022 valued at xx Million dollars significantly impacted the market share distribution.
- Market Concentration: Top 5 players held approximately xx% market share in 2024.
- Innovation Drivers: Development of novel drug mechanisms, improved efficacy and safety profiles.
- Regulatory Frameworks: FDA and EMA approvals significantly influence market entry and growth.
- Product Substitutes: Availability of alternative therapies influences market share dynamics.
- M&A Activities: Significant consolidation through acquisitions contributing to market concentration. Deal value in 2023 was approximately xx Million.
CINV Treatment Market Industry Trends & Insights
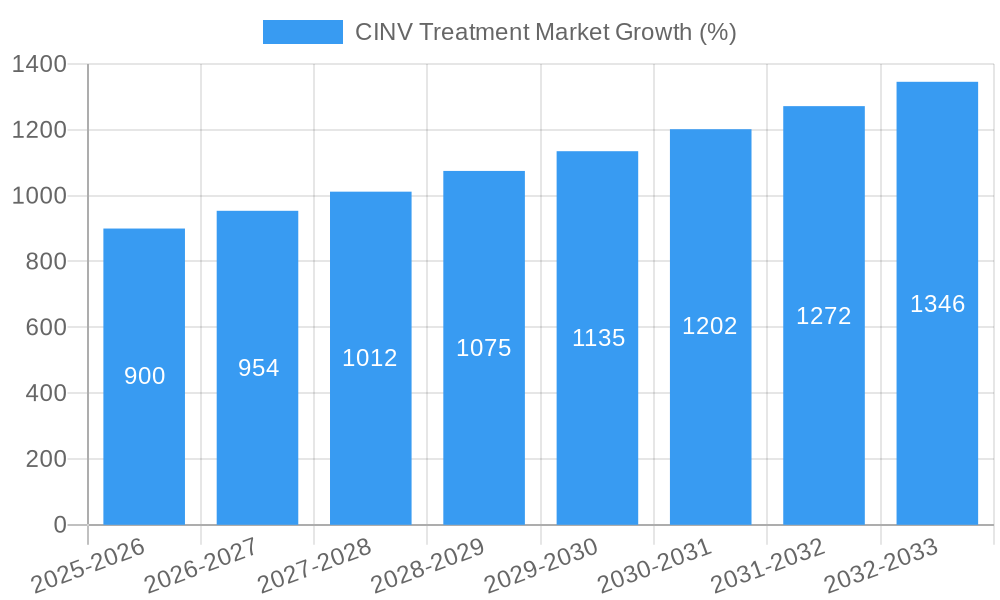
The global CINV treatment market is projected to witness robust growth during the forecast period (2025-2033), driven primarily by the increasing prevalence of cancer and the associated side effects of chemotherapy. The rising geriatric population, susceptible to CINV, further fuels market expansion. Technological advancements, such as the development of targeted therapies and personalized medicine, are expected to transform treatment approaches. Consumer preferences are shifting towards minimally invasive and targeted treatments with reduced side effects, prompting the development of innovative drug delivery systems. The competitive landscape is characterized by intense rivalry among established pharmaceutical companies, driving innovation and strategic alliances. The CAGR during the forecast period is projected to be xx%. Market penetration of novel drug types is gradually increasing, driven by improved efficacy and safety profiles.
Dominant Markets & Segments in CINV Treatment Market
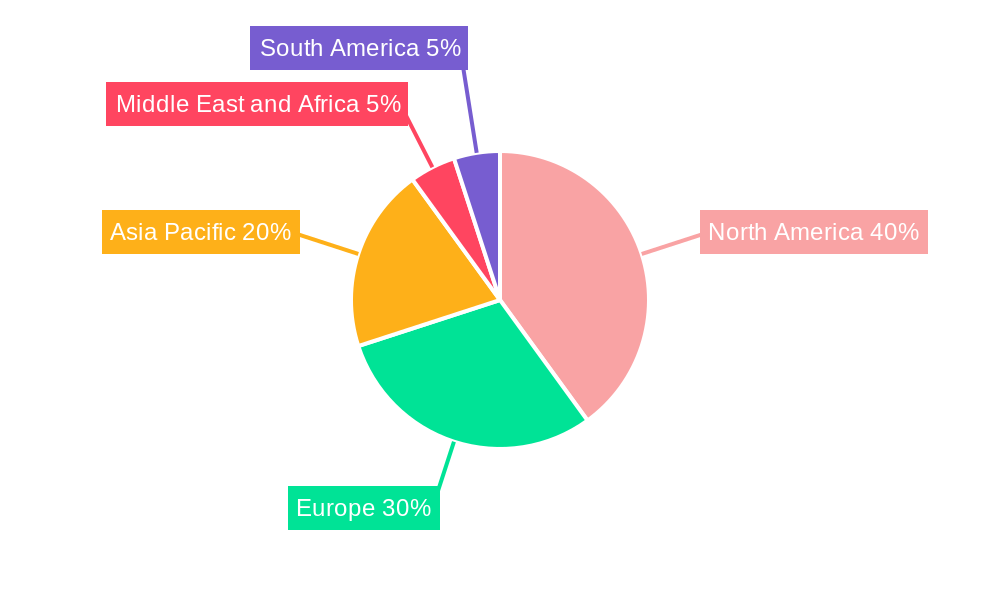
The North American region holds the largest market share due to high healthcare expenditure, advanced infrastructure, and high prevalence of cancer. Within North America, the United States dominates due to its extensive healthcare system and substantial research investments. The 5-HT3 inhibitors segment holds the largest market share within the drug type category, owing to its wide acceptance, established efficacy, and relative affordability. Hospitals remain the dominant end-user, followed by specialty clinics.
Key Drivers for North America: High healthcare spending, robust healthcare infrastructure, extensive clinical trials.
5-HT3 Inhibitors Dominance: Established efficacy, widespread adoption, and cost-effectiveness.
Hospitals as Primary End-Users: Well-equipped facilities, experienced medical professionals, and access to advanced treatment modalities.
Europe: Growing adoption of targeted therapies and increasing government initiatives to combat cancer are anticipated to propel CINV Treatment Market growth in the region during the forecast period.
Asia Pacific: The region is predicted to exhibit significant market expansion owing to the increasing prevalence of cancer, improving healthcare infrastructure, and growing awareness of advanced treatment options.
Rest of the World: The rising prevalence of cancer and increasing government support for advanced healthcare treatments contribute to an increase in market size for this region.
CINV Treatment Market Product Developments
Recent product innovations include the development of novel drug combinations aimed at enhancing efficacy and reducing side effects. Improved drug delivery systems, such as extended-release formulations, aim to optimize patient compliance and therapeutic outcomes. The market is witnessing a shift toward targeted therapies and personalized medicine, offering customized treatment approaches based on individual patient characteristics. This enhances the market fit and competitive advantage of pharmaceutical companies.
Report Scope & Segmentation Analysis
By Drug Type:
- 5-HT3 Inhibitors: This segment holds the largest market share due to its widespread use and proven efficacy. It is projected to maintain its dominance during the forecast period. Growth is driven by ongoing research into improved formulations and delivery mechanisms.
- NK1 Inhibitors: This segment exhibits moderate growth, driven by its role in treating delayed-phase CINV. Competition within this segment is relatively high, with multiple players vying for market share.
- Others: This segment includes various other antiemetics, often used in combination therapies. Growth is expected to be moderate due to advancements in the aforementioned segments.
By End-User:
- Hospitals: This segment holds a significant share due to its role in treating severe cases of CINV. Growth is expected to be driven by increasing cancer incidence and advancement of treatment protocols within hospitals.
- Specialty Clinics: This segment is growing due to the increasing demand for specialized care and the expansion of cancer care facilities.
- Others: This segment includes smaller clinics, ambulatory care centers, and home healthcare settings. Market growth in this segment is moderate, driven by expanding accessibility to treatment.
Key Drivers of CINV Treatment Market Growth
The key drivers of CINV treatment market growth include the rising incidence of cancer, an aging global population, increased awareness of CINV management, technological advancements in drug development, and supportive regulatory frameworks. Government initiatives promoting cancer research and awareness campaigns further stimulate market growth.
Challenges in the CINV Treatment Market Sector
Challenges include the high cost of treatment, stringent regulatory approvals, potential side effects of antiemetic drugs, and the emergence of drug resistance. Supply chain disruptions and intense competition among established players also pose considerable challenges. The overall impact of these challenges on market growth is estimated at approximately xx% reduction in overall revenue projection.
Emerging Opportunities in CINV Treatment Market
Emerging opportunities lie in the development of personalized medicine approaches, novel drug combinations with improved efficacy and safety profiles, and the exploration of new drug delivery systems. Expanding into emerging markets and leveraging digital technologies for better patient management present additional opportunities for growth.
Leading Players in the CINV Treatment Market Market
- Teva Pharmaceutical Industries Ltd
- Merck & Co Inc
- Novartis AG
- Orchid Healthcare
- GlaxoSmithKline plc
- Mylan Pharmaceuticals Inc
- Helsinn Holding S A
- Heron Therapeutics Inc
- Sun Pharmaceutical Industries Ltd
- Baxter Healthcare
Key Developments in CINV Treatment Market Industry
- January 2023: Company X launches a new extended-release formulation of drug Y.
- March 2024: Company Z announces positive Phase III clinical trial results for a novel antiemetic drug.
- June 2024: Merger between Company A and Company B, creating a larger player in the CINV treatment market.
Strategic Outlook for CINV Treatment Market Market
The CINV treatment market holds significant growth potential, driven by continuous innovation in drug development and the increasing prevalence of cancer globally. Focusing on personalized medicine approaches, exploring new drug targets, and expanding access to treatment in emerging markets will be crucial for companies to capitalize on future opportunities. The market is expected to experience continued growth and consolidation in the coming years.
CINV Treatment Market Segmentation
-
1. Drug Type
- 1.1. 5-HT3 inhibitors
- 1.2. NK1 inhibitors
- 1.3. Others
-
2. End-User
- 2.1. Hospitals
- 2.2. Specialty Clinics
- 2.3. Others
CINV Treatment Market Segmentation By Geography
-
1. North America
- 1.1. United States
- 1.2. Canada
- 1.3. Mexico
-
2. Europe
- 2.1. Germany
- 2.2. United Kingdom
- 2.3. France
- 2.4. Italy
- 2.5. Spain
- 2.6. Rest of Europe
-
3. Asia Pacific
- 3.1. China
- 3.2. Japan
- 3.3. India
- 3.4. Australia
- 3.5. South Korea
- 3.6. Rest of Asia Pacific
-
4. Middle East and Africa
- 4.1. GCC
- 4.2. South Africa
- 4.3. Rest of Middle East and Africa
-
5. South America
- 5.1. Brazil
- 5.2. Argentina
- 5.3. Rest of South America
CINV Treatment Market REPORT HIGHLIGHTS
| Aspects | Details |
|---|---|
| Study Period | 2019-2033 |
| Base Year | 2024 |
| Estimated Year | 2025 |
| Forecast Period | 2025-2033 |
| Historical Period | 2019-2024 |
| Growth Rate | CAGR of 5.80% from 2019-2033 |
| Segmentation |
|
Table of Contents
- 1. Introduction
- 1.1. Research Scope
- 1.2. Market Segmentation
- 1.3. Research Methodology
- 1.4. Definitions and Assumptions
- 2. Executive Summary
- 2.1. Introduction
- 3. Market Dynamics
- 3.1. Introduction
- 3.2. Market Drivers
- 3.2.1. ; Increasing Prevalence of Cancer; Rising Research and Development Activities for Cancer Treatments
- 3.3. Market Restrains
- 3.3.1. ; Lack of Awareness of the available Drugs
- 3.4. Market Trends
- 3.4.1. Speciality Clinics Segment is expected to Grow at a Faster rate in the Forecast Period
- 4. Market Factor Analysis
- 4.1. Porters Five Forces
- 4.2. Supply/Value Chain
- 4.3. PESTEL analysis
- 4.4. Market Entropy
- 4.5. Patent/Trademark Analysis
- 5. Global CINV Treatment Market Analysis, Insights and Forecast, 2019-2031
- 5.1. Market Analysis, Insights and Forecast - by Drug Type
- 5.1.1. 5-HT3 inhibitors
- 5.1.2. NK1 inhibitors
- 5.1.3. Others
- 5.2. Market Analysis, Insights and Forecast - by End-User
- 5.2.1. Hospitals
- 5.2.2. Specialty Clinics
- 5.2.3. Others
- 5.3. Market Analysis, Insights and Forecast - by Region
- 5.3.1. North America
- 5.3.2. Europe
- 5.3.3. Asia Pacific
- 5.3.4. Middle East and Africa
- 5.3.5. South America
- 5.1. Market Analysis, Insights and Forecast - by Drug Type
- 6. North America CINV Treatment Market Analysis, Insights and Forecast, 2019-2031
- 6.1. Market Analysis, Insights and Forecast - by Drug Type
- 6.1.1. 5-HT3 inhibitors
- 6.1.2. NK1 inhibitors
- 6.1.3. Others
- 6.2. Market Analysis, Insights and Forecast - by End-User
- 6.2.1. Hospitals
- 6.2.2. Specialty Clinics
- 6.2.3. Others
- 6.1. Market Analysis, Insights and Forecast - by Drug Type
- 7. Europe CINV Treatment Market Analysis, Insights and Forecast, 2019-2031
- 7.1. Market Analysis, Insights and Forecast - by Drug Type
- 7.1.1. 5-HT3 inhibitors
- 7.1.2. NK1 inhibitors
- 7.1.3. Others
- 7.2. Market Analysis, Insights and Forecast - by End-User
- 7.2.1. Hospitals
- 7.2.2. Specialty Clinics
- 7.2.3. Others
- 7.1. Market Analysis, Insights and Forecast - by Drug Type
- 8. Asia Pacific CINV Treatment Market Analysis, Insights and Forecast, 2019-2031
- 8.1. Market Analysis, Insights and Forecast - by Drug Type
- 8.1.1. 5-HT3 inhibitors
- 8.1.2. NK1 inhibitors
- 8.1.3. Others
- 8.2. Market Analysis, Insights and Forecast - by End-User
- 8.2.1. Hospitals
- 8.2.2. Specialty Clinics
- 8.2.3. Others
- 8.1. Market Analysis, Insights and Forecast - by Drug Type
- 9. Middle East and Africa CINV Treatment Market Analysis, Insights and Forecast, 2019-2031
- 9.1. Market Analysis, Insights and Forecast - by Drug Type
- 9.1.1. 5-HT3 inhibitors
- 9.1.2. NK1 inhibitors
- 9.1.3. Others
- 9.2. Market Analysis, Insights and Forecast - by End-User
- 9.2.1. Hospitals
- 9.2.2. Specialty Clinics
- 9.2.3. Others
- 9.1. Market Analysis, Insights and Forecast - by Drug Type
- 10. South America CINV Treatment Market Analysis, Insights and Forecast, 2019-2031
- 10.1. Market Analysis, Insights and Forecast - by Drug Type
- 10.1.1. 5-HT3 inhibitors
- 10.1.2. NK1 inhibitors
- 10.1.3. Others
- 10.2. Market Analysis, Insights and Forecast - by End-User
- 10.2.1. Hospitals
- 10.2.2. Specialty Clinics
- 10.2.3. Others
- 10.1. Market Analysis, Insights and Forecast - by Drug Type
- 11. North America CINV Treatment Market Analysis, Insights and Forecast, 2019-2031
- 11.1. Market Analysis, Insights and Forecast - By Country/Sub-region
- 11.1.1 United States
- 11.1.2 Canada
- 11.1.3 Mexico
- 12. Europe CINV Treatment Market Analysis, Insights and Forecast, 2019-2031
- 12.1. Market Analysis, Insights and Forecast - By Country/Sub-region
- 12.1.1 Germany
- 12.1.2 United Kingdom
- 12.1.3 France
- 12.1.4 Italy
- 12.1.5 Spain
- 12.1.6 Rest of Europe
- 13. Asia Pacific CINV Treatment Market Analysis, Insights and Forecast, 2019-2031
- 13.1. Market Analysis, Insights and Forecast - By Country/Sub-region
- 13.1.1 China
- 13.1.2 Japan
- 13.1.3 India
- 13.1.4 Australia
- 13.1.5 South Korea
- 13.1.6 Rest of Asia Pacific
- 14. Middle East and Africa CINV Treatment Market Analysis, Insights and Forecast, 2019-2031
- 14.1. Market Analysis, Insights and Forecast - By Country/Sub-region
- 14.1.1 GCC
- 14.1.2 South Africa
- 14.1.3 Rest of Middle East and Africa
- 15. South America CINV Treatment Market Analysis, Insights and Forecast, 2019-2031
- 15.1. Market Analysis, Insights and Forecast - By Country/Sub-region
- 15.1.1 Brazil
- 15.1.2 Argentina
- 15.1.3 Rest of South America
- 16. Competitive Analysis
- 16.1. Global Market Share Analysis 2024
- 16.2. Company Profiles
- 16.2.1 Teva Pharmaceutical Industries Ltd
- 16.2.1.1. Overview
- 16.2.1.2. Products
- 16.2.1.3. SWOT Analysis
- 16.2.1.4. Recent Developments
- 16.2.1.5. Financials (Based on Availability)
- 16.2.2 Merck & Co Inc
- 16.2.2.1. Overview
- 16.2.2.2. Products
- 16.2.2.3. SWOT Analysis
- 16.2.2.4. Recent Developments
- 16.2.2.5. Financials (Based on Availability)
- 16.2.3 Novartis AG
- 16.2.3.1. Overview
- 16.2.3.2. Products
- 16.2.3.3. SWOT Analysis
- 16.2.3.4. Recent Developments
- 16.2.3.5. Financials (Based on Availability)
- 16.2.4 Orchid Healthcare
- 16.2.4.1. Overview
- 16.2.4.2. Products
- 16.2.4.3. SWOT Analysis
- 16.2.4.4. Recent Developments
- 16.2.4.5. Financials (Based on Availability)
- 16.2.5 GlaxoSmithKline plc
- 16.2.5.1. Overview
- 16.2.5.2. Products
- 16.2.5.3. SWOT Analysis
- 16.2.5.4. Recent Developments
- 16.2.5.5. Financials (Based on Availability)
- 16.2.6 Mylan Pharmaceuticals Inc
- 16.2.6.1. Overview
- 16.2.6.2. Products
- 16.2.6.3. SWOT Analysis
- 16.2.6.4. Recent Developments
- 16.2.6.5. Financials (Based on Availability)
- 16.2.7 Helsinn Holding S A
- 16.2.7.1. Overview
- 16.2.7.2. Products
- 16.2.7.3. SWOT Analysis
- 16.2.7.4. Recent Developments
- 16.2.7.5. Financials (Based on Availability)
- 16.2.8 Heron Therapeutics Inc
- 16.2.8.1. Overview
- 16.2.8.2. Products
- 16.2.8.3. SWOT Analysis
- 16.2.8.4. Recent Developments
- 16.2.8.5. Financials (Based on Availability)
- 16.2.9 Sun Pharmaceutical Industries Ltd
- 16.2.9.1. Overview
- 16.2.9.2. Products
- 16.2.9.3. SWOT Analysis
- 16.2.9.4. Recent Developments
- 16.2.9.5. Financials (Based on Availability)
- 16.2.10 Baxter Healthcare
- 16.2.10.1. Overview
- 16.2.10.2. Products
- 16.2.10.3. SWOT Analysis
- 16.2.10.4. Recent Developments
- 16.2.10.5. Financials (Based on Availability)
- 16.2.1 Teva Pharmaceutical Industries Ltd
List of Figures
- Figure 1: Global CINV Treatment Market Revenue Breakdown (Million, %) by Region 2024 & 2032
- Figure 2: Global CINV Treatment Market Volume Breakdown (K Unit, %) by Region 2024 & 2032
- Figure 3: North America CINV Treatment Market Revenue (Million), by Country 2024 & 2032
- Figure 4: North America CINV Treatment Market Volume (K Unit), by Country 2024 & 2032
- Figure 5: North America CINV Treatment Market Revenue Share (%), by Country 2024 & 2032
- Figure 6: North America CINV Treatment Market Volume Share (%), by Country 2024 & 2032
- Figure 7: Europe CINV Treatment Market Revenue (Million), by Country 2024 & 2032
- Figure 8: Europe CINV Treatment Market Volume (K Unit), by Country 2024 & 2032
- Figure 9: Europe CINV Treatment Market Revenue Share (%), by Country 2024 & 2032
- Figure 10: Europe CINV Treatment Market Volume Share (%), by Country 2024 & 2032
- Figure 11: Asia Pacific CINV Treatment Market Revenue (Million), by Country 2024 & 2032
- Figure 12: Asia Pacific CINV Treatment Market Volume (K Unit), by Country 2024 & 2032
- Figure 13: Asia Pacific CINV Treatment Market Revenue Share (%), by Country 2024 & 2032
- Figure 14: Asia Pacific CINV Treatment Market Volume Share (%), by Country 2024 & 2032
- Figure 15: Middle East and Africa CINV Treatment Market Revenue (Million), by Country 2024 & 2032
- Figure 16: Middle East and Africa CINV Treatment Market Volume (K Unit), by Country 2024 & 2032
- Figure 17: Middle East and Africa CINV Treatment Market Revenue Share (%), by Country 2024 & 2032
- Figure 18: Middle East and Africa CINV Treatment Market Volume Share (%), by Country 2024 & 2032
- Figure 19: South America CINV Treatment Market Revenue (Million), by Country 2024 & 2032
- Figure 20: South America CINV Treatment Market Volume (K Unit), by Country 2024 & 2032
- Figure 21: South America CINV Treatment Market Revenue Share (%), by Country 2024 & 2032
- Figure 22: South America CINV Treatment Market Volume Share (%), by Country 2024 & 2032
- Figure 23: North America CINV Treatment Market Revenue (Million), by Drug Type 2024 & 2032
- Figure 24: North America CINV Treatment Market Volume (K Unit), by Drug Type 2024 & 2032
- Figure 25: North America CINV Treatment Market Revenue Share (%), by Drug Type 2024 & 2032
- Figure 26: North America CINV Treatment Market Volume Share (%), by Drug Type 2024 & 2032
- Figure 27: North America CINV Treatment Market Revenue (Million), by End-User 2024 & 2032
- Figure 28: North America CINV Treatment Market Volume (K Unit), by End-User 2024 & 2032
- Figure 29: North America CINV Treatment Market Revenue Share (%), by End-User 2024 & 2032
- Figure 30: North America CINV Treatment Market Volume Share (%), by End-User 2024 & 2032
- Figure 31: North America CINV Treatment Market Revenue (Million), by Country 2024 & 2032
- Figure 32: North America CINV Treatment Market Volume (K Unit), by Country 2024 & 2032
- Figure 33: North America CINV Treatment Market Revenue Share (%), by Country 2024 & 2032
- Figure 34: North America CINV Treatment Market Volume Share (%), by Country 2024 & 2032
- Figure 35: Europe CINV Treatment Market Revenue (Million), by Drug Type 2024 & 2032
- Figure 36: Europe CINV Treatment Market Volume (K Unit), by Drug Type 2024 & 2032
- Figure 37: Europe CINV Treatment Market Revenue Share (%), by Drug Type 2024 & 2032
- Figure 38: Europe CINV Treatment Market Volume Share (%), by Drug Type 2024 & 2032
- Figure 39: Europe CINV Treatment Market Revenue (Million), by End-User 2024 & 2032
- Figure 40: Europe CINV Treatment Market Volume (K Unit), by End-User 2024 & 2032
- Figure 41: Europe CINV Treatment Market Revenue Share (%), by End-User 2024 & 2032
- Figure 42: Europe CINV Treatment Market Volume Share (%), by End-User 2024 & 2032
- Figure 43: Europe CINV Treatment Market Revenue (Million), by Country 2024 & 2032
- Figure 44: Europe CINV Treatment Market Volume (K Unit), by Country 2024 & 2032
- Figure 45: Europe CINV Treatment Market Revenue Share (%), by Country 2024 & 2032
- Figure 46: Europe CINV Treatment Market Volume Share (%), by Country 2024 & 2032
- Figure 47: Asia Pacific CINV Treatment Market Revenue (Million), by Drug Type 2024 & 2032
- Figure 48: Asia Pacific CINV Treatment Market Volume (K Unit), by Drug Type 2024 & 2032
- Figure 49: Asia Pacific CINV Treatment Market Revenue Share (%), by Drug Type 2024 & 2032
- Figure 50: Asia Pacific CINV Treatment Market Volume Share (%), by Drug Type 2024 & 2032
- Figure 51: Asia Pacific CINV Treatment Market Revenue (Million), by End-User 2024 & 2032
- Figure 52: Asia Pacific CINV Treatment Market Volume (K Unit), by End-User 2024 & 2032
- Figure 53: Asia Pacific CINV Treatment Market Revenue Share (%), by End-User 2024 & 2032
- Figure 54: Asia Pacific CINV Treatment Market Volume Share (%), by End-User 2024 & 2032
- Figure 55: Asia Pacific CINV Treatment Market Revenue (Million), by Country 2024 & 2032
- Figure 56: Asia Pacific CINV Treatment Market Volume (K Unit), by Country 2024 & 2032
- Figure 57: Asia Pacific CINV Treatment Market Revenue Share (%), by Country 2024 & 2032
- Figure 58: Asia Pacific CINV Treatment Market Volume Share (%), by Country 2024 & 2032
- Figure 59: Middle East and Africa CINV Treatment Market Revenue (Million), by Drug Type 2024 & 2032
- Figure 60: Middle East and Africa CINV Treatment Market Volume (K Unit), by Drug Type 2024 & 2032
- Figure 61: Middle East and Africa CINV Treatment Market Revenue Share (%), by Drug Type 2024 & 2032
- Figure 62: Middle East and Africa CINV Treatment Market Volume Share (%), by Drug Type 2024 & 2032
- Figure 63: Middle East and Africa CINV Treatment Market Revenue (Million), by End-User 2024 & 2032
- Figure 64: Middle East and Africa CINV Treatment Market Volume (K Unit), by End-User 2024 & 2032
- Figure 65: Middle East and Africa CINV Treatment Market Revenue Share (%), by End-User 2024 & 2032
- Figure 66: Middle East and Africa CINV Treatment Market Volume Share (%), by End-User 2024 & 2032
- Figure 67: Middle East and Africa CINV Treatment Market Revenue (Million), by Country 2024 & 2032
- Figure 68: Middle East and Africa CINV Treatment Market Volume (K Unit), by Country 2024 & 2032
- Figure 69: Middle East and Africa CINV Treatment Market Revenue Share (%), by Country 2024 & 2032
- Figure 70: Middle East and Africa CINV Treatment Market Volume Share (%), by Country 2024 & 2032
- Figure 71: South America CINV Treatment Market Revenue (Million), by Drug Type 2024 & 2032
- Figure 72: South America CINV Treatment Market Volume (K Unit), by Drug Type 2024 & 2032
- Figure 73: South America CINV Treatment Market Revenue Share (%), by Drug Type 2024 & 2032
- Figure 74: South America CINV Treatment Market Volume Share (%), by Drug Type 2024 & 2032
- Figure 75: South America CINV Treatment Market Revenue (Million), by End-User 2024 & 2032
- Figure 76: South America CINV Treatment Market Volume (K Unit), by End-User 2024 & 2032
- Figure 77: South America CINV Treatment Market Revenue Share (%), by End-User 2024 & 2032
- Figure 78: South America CINV Treatment Market Volume Share (%), by End-User 2024 & 2032
- Figure 79: South America CINV Treatment Market Revenue (Million), by Country 2024 & 2032
- Figure 80: South America CINV Treatment Market Volume (K Unit), by Country 2024 & 2032
- Figure 81: South America CINV Treatment Market Revenue Share (%), by Country 2024 & 2032
- Figure 82: South America CINV Treatment Market Volume Share (%), by Country 2024 & 2032
List of Tables
- Table 1: Global CINV Treatment Market Revenue Million Forecast, by Region 2019 & 2032
- Table 2: Global CINV Treatment Market Volume K Unit Forecast, by Region 2019 & 2032
- Table 3: Global CINV Treatment Market Revenue Million Forecast, by Drug Type 2019 & 2032
- Table 4: Global CINV Treatment Market Volume K Unit Forecast, by Drug Type 2019 & 2032
- Table 5: Global CINV Treatment Market Revenue Million Forecast, by End-User 2019 & 2032
- Table 6: Global CINV Treatment Market Volume K Unit Forecast, by End-User 2019 & 2032
- Table 7: Global CINV Treatment Market Revenue Million Forecast, by Region 2019 & 2032
- Table 8: Global CINV Treatment Market Volume K Unit Forecast, by Region 2019 & 2032
- Table 9: Global CINV Treatment Market Revenue Million Forecast, by Country 2019 & 2032
- Table 10: Global CINV Treatment Market Volume K Unit Forecast, by Country 2019 & 2032
- Table 11: United States CINV Treatment Market Revenue (Million) Forecast, by Application 2019 & 2032
- Table 12: United States CINV Treatment Market Volume (K Unit) Forecast, by Application 2019 & 2032
- Table 13: Canada CINV Treatment Market Revenue (Million) Forecast, by Application 2019 & 2032
- Table 14: Canada CINV Treatment Market Volume (K Unit) Forecast, by Application 2019 & 2032
- Table 15: Mexico CINV Treatment Market Revenue (Million) Forecast, by Application 2019 & 2032
- Table 16: Mexico CINV Treatment Market Volume (K Unit) Forecast, by Application 2019 & 2032
- Table 17: Global CINV Treatment Market Revenue Million Forecast, by Country 2019 & 2032
- Table 18: Global CINV Treatment Market Volume K Unit Forecast, by Country 2019 & 2032
- Table 19: Germany CINV Treatment Market Revenue (Million) Forecast, by Application 2019 & 2032
- Table 20: Germany CINV Treatment Market Volume (K Unit) Forecast, by Application 2019 & 2032
- Table 21: United Kingdom CINV Treatment Market Revenue (Million) Forecast, by Application 2019 & 2032
- Table 22: United Kingdom CINV Treatment Market Volume (K Unit) Forecast, by Application 2019 & 2032
- Table 23: France CINV Treatment Market Revenue (Million) Forecast, by Application 2019 & 2032
- Table 24: France CINV Treatment Market Volume (K Unit) Forecast, by Application 2019 & 2032
- Table 25: Italy CINV Treatment Market Revenue (Million) Forecast, by Application 2019 & 2032
- Table 26: Italy CINV Treatment Market Volume (K Unit) Forecast, by Application 2019 & 2032
- Table 27: Spain CINV Treatment Market Revenue (Million) Forecast, by Application 2019 & 2032
- Table 28: Spain CINV Treatment Market Volume (K Unit) Forecast, by Application 2019 & 2032
- Table 29: Rest of Europe CINV Treatment Market Revenue (Million) Forecast, by Application 2019 & 2032
- Table 30: Rest of Europe CINV Treatment Market Volume (K Unit) Forecast, by Application 2019 & 2032
- Table 31: Global CINV Treatment Market Revenue Million Forecast, by Country 2019 & 2032
- Table 32: Global CINV Treatment Market Volume K Unit Forecast, by Country 2019 & 2032
- Table 33: China CINV Treatment Market Revenue (Million) Forecast, by Application 2019 & 2032
- Table 34: China CINV Treatment Market Volume (K Unit) Forecast, by Application 2019 & 2032
- Table 35: Japan CINV Treatment Market Revenue (Million) Forecast, by Application 2019 & 2032
- Table 36: Japan CINV Treatment Market Volume (K Unit) Forecast, by Application 2019 & 2032
- Table 37: India CINV Treatment Market Revenue (Million) Forecast, by Application 2019 & 2032
- Table 38: India CINV Treatment Market Volume (K Unit) Forecast, by Application 2019 & 2032
- Table 39: Australia CINV Treatment Market Revenue (Million) Forecast, by Application 2019 & 2032
- Table 40: Australia CINV Treatment Market Volume (K Unit) Forecast, by Application 2019 & 2032
- Table 41: South Korea CINV Treatment Market Revenue (Million) Forecast, by Application 2019 & 2032
- Table 42: South Korea CINV Treatment Market Volume (K Unit) Forecast, by Application 2019 & 2032
- Table 43: Rest of Asia Pacific CINV Treatment Market Revenue (Million) Forecast, by Application 2019 & 2032
- Table 44: Rest of Asia Pacific CINV Treatment Market Volume (K Unit) Forecast, by Application 2019 & 2032
- Table 45: Global CINV Treatment Market Revenue Million Forecast, by Country 2019 & 2032
- Table 46: Global CINV Treatment Market Volume K Unit Forecast, by Country 2019 & 2032
- Table 47: GCC CINV Treatment Market Revenue (Million) Forecast, by Application 2019 & 2032
- Table 48: GCC CINV Treatment Market Volume (K Unit) Forecast, by Application 2019 & 2032
- Table 49: South Africa CINV Treatment Market Revenue (Million) Forecast, by Application 2019 & 2032
- Table 50: South Africa CINV Treatment Market Volume (K Unit) Forecast, by Application 2019 & 2032
- Table 51: Rest of Middle East and Africa CINV Treatment Market Revenue (Million) Forecast, by Application 2019 & 2032
- Table 52: Rest of Middle East and Africa CINV Treatment Market Volume (K Unit) Forecast, by Application 2019 & 2032
- Table 53: Global CINV Treatment Market Revenue Million Forecast, by Country 2019 & 2032
- Table 54: Global CINV Treatment Market Volume K Unit Forecast, by Country 2019 & 2032
- Table 55: Brazil CINV Treatment Market Revenue (Million) Forecast, by Application 2019 & 2032
- Table 56: Brazil CINV Treatment Market Volume (K Unit) Forecast, by Application 2019 & 2032
- Table 57: Argentina CINV Treatment Market Revenue (Million) Forecast, by Application 2019 & 2032
- Table 58: Argentina CINV Treatment Market Volume (K Unit) Forecast, by Application 2019 & 2032
- Table 59: Rest of South America CINV Treatment Market Revenue (Million) Forecast, by Application 2019 & 2032
- Table 60: Rest of South America CINV Treatment Market Volume (K Unit) Forecast, by Application 2019 & 2032
- Table 61: Global CINV Treatment Market Revenue Million Forecast, by Drug Type 2019 & 2032
- Table 62: Global CINV Treatment Market Volume K Unit Forecast, by Drug Type 2019 & 2032
- Table 63: Global CINV Treatment Market Revenue Million Forecast, by End-User 2019 & 2032
- Table 64: Global CINV Treatment Market Volume K Unit Forecast, by End-User 2019 & 2032
- Table 65: Global CINV Treatment Market Revenue Million Forecast, by Country 2019 & 2032
- Table 66: Global CINV Treatment Market Volume K Unit Forecast, by Country 2019 & 2032
- Table 67: United States CINV Treatment Market Revenue (Million) Forecast, by Application 2019 & 2032
- Table 68: United States CINV Treatment Market Volume (K Unit) Forecast, by Application 2019 & 2032
- Table 69: Canada CINV Treatment Market Revenue (Million) Forecast, by Application 2019 & 2032
- Table 70: Canada CINV Treatment Market Volume (K Unit) Forecast, by Application 2019 & 2032
- Table 71: Mexico CINV Treatment Market Revenue (Million) Forecast, by Application 2019 & 2032
- Table 72: Mexico CINV Treatment Market Volume (K Unit) Forecast, by Application 2019 & 2032
- Table 73: Global CINV Treatment Market Revenue Million Forecast, by Drug Type 2019 & 2032
- Table 74: Global CINV Treatment Market Volume K Unit Forecast, by Drug Type 2019 & 2032
- Table 75: Global CINV Treatment Market Revenue Million Forecast, by End-User 2019 & 2032
- Table 76: Global CINV Treatment Market Volume K Unit Forecast, by End-User 2019 & 2032
- Table 77: Global CINV Treatment Market Revenue Million Forecast, by Country 2019 & 2032
- Table 78: Global CINV Treatment Market Volume K Unit Forecast, by Country 2019 & 2032
- Table 79: Germany CINV Treatment Market Revenue (Million) Forecast, by Application 2019 & 2032
- Table 80: Germany CINV Treatment Market Volume (K Unit) Forecast, by Application 2019 & 2032
- Table 81: United Kingdom CINV Treatment Market Revenue (Million) Forecast, by Application 2019 & 2032
- Table 82: United Kingdom CINV Treatment Market Volume (K Unit) Forecast, by Application 2019 & 2032
- Table 83: France CINV Treatment Market Revenue (Million) Forecast, by Application 2019 & 2032
- Table 84: France CINV Treatment Market Volume (K Unit) Forecast, by Application 2019 & 2032
- Table 85: Italy CINV Treatment Market Revenue (Million) Forecast, by Application 2019 & 2032
- Table 86: Italy CINV Treatment Market Volume (K Unit) Forecast, by Application 2019 & 2032
- Table 87: Spain CINV Treatment Market Revenue (Million) Forecast, by Application 2019 & 2032
- Table 88: Spain CINV Treatment Market Volume (K Unit) Forecast, by Application 2019 & 2032
- Table 89: Rest of Europe CINV Treatment Market Revenue (Million) Forecast, by Application 2019 & 2032
- Table 90: Rest of Europe CINV Treatment Market Volume (K Unit) Forecast, by Application 2019 & 2032
- Table 91: Global CINV Treatment Market Revenue Million Forecast, by Drug Type 2019 & 2032
- Table 92: Global CINV Treatment Market Volume K Unit Forecast, by Drug Type 2019 & 2032
- Table 93: Global CINV Treatment Market Revenue Million Forecast, by End-User 2019 & 2032
- Table 94: Global CINV Treatment Market Volume K Unit Forecast, by End-User 2019 & 2032
- Table 95: Global CINV Treatment Market Revenue Million Forecast, by Country 2019 & 2032
- Table 96: Global CINV Treatment Market Volume K Unit Forecast, by Country 2019 & 2032
- Table 97: China CINV Treatment Market Revenue (Million) Forecast, by Application 2019 & 2032
- Table 98: China CINV Treatment Market Volume (K Unit) Forecast, by Application 2019 & 2032
- Table 99: Japan CINV Treatment Market Revenue (Million) Forecast, by Application 2019 & 2032
- Table 100: Japan CINV Treatment Market Volume (K Unit) Forecast, by Application 2019 & 2032
- Table 101: India CINV Treatment Market Revenue (Million) Forecast, by Application 2019 & 2032
- Table 102: India CINV Treatment Market Volume (K Unit) Forecast, by Application 2019 & 2032
- Table 103: Australia CINV Treatment Market Revenue (Million) Forecast, by Application 2019 & 2032
- Table 104: Australia CINV Treatment Market Volume (K Unit) Forecast, by Application 2019 & 2032
- Table 105: South Korea CINV Treatment Market Revenue (Million) Forecast, by Application 2019 & 2032
- Table 106: South Korea CINV Treatment Market Volume (K Unit) Forecast, by Application 2019 & 2032
- Table 107: Rest of Asia Pacific CINV Treatment Market Revenue (Million) Forecast, by Application 2019 & 2032
- Table 108: Rest of Asia Pacific CINV Treatment Market Volume (K Unit) Forecast, by Application 2019 & 2032
- Table 109: Global CINV Treatment Market Revenue Million Forecast, by Drug Type 2019 & 2032
- Table 110: Global CINV Treatment Market Volume K Unit Forecast, by Drug Type 2019 & 2032
- Table 111: Global CINV Treatment Market Revenue Million Forecast, by End-User 2019 & 2032
- Table 112: Global CINV Treatment Market Volume K Unit Forecast, by End-User 2019 & 2032
- Table 113: Global CINV Treatment Market Revenue Million Forecast, by Country 2019 & 2032
- Table 114: Global CINV Treatment Market Volume K Unit Forecast, by Country 2019 & 2032
- Table 115: GCC CINV Treatment Market Revenue (Million) Forecast, by Application 2019 & 2032
- Table 116: GCC CINV Treatment Market Volume (K Unit) Forecast, by Application 2019 & 2032
- Table 117: South Africa CINV Treatment Market Revenue (Million) Forecast, by Application 2019 & 2032
- Table 118: South Africa CINV Treatment Market Volume (K Unit) Forecast, by Application 2019 & 2032
- Table 119: Rest of Middle East and Africa CINV Treatment Market Revenue (Million) Forecast, by Application 2019 & 2032
- Table 120: Rest of Middle East and Africa CINV Treatment Market Volume (K Unit) Forecast, by Application 2019 & 2032
- Table 121: Global CINV Treatment Market Revenue Million Forecast, by Drug Type 2019 & 2032
- Table 122: Global CINV Treatment Market Volume K Unit Forecast, by Drug Type 2019 & 2032
- Table 123: Global CINV Treatment Market Revenue Million Forecast, by End-User 2019 & 2032
- Table 124: Global CINV Treatment Market Volume K Unit Forecast, by End-User 2019 & 2032
- Table 125: Global CINV Treatment Market Revenue Million Forecast, by Country 2019 & 2032
- Table 126: Global CINV Treatment Market Volume K Unit Forecast, by Country 2019 & 2032
- Table 127: Brazil CINV Treatment Market Revenue (Million) Forecast, by Application 2019 & 2032
- Table 128: Brazil CINV Treatment Market Volume (K Unit) Forecast, by Application 2019 & 2032
- Table 129: Argentina CINV Treatment Market Revenue (Million) Forecast, by Application 2019 & 2032
- Table 130: Argentina CINV Treatment Market Volume (K Unit) Forecast, by Application 2019 & 2032
- Table 131: Rest of South America CINV Treatment Market Revenue (Million) Forecast, by Application 2019 & 2032
- Table 132: Rest of South America CINV Treatment Market Volume (K Unit) Forecast, by Application 2019 & 2032
Frequently Asked Questions
1. What is the projected Compound Annual Growth Rate (CAGR) of the CINV Treatment Market?
The projected CAGR is approximately 5.80%.
2. Which companies are prominent players in the CINV Treatment Market?
Key companies in the market include Teva Pharmaceutical Industries Ltd , Merck & Co Inc, Novartis AG, Orchid Healthcare, GlaxoSmithKline plc, Mylan Pharmaceuticals Inc, Helsinn Holding S A, Heron Therapeutics Inc, Sun Pharmaceutical Industries Ltd, Baxter Healthcare.
3. What are the main segments of the CINV Treatment Market?
The market segments include Drug Type, End-User.
4. Can you provide details about the market size?
The market size is estimated to be USD XX Million as of 2022.
5. What are some drivers contributing to market growth?
; Increasing Prevalence of Cancer; Rising Research and Development Activities for Cancer Treatments.
6. What are the notable trends driving market growth?
Speciality Clinics Segment is expected to Grow at a Faster rate in the Forecast Period.
7. Are there any restraints impacting market growth?
; Lack of Awareness of the available Drugs.
8. Can you provide examples of recent developments in the market?
N/A
9. What pricing options are available for accessing the report?
Pricing options include single-user, multi-user, and enterprise licenses priced at USD 4750, USD 5250, and USD 8750 respectively.
10. Is the market size provided in terms of value or volume?
The market size is provided in terms of value, measured in Million and volume, measured in K Unit.
11. Are there any specific market keywords associated with the report?
Yes, the market keyword associated with the report is "CINV Treatment Market," which aids in identifying and referencing the specific market segment covered.
12. How do I determine which pricing option suits my needs best?
The pricing options vary based on user requirements and access needs. Individual users may opt for single-user licenses, while businesses requiring broader access may choose multi-user or enterprise licenses for cost-effective access to the report.
13. Are there any additional resources or data provided in the CINV Treatment Market report?
While the report offers comprehensive insights, it's advisable to review the specific contents or supplementary materials provided to ascertain if additional resources or data are available.
14. How can I stay updated on further developments or reports in the CINV Treatment Market?
To stay informed about further developments, trends, and reports in the CINV Treatment Market, consider subscribing to industry newsletters, following relevant companies and organizations, or regularly checking reputable industry news sources and publications.
Methodology
Step 1 - Identification of Relevant Samples Size from Population Database


Step 2 - Approaches for Defining Global Market Size (Value, Volume* & Price*)

Note*: In applicable scenarios
Step 3 - Data Sources
Primary Research
- Web Analytics
- Survey Reports
- Research Institute
- Latest Research Reports
- Opinion Leaders
Secondary Research
- Annual Reports
- White Paper
- Latest Press Release
- Industry Association
- Paid Database
- Investor Presentations

Step 4 - Data Triangulation
Involves using different sources of information in order to increase the validity of a study
These sources are likely to be stakeholders in a program - participants, other researchers, program staff, other community members, and so on.
Then we put all data in single framework & apply various statistical tools to find out the dynamic on the market.
During the analysis stage, feedback from the stakeholder groups would be compared to determine areas of agreement as well as areas of divergence


