

Key Insights
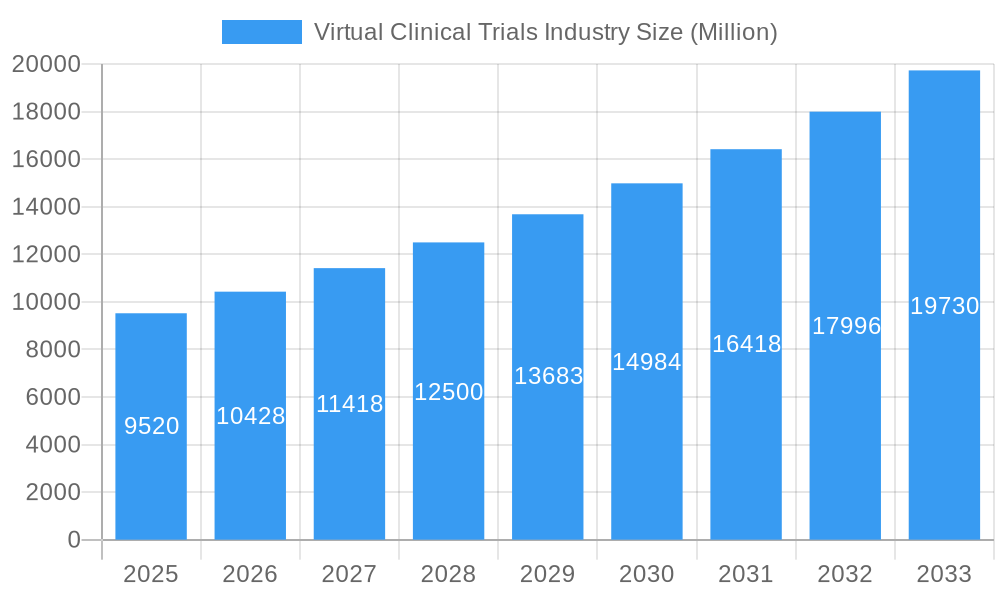
The virtual clinical trials (VCT) market is experiencing robust growth, projected to reach a substantial size with a Compound Annual Growth Rate (CAGR) of 9.34% from 2025 to 2033. This expansion is driven by several key factors. The increasing adoption of digital technologies in healthcare, coupled with the need for faster and more cost-effective clinical research, is significantly fueling market growth. Furthermore, the ability of VCTs to enhance patient engagement and recruitment, particularly in geographically dispersed populations, contributes to their rising popularity. The regulatory landscape is also increasingly supportive, with many agencies actively encouraging the use of innovative technologies in clinical research. The market is segmented by study design (observational, interventional, expanded access) and indication type (cardiovascular disease, oncology, other), reflecting the broad applicability of VCT across various therapeutic areas. Leading companies like IQVIA, ICON PLC, and Medidata Solutions are at the forefront of this technological advancement, investing heavily in platform development and service offerings. The geographic distribution of the market shows strong presence in North America and Europe, with Asia Pacific emerging as a rapidly growing region.
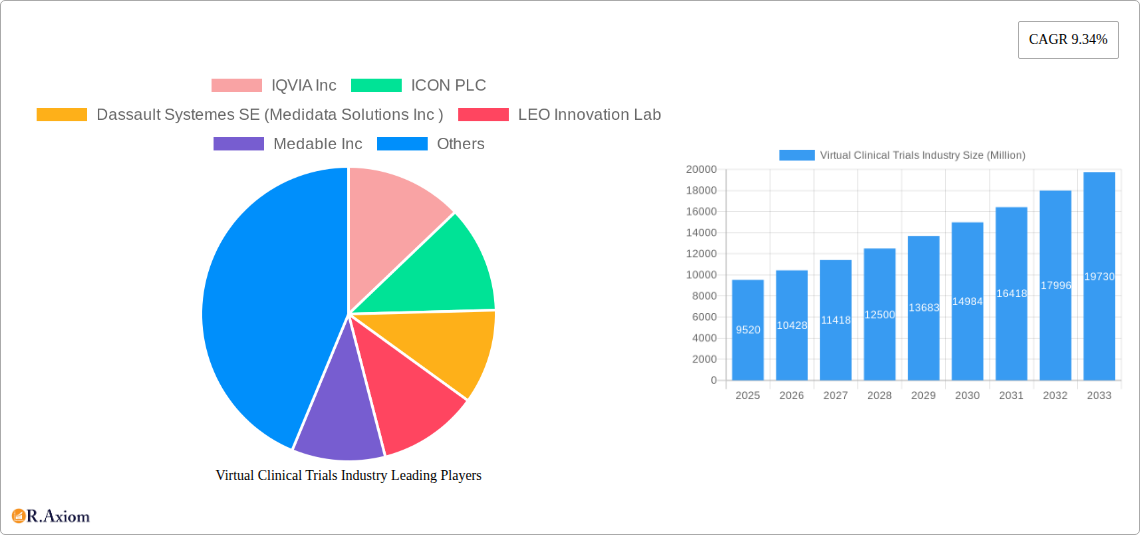
Virtual Clinical Trials Industry Market Size (In Billion)
The substantial growth trajectory of the VCT market is expected to continue throughout the forecast period. This sustained expansion will be driven by continuous advancements in technology, including artificial intelligence and machine learning, which will further enhance the efficiency and effectiveness of virtual trials. The growing emphasis on patient-centric clinical research, along with the increasing adoption of decentralized clinical trials (DCTs), will also contribute to market growth. However, challenges remain, including the need for robust data security measures, the establishment of clear regulatory guidelines, and ensuring equitable access to technology across diverse populations. Addressing these challenges will be crucial for the sustained and responsible growth of the VCT market, unlocking its full potential to transform clinical research and accelerate the development of new therapies.
Virtual Clinical Trials Industry Company Market Share
This comprehensive report provides an in-depth analysis of the virtual clinical trials industry, offering valuable insights for stakeholders seeking to understand market dynamics, growth opportunities, and competitive landscapes. Covering the period from 2019 to 2033, with a focus on 2025, this report presents a detailed overview of market segmentation, key players, and future trends. The report utilizes robust data analysis and forecasting techniques to provide actionable intelligence for strategic decision-making.
Virtual Clinical Trials Industry Market Concentration & Innovation
The virtual clinical trials market exhibits a moderately concentrated landscape, with a few major players holding significant market share. IQVIA Inc, ICON PLC, and Dassault Systèmes SE (Medidata Solutions Inc) are prominent examples, collectively commanding an estimated xx% of the market in 2025. However, the market also features a number of smaller, specialized companies like Medable Inc and Signant Health, driving innovation and competition.
Market Concentration Metrics (2025 Estimates):
- Top 3 Players Market Share: xx%
- Top 5 Players Market Share: xx%
- Average Deal Value (M&A): $xx Million
Innovation Drivers:
- Advancements in telehealth technologies, such as wearable sensors and remote monitoring devices.
- Development of sophisticated data analytics platforms for efficient data management and analysis.
- Increasing adoption of decentralized clinical trial (DCT) platforms.
- Regulatory support and incentives for virtual clinical trials.
Regulatory Frameworks & M&A Activity:
Regulatory bodies are actively shaping the virtual clinical trials landscape through guidelines and approvals. The increasing number of M&A activities reflects the strategic importance of this market. The value of M&A deals in the virtual clinical trials sector reached an estimated $xx Million in 2024, driven by the desire of larger companies to acquire innovative smaller firms and expand their capabilities.
Virtual Clinical Trials Industry Industry Trends & Insights
The virtual clinical trials market is experiencing rapid growth, driven by several key factors. Technological advancements, evolving patient preferences, and increasing regulatory support are accelerating market penetration. The global market size is estimated at $xx Million in 2025, with a Compound Annual Growth Rate (CAGR) of xx% projected from 2025 to 2033. This growth is fueled by the ability of virtual trials to improve patient recruitment and retention, reduce costs, and accelerate drug development timelines. The market penetration of virtual clinical trials is expected to increase from xx% in 2025 to xx% by 2033, driven by increasing adoption by pharmaceutical and biotech companies and a favorable regulatory environment. However, challenges remain such as ensuring data security and patient privacy, and overcoming technological limitations in certain therapeutic areas. The competitive landscape is evolving dynamically, with new entrants and collaborations shaping future market dynamics.
Dominant Markets & Segments in Virtual Clinical Trials Industry
North America currently holds the dominant position in the virtual clinical trials market, driven by factors such as robust healthcare infrastructure, high technological adoption rates, and established regulatory frameworks. Within North America, the United States holds the largest market share.
Dominant Segments:
- By Study Design: Interventional studies are currently the largest segment, but the observational study segment is also showing significant growth potential.
- By Indication Type: Oncology and cardiovascular disease represent substantial segments, owing to their high prevalence and the suitability of virtual trial methods.
Key Drivers of Regional Dominance (North America):
- Robust Healthcare Infrastructure: Advanced technological capabilities and a well-developed healthcare system provide a conducive environment for virtual clinical trials.
- High Technological Adoption: Extensive internet penetration and high levels of technology adoption amongst both healthcare professionals and patients enable the widespread use of virtual platforms.
- Favorable Regulatory Environment: Supportive regulations and guidelines from regulatory bodies such as the FDA facilitate the growth of virtual clinical trials.
- Significant R&D Investments: High levels of investment in research and development by pharmaceutical and biotech companies fuel the demand for efficient and cost-effective clinical trial solutions.
Virtual Clinical Trials Industry Product Developments
Recent product innovations center around user-friendly platforms integrating electronic data capture (EDC), telehealth functionalities, and wearable sensor integration. These advances streamline data collection, enhance patient engagement, and offer real-time monitoring capabilities, improving trial efficiency and data quality. The key competitive advantage lies in the ability to offer comprehensive, scalable, and secure solutions that meet the evolving needs of the pharmaceutical industry. The integration of artificial intelligence and machine learning is also emerging as a key differentiator, offering improved data analysis and prediction capabilities.
Report Scope & Segmentation Analysis
This report comprehensively segments the virtual clinical trials market by study design (observational, interventional, expanded access) and indication type (cardiovascular disease, oncology, other indication types). Each segment offers unique growth opportunities and competitive dynamics. For example, the interventional studies segment is expected to maintain substantial growth, driven by the need for efficient drug development across various therapeutic areas. The oncology segment is experiencing rapid growth due to the complexity and cost of traditional oncology trials, making virtual trials a compelling alternative. The market size for each segment is estimated in millions of dollars and further broken down by region to provide a more granular view.
Key Drivers of Virtual Clinical Trials Industry Growth
Technological advancements, including improvements in telehealth technologies, data analytics, and mobile health applications, are major growth drivers. Cost reduction compared to traditional trials, and faster recruitment and retention rates, are also significantly impacting market expansion. Finally, supportive regulatory environments and increasing patient demand for convenient and accessible healthcare options are crucial factors propelling market growth.
Challenges in the Virtual Clinical Trials Industry Sector
Significant challenges include ensuring data security and patient privacy in decentralized trial settings. Maintaining consistent data quality across geographically dispersed participants and addressing potential biases in virtual trial populations are also key concerns. Regulatory hurdles and ongoing technological limitations in certain areas represent further obstacles. The competitive landscape, while fostering innovation, also presents challenges to market penetration for smaller companies. These challenges, while significant, are being progressively addressed by technological advancements and evolving regulatory frameworks.
Emerging Opportunities in Virtual Clinical Trials Industry
The growing adoption of artificial intelligence (AI) and machine learning (ML) in data analysis, along with the potential for expansion into emerging markets with unmet medical needs, present significant opportunities. The development of more sophisticated and user-friendly platforms catering to diverse patient populations further presents avenues for growth. Additionally, the integration of virtual reality (VR) and augmented reality (AR) technologies is expected to create new opportunities to improve patient engagement and data collection.
Leading Players in the Virtual Clinical Trials Industry Market
- IQVIA Inc
- ICON PLC
- Dassault Systèmes SE (Medidata Solutions Inc)
- LEO Innovation Lab
- Medable Inc
- Parexel International Corporation
- Oracle Corporation
- Signant Health
- Clinical Ink Inc
- Medpace Holdings Inc
- Laboratory Corporation of America Holdings (Covance Inc)
Key Developments in Virtual Clinical Trials Industry Industry
- 2023: Medable Inc. launched a new platform integrating AI-powered data analytics.
- 2022: IQVIA Inc. and ICON PLC announced a strategic partnership to expand their virtual trial offerings.
- 2021: The FDA issued updated guidelines on the conduct of virtual clinical trials.
- 2020: Several key players secured significant funding to expand their technological capabilities.
Strategic Outlook for Virtual Clinical Trials Industry Market
The virtual clinical trials market is poised for continued robust growth, driven by technological advancements, supportive regulatory environments, and increasing patient demand for more convenient healthcare options. The market will likely witness further consolidation through mergers and acquisitions, with larger companies seeking to expand their capabilities and market share. The integration of AI and machine learning, and the potential for expansion into new therapeutic areas and emerging markets, will be key drivers of growth. The focus on data security, patient privacy, and regulatory compliance will remain paramount for successful market participation.
Virtual Clinical Trials Industry Segmentation
-
1. Study Design
- 1.1. Observational
- 1.2. Intervensional
- 1.3. Expanded Access
-
2. Indication Type
- 2.1. Cardiovascular Disease
- 2.2. Oncology
- 2.3. Other Indication Types
Virtual Clinical Trials Industry Segmentation By Geography
-
1. North America
- 1.1. United States
- 1.2. Canada
- 1.3. Mexico
-
2. Europe
- 2.1. Germany
- 2.2. United Kingdom
- 2.3. France
- 2.4. Italy
- 2.5. Spain
- 2.6. Rest of Europe
-
3. Asia Pacific
- 3.1. China
- 3.2. Japan
- 3.3. India
- 3.4. Australia
- 3.5. South Korea
- 3.6. Rest of Asia Pacific
-
4. Middle East and Africa
- 4.1. GCC
- 4.2. South Africa
- 4.3. Rest of Middle East and Africa
-
5. South America
- 5.1. Brazil
- 5.2. Argentina
- 5.3. Rest of South America
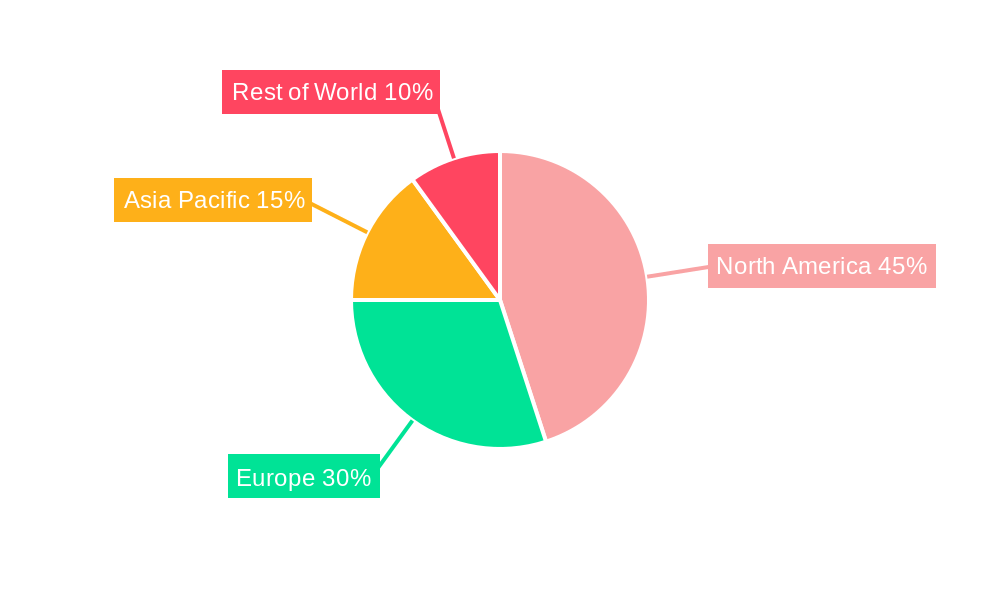
Virtual Clinical Trials Industry Regional Market Share
Geographic Coverage of Virtual Clinical Trials Industry
Virtual Clinical Trials Industry REPORT HIGHLIGHTS
| Aspects | Details |
|---|---|
| Study Period | 2020-2034 |
| Base Year | 2025 |
| Estimated Year | 2026 |
| Forecast Period | 2026-2034 |
| Historical Period | 2020-2025 |
| Growth Rate | CAGR of 9.34% from 2020-2034 |
| Segmentation |
|
Table of Contents
- 1. Introduction
- 1.1. Research Scope
- 1.2. Market Segmentation
- 1.3. Research Objective
- 1.4. Definitions and Assumptions
- 2. Executive Summary
- 2.1. Market Snapshot
- 3. Market Dynamics
- 3.1. Market Drivers
- 3.2. Market Restrains
- 3.3. Market Trends
- 3.4. Market Opportunities
- 4. Market Factor Analysis
- 4.1. Porters Five Forces
- 4.1.1. Bargaining Power of Suppliers
- 4.1.2. Bargaining Power of Buyers
- 4.1.3. Threat of New Entrants
- 4.1.4. Threat of Substitutes
- 4.1.5. Competitive Rivalry
- 4.2. PESTEL analysis
- 4.3. BCG Analysis
- 4.3.1. Stars (High Growth, High Market Share)
- 4.3.2. Cash Cows (Low Growth, High Market Share)
- 4.3.3. Question Mark (High Growth, Low Market Share)
- 4.3.4. Dogs (Low Growth, Low Market Share)
- 4.4. Ansoff Matrix Analysis
- 4.5. Supply Chain Analysis
- 4.6. Regulatory Landscape
- 4.7. Current Market Potential and Opportunity Assessment (TAM–SAM–SOM Framework)
- 4.8. RAX Analyst Note
- 4.1. Porters Five Forces
- 5. Market Analysis, Insights and Forecast 2021-2033
- 5.1. Market Analysis, Insights and Forecast - by Study Design
- 5.1.1. Observational
- 5.1.2. Intervensional
- 5.1.3. Expanded Access
- 5.2. Market Analysis, Insights and Forecast - by Indication Type
- 5.2.1. Cardiovascular Disease
- 5.2.2. Oncology
- 5.2.3. Other Indication Types
- 5.3. Market Analysis, Insights and Forecast - by Region
- 5.3.1. North America
- 5.3.2. Europe
- 5.3.3. Asia Pacific
- 5.3.4. Middle East and Africa
- 5.3.5. South America
- 5.1. Market Analysis, Insights and Forecast - by Study Design
- 6. Global Virtual Clinical Trials Industry Analysis, Insights and Forecast, 2021-2033
- 6.1. Market Analysis, Insights and Forecast - by Study Design
- 6.1.1. Observational
- 6.1.2. Intervensional
- 6.1.3. Expanded Access
- 6.2. Market Analysis, Insights and Forecast - by Indication Type
- 6.2.1. Cardiovascular Disease
- 6.2.2. Oncology
- 6.2.3. Other Indication Types
- 6.1. Market Analysis, Insights and Forecast - by Study Design
- 7. North America Virtual Clinical Trials Industry Analysis, Insights and Forecast, 2020-2032
- 7.1. Market Analysis, Insights and Forecast - by Study Design
- 7.1.1. Observational
- 7.1.2. Intervensional
- 7.1.3. Expanded Access
- 7.2. Market Analysis, Insights and Forecast - by Indication Type
- 7.2.1. Cardiovascular Disease
- 7.2.2. Oncology
- 7.2.3. Other Indication Types
- 7.1. Market Analysis, Insights and Forecast - by Study Design
- 8. Europe Virtual Clinical Trials Industry Analysis, Insights and Forecast, 2020-2032
- 8.1. Market Analysis, Insights and Forecast - by Study Design
- 8.1.1. Observational
- 8.1.2. Intervensional
- 8.1.3. Expanded Access
- 8.2. Market Analysis, Insights and Forecast - by Indication Type
- 8.2.1. Cardiovascular Disease
- 8.2.2. Oncology
- 8.2.3. Other Indication Types
- 8.1. Market Analysis, Insights and Forecast - by Study Design
- 9. Asia Pacific Virtual Clinical Trials Industry Analysis, Insights and Forecast, 2020-2032
- 9.1. Market Analysis, Insights and Forecast - by Study Design
- 9.1.1. Observational
- 9.1.2. Intervensional
- 9.1.3. Expanded Access
- 9.2. Market Analysis, Insights and Forecast - by Indication Type
- 9.2.1. Cardiovascular Disease
- 9.2.2. Oncology
- 9.2.3. Other Indication Types
- 9.1. Market Analysis, Insights and Forecast - by Study Design
- 10. Middle East and Africa Virtual Clinical Trials Industry Analysis, Insights and Forecast, 2020-2032
- 10.1. Market Analysis, Insights and Forecast - by Study Design
- 10.1.1. Observational
- 10.1.2. Intervensional
- 10.1.3. Expanded Access
- 10.2. Market Analysis, Insights and Forecast - by Indication Type
- 10.2.1. Cardiovascular Disease
- 10.2.2. Oncology
- 10.2.3. Other Indication Types
- 10.1. Market Analysis, Insights and Forecast - by Study Design
- 11. South America Virtual Clinical Trials Industry Analysis, Insights and Forecast, 2020-2032
- 11.1. Market Analysis, Insights and Forecast - by Study Design
- 11.1.1. Observational
- 11.1.2. Intervensional
- 11.1.3. Expanded Access
- 11.2. Market Analysis, Insights and Forecast - by Indication Type
- 11.2.1. Cardiovascular Disease
- 11.2.2. Oncology
- 11.2.3. Other Indication Types
- 11.1. Market Analysis, Insights and Forecast - by Study Design
- 12. Competitive Analysis
- 12.1. Company Profiles
- 12.1.1 IQVIA Inc
- 12.1.1.1. Company Overview
- 12.1.1.2. Products
- 12.1.1.3. Company Financials
- 12.1.1.4. SWOT Analysis
- 12.1.2 ICON PLC
- 12.1.2.1. Company Overview
- 12.1.2.2. Products
- 12.1.2.3. Company Financials
- 12.1.2.4. SWOT Analysis
- 12.1.3 Dassault Systemes SE (Medidata Solutions Inc )
- 12.1.3.1. Company Overview
- 12.1.3.2. Products
- 12.1.3.3. Company Financials
- 12.1.3.4. SWOT Analysis
- 12.1.4 LEO Innovation Lab
- 12.1.4.1. Company Overview
- 12.1.4.2. Products
- 12.1.4.3. Company Financials
- 12.1.4.4. SWOT Analysis
- 12.1.5 Medable Inc
- 12.1.5.1. Company Overview
- 12.1.5.2. Products
- 12.1.5.3. Company Financials
- 12.1.5.4. SWOT Analysis
- 12.1.6 Parexel International Corporation
- 12.1.6.1. Company Overview
- 12.1.6.2. Products
- 12.1.6.3. Company Financials
- 12.1.6.4. SWOT Analysis
- 12.1.7 Oracle Corporation
- 12.1.7.1. Company Overview
- 12.1.7.2. Products
- 12.1.7.3. Company Financials
- 12.1.7.4. SWOT Analysis
- 12.1.8 Signant Health
- 12.1.8.1. Company Overview
- 12.1.8.2. Products
- 12.1.8.3. Company Financials
- 12.1.8.4. SWOT Analysis
- 12.1.9 Clinical Ink Inc
- 12.1.9.1. Company Overview
- 12.1.9.2. Products
- 12.1.9.3. Company Financials
- 12.1.9.4. SWOT Analysis
- 12.1.10 Medpace Holdings Inc
- 12.1.10.1. Company Overview
- 12.1.10.2. Products
- 12.1.10.3. Company Financials
- 12.1.10.4. SWOT Analysis
- 12.1.11 Laboratory Corporation of America Holdings (Covance Inc )
- 12.1.11.1. Company Overview
- 12.1.11.2. Products
- 12.1.11.3. Company Financials
- 12.1.11.4. SWOT Analysis
- 12.1.1 IQVIA Inc
- 12.2. Market Entropy
- 12.2.1 Company's Key Areas Served
- 12.2.2 Recent Developments
- 12.3. Company Market Share Analysis 2025
- 12.3.1 Top 5 Companies Market Share Analysis
- 12.3.2 Top 3 Companies Market Share Analysis
- 12.4. List of Potential Customers
- 13. Research Methodology
List of Figures
- Figure 1: Global Virtual Clinical Trials Industry Revenue Breakdown (Million, %) by Region 2025 & 2033
- Figure 2: North America Virtual Clinical Trials Industry Revenue (Million), by Study Design 2025 & 2033
- Figure 3: North America Virtual Clinical Trials Industry Revenue Share (%), by Study Design 2025 & 2033
- Figure 4: North America Virtual Clinical Trials Industry Revenue (Million), by Indication Type 2025 & 2033
- Figure 5: North America Virtual Clinical Trials Industry Revenue Share (%), by Indication Type 2025 & 2033
- Figure 6: North America Virtual Clinical Trials Industry Revenue (Million), by Country 2025 & 2033
- Figure 7: North America Virtual Clinical Trials Industry Revenue Share (%), by Country 2025 & 2033
- Figure 8: Europe Virtual Clinical Trials Industry Revenue (Million), by Study Design 2025 & 2033
- Figure 9: Europe Virtual Clinical Trials Industry Revenue Share (%), by Study Design 2025 & 2033
- Figure 10: Europe Virtual Clinical Trials Industry Revenue (Million), by Indication Type 2025 & 2033
- Figure 11: Europe Virtual Clinical Trials Industry Revenue Share (%), by Indication Type 2025 & 2033
- Figure 12: Europe Virtual Clinical Trials Industry Revenue (Million), by Country 2025 & 2033
- Figure 13: Europe Virtual Clinical Trials Industry Revenue Share (%), by Country 2025 & 2033
- Figure 14: Asia Pacific Virtual Clinical Trials Industry Revenue (Million), by Study Design 2025 & 2033
- Figure 15: Asia Pacific Virtual Clinical Trials Industry Revenue Share (%), by Study Design 2025 & 2033
- Figure 16: Asia Pacific Virtual Clinical Trials Industry Revenue (Million), by Indication Type 2025 & 2033
- Figure 17: Asia Pacific Virtual Clinical Trials Industry Revenue Share (%), by Indication Type 2025 & 2033
- Figure 18: Asia Pacific Virtual Clinical Trials Industry Revenue (Million), by Country 2025 & 2033
- Figure 19: Asia Pacific Virtual Clinical Trials Industry Revenue Share (%), by Country 2025 & 2033
- Figure 20: Middle East and Africa Virtual Clinical Trials Industry Revenue (Million), by Study Design 2025 & 2033
- Figure 21: Middle East and Africa Virtual Clinical Trials Industry Revenue Share (%), by Study Design 2025 & 2033
- Figure 22: Middle East and Africa Virtual Clinical Trials Industry Revenue (Million), by Indication Type 2025 & 2033
- Figure 23: Middle East and Africa Virtual Clinical Trials Industry Revenue Share (%), by Indication Type 2025 & 2033
- Figure 24: Middle East and Africa Virtual Clinical Trials Industry Revenue (Million), by Country 2025 & 2033
- Figure 25: Middle East and Africa Virtual Clinical Trials Industry Revenue Share (%), by Country 2025 & 2033
- Figure 26: South America Virtual Clinical Trials Industry Revenue (Million), by Study Design 2025 & 2033
- Figure 27: South America Virtual Clinical Trials Industry Revenue Share (%), by Study Design 2025 & 2033
- Figure 28: South America Virtual Clinical Trials Industry Revenue (Million), by Indication Type 2025 & 2033
- Figure 29: South America Virtual Clinical Trials Industry Revenue Share (%), by Indication Type 2025 & 2033
- Figure 30: South America Virtual Clinical Trials Industry Revenue (Million), by Country 2025 & 2033
- Figure 31: South America Virtual Clinical Trials Industry Revenue Share (%), by Country 2025 & 2033
List of Tables
- Table 1: Global Virtual Clinical Trials Industry Revenue Million Forecast, by Study Design 2020 & 2033
- Table 2: Global Virtual Clinical Trials Industry Revenue Million Forecast, by Indication Type 2020 & 2033
- Table 3: Global Virtual Clinical Trials Industry Revenue Million Forecast, by Region 2020 & 2033
- Table 4: Global Virtual Clinical Trials Industry Revenue Million Forecast, by Study Design 2020 & 2033
- Table 5: Global Virtual Clinical Trials Industry Revenue Million Forecast, by Indication Type 2020 & 2033
- Table 6: Global Virtual Clinical Trials Industry Revenue Million Forecast, by Country 2020 & 2033
- Table 7: United States Virtual Clinical Trials Industry Revenue (Million) Forecast, by Application 2020 & 2033
- Table 8: Canada Virtual Clinical Trials Industry Revenue (Million) Forecast, by Application 2020 & 2033
- Table 9: Mexico Virtual Clinical Trials Industry Revenue (Million) Forecast, by Application 2020 & 2033
- Table 10: Global Virtual Clinical Trials Industry Revenue Million Forecast, by Study Design 2020 & 2033
- Table 11: Global Virtual Clinical Trials Industry Revenue Million Forecast, by Indication Type 2020 & 2033
- Table 12: Global Virtual Clinical Trials Industry Revenue Million Forecast, by Country 2020 & 2033
- Table 13: Germany Virtual Clinical Trials Industry Revenue (Million) Forecast, by Application 2020 & 2033
- Table 14: United Kingdom Virtual Clinical Trials Industry Revenue (Million) Forecast, by Application 2020 & 2033
- Table 15: France Virtual Clinical Trials Industry Revenue (Million) Forecast, by Application 2020 & 2033
- Table 16: Italy Virtual Clinical Trials Industry Revenue (Million) Forecast, by Application 2020 & 2033
- Table 17: Spain Virtual Clinical Trials Industry Revenue (Million) Forecast, by Application 2020 & 2033
- Table 18: Rest of Europe Virtual Clinical Trials Industry Revenue (Million) Forecast, by Application 2020 & 2033
- Table 19: Global Virtual Clinical Trials Industry Revenue Million Forecast, by Study Design 2020 & 2033
- Table 20: Global Virtual Clinical Trials Industry Revenue Million Forecast, by Indication Type 2020 & 2033
- Table 21: Global Virtual Clinical Trials Industry Revenue Million Forecast, by Country 2020 & 2033
- Table 22: China Virtual Clinical Trials Industry Revenue (Million) Forecast, by Application 2020 & 2033
- Table 23: Japan Virtual Clinical Trials Industry Revenue (Million) Forecast, by Application 2020 & 2033
- Table 24: India Virtual Clinical Trials Industry Revenue (Million) Forecast, by Application 2020 & 2033
- Table 25: Australia Virtual Clinical Trials Industry Revenue (Million) Forecast, by Application 2020 & 2033
- Table 26: South Korea Virtual Clinical Trials Industry Revenue (Million) Forecast, by Application 2020 & 2033
- Table 27: Rest of Asia Pacific Virtual Clinical Trials Industry Revenue (Million) Forecast, by Application 2020 & 2033
- Table 28: Global Virtual Clinical Trials Industry Revenue Million Forecast, by Study Design 2020 & 2033
- Table 29: Global Virtual Clinical Trials Industry Revenue Million Forecast, by Indication Type 2020 & 2033
- Table 30: Global Virtual Clinical Trials Industry Revenue Million Forecast, by Country 2020 & 2033
- Table 31: GCC Virtual Clinical Trials Industry Revenue (Million) Forecast, by Application 2020 & 2033
- Table 32: South Africa Virtual Clinical Trials Industry Revenue (Million) Forecast, by Application 2020 & 2033
- Table 33: Rest of Middle East and Africa Virtual Clinical Trials Industry Revenue (Million) Forecast, by Application 2020 & 2033
- Table 34: Global Virtual Clinical Trials Industry Revenue Million Forecast, by Study Design 2020 & 2033
- Table 35: Global Virtual Clinical Trials Industry Revenue Million Forecast, by Indication Type 2020 & 2033
- Table 36: Global Virtual Clinical Trials Industry Revenue Million Forecast, by Country 2020 & 2033
- Table 37: Brazil Virtual Clinical Trials Industry Revenue (Million) Forecast, by Application 2020 & 2033
- Table 38: Argentina Virtual Clinical Trials Industry Revenue (Million) Forecast, by Application 2020 & 2033
- Table 39: Rest of South America Virtual Clinical Trials Industry Revenue (Million) Forecast, by Application 2020 & 2033
Frequently Asked Questions
1. What is the projected Compound Annual Growth Rate (CAGR) of the Virtual Clinical Trials Industry?
The projected CAGR is approximately 9.34%.
2. Which companies are prominent players in the Virtual Clinical Trials Industry?
Key companies in the market include IQVIA Inc, ICON PLC, Dassault Systemes SE (Medidata Solutions Inc ), LEO Innovation Lab, Medable Inc, Parexel International Corporation, Oracle Corporation, Signant Health, Clinical Ink Inc, Medpace Holdings Inc, Laboratory Corporation of America Holdings (Covance Inc ).
3. What are the main segments of the Virtual Clinical Trials Industry?
The market segments include Study Design, Indication Type.
4. Can you provide details about the market size?
The market size is estimated to be USD 9.52 Million as of 2022.
5. What are some drivers contributing to market growth?
Growing Digitization in Healthcare Sector; Technological Advancements in Virtual Clinical Trials; Prevalence of Chronic Disease.
6. What are the notable trends driving market growth?
The Oncology Segment is Expected to Occupy a Significant Share of the Market Over the Forecast Period.
7. Are there any restraints impacting market growth?
Challenges Associated with the Virtual Clinical Trials.
8. Can you provide examples of recent developments in the market?
N/A
9. What pricing options are available for accessing the report?
Pricing options include single-user, multi-user, and enterprise licenses priced at USD 4750, USD 5250, and USD 8750 respectively.
10. Is the market size provided in terms of value or volume?
The market size is provided in terms of value, measured in Million.
11. Are there any specific market keywords associated with the report?
Yes, the market keyword associated with the report is "Virtual Clinical Trials Industry," which aids in identifying and referencing the specific market segment covered.
12. How do I determine which pricing option suits my needs best?
The pricing options vary based on user requirements and access needs. Individual users may opt for single-user licenses, while businesses requiring broader access may choose multi-user or enterprise licenses for cost-effective access to the report.
13. Are there any additional resources or data provided in the Virtual Clinical Trials Industry report?
While the report offers comprehensive insights, it's advisable to review the specific contents or supplementary materials provided to ascertain if additional resources or data are available.
14. How can I stay updated on further developments or reports in the Virtual Clinical Trials Industry?
To stay informed about further developments, trends, and reports in the Virtual Clinical Trials Industry, consider subscribing to industry newsletters, following relevant companies and organizations, or regularly checking reputable industry news sources and publications.
Methodology
Step 1 - Identification of Relevant Samples Size from Population Database


Step 2 - Approaches for Defining Global Market Size (Value, Volume* & Price*)

Note*: In applicable scenarios
Step 3 - Data Sources
Primary Research
- Web Analytics
- Survey Reports
- Research Institute
- Latest Research Reports
- Opinion Leaders
Secondary Research
- Annual Reports
- White Paper
- Latest Press Release
- Industry Association
- Paid Database
- Investor Presentations

Step 4 - Data Triangulation
Involves using different sources of information in order to increase the validity of a study
These sources are likely to be stakeholders in a program - participants, other researchers, program staff, other community members, and so on.
Then we put all data in single framework & apply various statistical tools to find out the dynamic on the market.
During the analysis stage, feedback from the stakeholder groups would be compared to determine areas of agreement as well as areas of divergence