Key Insights
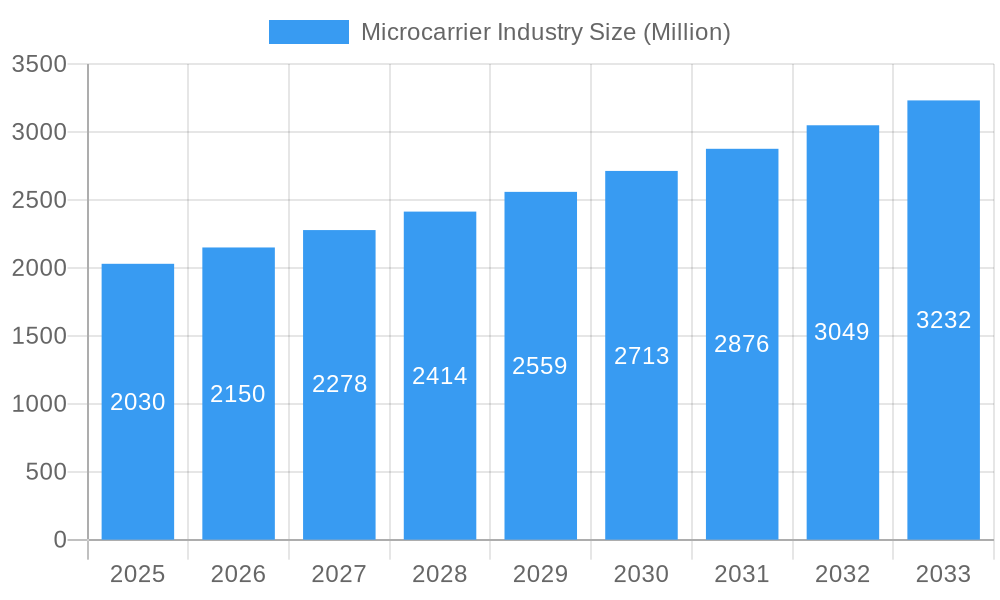
The global microcarrier market, valued at $2.03 billion in 2025, is projected to experience robust growth, driven by the burgeoning cell therapy and vaccine manufacturing sectors. A compound annual growth rate (CAGR) of 5.82% from 2025 to 2033 indicates a significant expansion in market size. This growth is fueled by several key factors. The increasing prevalence of chronic diseases necessitating advanced therapeutic solutions, coupled with rising R&D investments in cell-based therapies and vaccines, is a primary driver. Furthermore, technological advancements leading to the development of more efficient and cost-effective microcarrier production methods are contributing to market expansion. The shift towards personalized medicine and the growing adoption of innovative cell culture techniques further enhance market prospects. However, potential restraints include the high cost of microcarrier-based cell culture technologies and stringent regulatory approvals for novel therapeutic products.
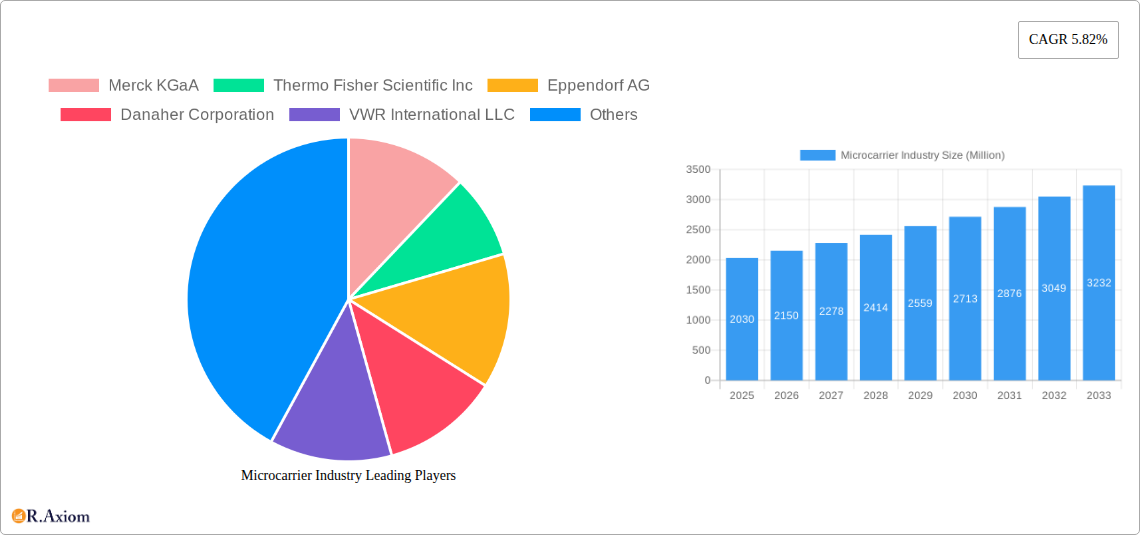
Microcarrier Industry Market Size (In Billion)
Market segmentation reveals a diverse landscape. Alginate-based microcarriers currently hold a significant market share due to their biocompatibility and ease of use. However, collagen-based and dextran-based microcarriers are gaining traction owing to their superior cell attachment properties and improved cell growth support. The cell therapy application segment is projected to dominate the market due to the increasing demand for advanced therapeutic options for various diseases. Geographically, North America and Europe currently hold a substantial market share, owing to the presence of established players and robust regulatory frameworks. However, the Asia-Pacific region is poised for significant growth, driven by rising healthcare expenditure and expanding research infrastructure in countries such as China and India. Key players like Merck KGaA, Thermo Fisher Scientific, and Sartorius AG are actively involved in product development and market expansion, contributing to the overall growth of this dynamic industry.
Microcarrier Industry Company Market Share
Microcarrier Industry Market Report: 2019-2033
This comprehensive report provides a detailed analysis of the global microcarrier industry, offering invaluable insights for stakeholders seeking to navigate this dynamic market. The report covers the period from 2019 to 2033, with a focus on the 2025-2033 forecast period. Key market segments, leading players, and future growth prospects are thoroughly examined. The total market size in 2025 is estimated at $XX Million, with a projected CAGR of XX% from 2025 to 2033.
Microcarrier Industry Market Concentration & Innovation
The microcarrier industry exhibits a moderately concentrated market structure, with key players such as Merck KGaA, Thermo Fisher Scientific Inc, Eppendorf AG, Danaher Corporation, VWR International LLC, Lonza Group Ltd, and Sartorius AG holding significant market share. While precise market share figures for each company are proprietary, Merck KGaA and Thermo Fisher Scientific Inc are believed to hold the largest shares, cumulatively accounting for an estimated 40% of the market in 2025. The industry witnesses continuous innovation, driven by the need for improved cell culture efficiency and scalability. Regulatory frameworks, particularly those related to biopharmaceutical manufacturing, significantly impact market dynamics. The industry faces pressure from alternative cell culture technologies, albeit these alternatives often present unique limitations in scalability or cost. Recent years have seen increased M&A activity, with deal values in the hundreds of millions of dollars, indicating a consolidation trend within the industry. This consolidation is aimed at expanding product portfolios and geographic reach.
- Market Concentration: Moderately concentrated, with a few dominant players.
- Innovation Drivers: Improved cell culture efficiency, scalability, and regulatory compliance.
- Regulatory Frameworks: Stringent regulations in biopharmaceutical manufacturing drive innovation and compliance.
- Product Substitutes: Alternative cell culture technologies exist but often lack scalability or affordability.
- M&A Activity: Significant M&A activity observed, with deal values in the $XX Million range.
Microcarrier Industry Industry Trends & Insights
The microcarrier industry is experiencing robust growth, fueled by increasing demand from the biopharmaceutical sector. Key drivers include the rising prevalence of chronic diseases, escalating demand for biologics, and advancements in cell and gene therapies. The market is witnessing technological disruptions, particularly in the development of novel microcarrier materials with enhanced biocompatibility and performance. Consumer preferences are shifting towards more efficient and cost-effective microcarrier systems. The competitive landscape is intense, with companies focusing on product differentiation, technological advancements, and strategic partnerships. The market penetration of advanced microcarriers is increasing steadily, driven by their superior performance in cell culture applications.
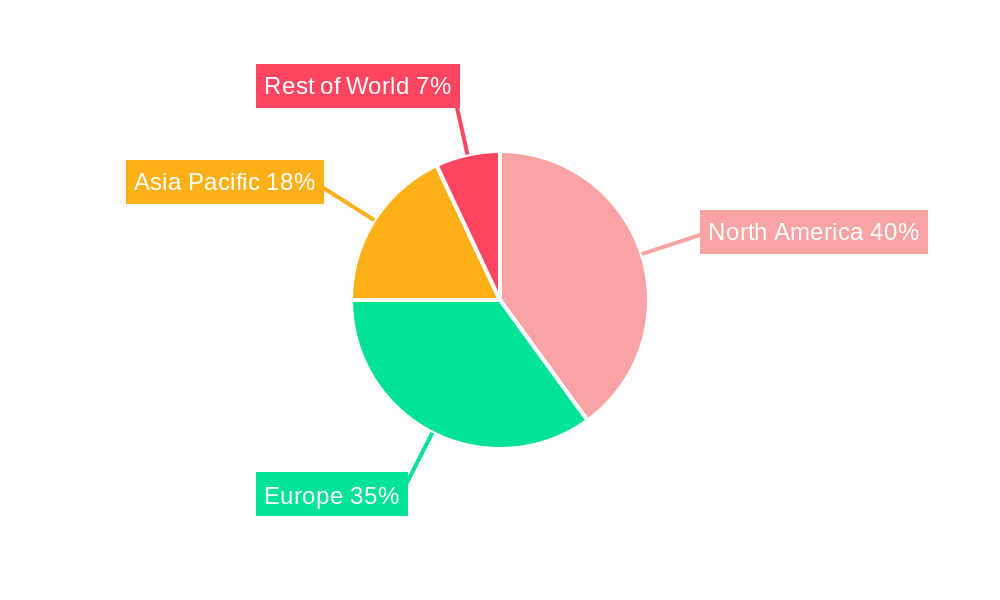
Dominant Markets & Segments in Microcarrier Industry
The North American region currently dominates the microcarrier market, followed by Europe. This dominance is primarily attributed to the strong presence of major pharmaceutical and biotechnology companies, advanced research infrastructure, and favorable regulatory environments. Within material types, polystyrene-based microcarriers currently hold the largest market share due to their cost-effectiveness and well-established manufacturing processes. However, the demand for alginate-based and collagen-based microcarriers is increasing rapidly due to their superior biocompatibility. In terms of applications, cell therapy and vaccine manufacturing are the primary drivers of market growth, projected to account for over 70% of the market share by 2033.
- Key Drivers for North America: Strong presence of biotech companies, advanced R&D infrastructure, and favorable regulatory environment.
- Polystyrene-Based Microcarriers: Largest market share due to cost-effectiveness and established manufacturing processes.
- Cell Therapy & Vaccine Manufacturing: Primary application drivers, projected to account for >70% of the market by 2033.
- Growth of Alginate- and Collagen-Based Microcarriers: Driven by superior biocompatibility and increasing demand in advanced therapies.
Microcarrier Industry Product Developments
Recent innovations focus on enhancing biocompatibility, improving cell attachment efficiency, and developing customizable microcarrier systems. New materials, surface modifications, and controlled release systems are being explored to optimize cell growth and product yields. These advancements are addressing the limitations of traditional microcarriers and catering to the evolving needs of cell and gene therapy applications. The market is seeing a strong focus on designing microcarriers that are better suited for specific cell types and applications, improving overall efficiency and reducing manufacturing costs.
Report Scope & Segmentation Analysis
This report comprehensively segments the microcarrier market by material type (Alginate-Based, Collagen-Based, Dextran-Based, Polystyrene-Based, Others) and application (Cell Therapy, Vaccine Manufacturing, Other Applications). Each segment is analyzed in detail, providing insights into market size, growth projections, and competitive dynamics. For instance, the cell therapy segment is expected to exhibit the highest growth rate due to the expanding cell therapy market. The polystyrene-based microcarrier segment is currently the largest, but other types are expected to gain significant market share in the coming years due to their enhanced properties.
- Material Type: Each category has growth projections and detailed competitive analysis.
- Application: Each application segment is analyzed for its market size, projected growth, and competitive dynamics.
Key Drivers of Microcarrier Industry Growth
The key growth drivers for the microcarrier industry include advancements in cell and gene therapy, rising demand for biologics, the increasing prevalence of chronic diseases, and supportive government regulations. The development of novel microcarrier materials with enhanced properties further fuels market expansion. Additionally, the growing adoption of automated cell culture systems is driving the demand for efficient and scalable microcarrier technologies.
Challenges in the Microcarrier Industry Sector
Major challenges include the high cost of advanced microcarriers, stringent regulatory requirements for biopharmaceutical manufacturing, and the potential for contamination during the manufacturing process. Supply chain disruptions and competition from alternative cell culture technologies also pose significant hurdles. The need for skilled personnel to operate sophisticated cell culture systems is another constraint impacting market growth. The overall impact of these challenges on market growth is estimated to be around XX% by 2033.
Emerging Opportunities in Microcarrier Industry
Emerging opportunities lie in the development of novel microcarrier materials, the expansion into new therapeutic areas such as regenerative medicine, and the integration of advanced technologies such as artificial intelligence and automation into cell culture processes. The development of personalized medicine and the increasing demand for customized microcarrier systems for specific cell types also present lucrative opportunities.
Leading Players in the Microcarrier Industry Market
Key Developments in Microcarrier Industry Industry
- 2022 Q3: Lonza Group Ltd announced a significant expansion of its microcarrier manufacturing facility.
- 2023 Q1: Merck KGaA launched a new line of high-performance alginate-based microcarriers.
- 2024 Q2: Thermo Fisher Scientific Inc acquired a smaller microcarrier company, expanding its product portfolio. (Further updates will be added in future versions of this report)
Strategic Outlook for Microcarrier Industry Market
The future of the microcarrier industry appears bright, driven by continuous innovation, the expansion of cell and gene therapies, and the increasing demand for advanced biopharmaceutical products. The market is expected to witness significant growth in the coming years, with further consolidation among key players and the emergence of new technologies and applications. Companies that can effectively address the challenges related to cost, scalability, and regulatory compliance will be best positioned to capitalize on the growth opportunities.
Microcarrier Industry Segmentation
-
1. Material Type
- 1.1. Alginate-Based
- 1.2. Collagen-Based
- 1.3. Dextran-Based
- 1.4. Polystyrene-Based
- 1.5. Others
-
2. Application
- 2.1. Cell Therapy
- 2.2. Vaccine Manufacturing
- 2.3. Other Applications
Microcarrier Industry Segmentation By Geography
-
1. North America
- 1.1. United States
- 1.2. Canada
- 1.3. Mexico
-
2. Europe
- 2.1. Germany
- 2.2. United Kingdom
- 2.3. France
- 2.4. Italy
- 2.5. Spain
- 2.6. Rest of Europe
-
3. Asia Pacific
- 3.1. China
- 3.2. Japan
- 3.3. India
- 3.4. Australia
- 3.5. South Korea
- 3.6. Rest of Asia Pacific
-
4. Middle East and Africa
- 4.1. GCC
- 4.2. South Africa
- 4.3. Rest of Middle East and Africa
-
5. South America
- 5.1. Brazil
- 5.2. Argentina
- 5.3. Rest of South America
Microcarrier Industry Regional Market Share
Geographic Coverage of Microcarrier Industry
Microcarrier Industry REPORT HIGHLIGHTS
| Aspects | Details |
|---|---|
| Study Period | 2020-2034 |
| Base Year | 2025 |
| Estimated Year | 2026 |
| Forecast Period | 2026-2034 |
| Historical Period | 2020-2025 |
| Growth Rate | CAGR of 5.82% from 2020-2034 |
| Segmentation |
|
Table of Contents
- 1. Introduction
- 1.1. Research Scope
- 1.2. Market Segmentation
- 1.3. Research Objective
- 1.4. Definitions and Assumptions
- 2. Executive Summary
- 2.1. Market Snapshot
- 3. Market Dynamics
- 3.1. Market Drivers
- 3.2. Market Restrains
- 3.3. Market Trends
- 3.4. Market Opportunities
- 4. Market Factor Analysis
- 4.1. Porters Five Forces
- 4.1.1. Bargaining Power of Suppliers
- 4.1.2. Bargaining Power of Buyers
- 4.1.3. Threat of New Entrants
- 4.1.4. Threat of Substitutes
- 4.1.5. Competitive Rivalry
- 4.2. PESTEL analysis
- 4.3. BCG Analysis
- 4.3.1. Stars (High Growth, High Market Share)
- 4.3.2. Cash Cows (Low Growth, High Market Share)
- 4.3.3. Question Mark (High Growth, Low Market Share)
- 4.3.4. Dogs (Low Growth, Low Market Share)
- 4.4. Ansoff Matrix Analysis
- 4.5. Supply Chain Analysis
- 4.6. Regulatory Landscape
- 4.7. Current Market Potential and Opportunity Assessment (TAM–SAM–SOM Framework)
- 4.8. RAX Analyst Note
- 4.1. Porters Five Forces
- 5. Market Analysis, Insights and Forecast 2021-2033
- 5.1. Market Analysis, Insights and Forecast - by Material Type
- 5.1.1. Alginate-Based
- 5.1.2. Collagen-Based
- 5.1.3. Dextran-Based
- 5.1.4. Polystyrene-Based
- 5.1.5. Others
- 5.2. Market Analysis, Insights and Forecast - by Application
- 5.2.1. Cell Therapy
- 5.2.2. Vaccine Manufacturing
- 5.2.3. Other Applications
- 5.3. Market Analysis, Insights and Forecast - by Region
- 5.3.1. North America
- 5.3.2. Europe
- 5.3.3. Asia Pacific
- 5.3.4. Middle East and Africa
- 5.3.5. South America
- 5.1. Market Analysis, Insights and Forecast - by Material Type
- 6. Global Microcarrier Industry Analysis, Insights and Forecast, 2021-2033
- 6.1. Market Analysis, Insights and Forecast - by Material Type
- 6.1.1. Alginate-Based
- 6.1.2. Collagen-Based
- 6.1.3. Dextran-Based
- 6.1.4. Polystyrene-Based
- 6.1.5. Others
- 6.2. Market Analysis, Insights and Forecast - by Application
- 6.2.1. Cell Therapy
- 6.2.2. Vaccine Manufacturing
- 6.2.3. Other Applications
- 6.1. Market Analysis, Insights and Forecast - by Material Type
- 7. North America Microcarrier Industry Analysis, Insights and Forecast, 2020-2032
- 7.1. Market Analysis, Insights and Forecast - by Material Type
- 7.1.1. Alginate-Based
- 7.1.2. Collagen-Based
- 7.1.3. Dextran-Based
- 7.1.4. Polystyrene-Based
- 7.1.5. Others
- 7.2. Market Analysis, Insights and Forecast - by Application
- 7.2.1. Cell Therapy
- 7.2.2. Vaccine Manufacturing
- 7.2.3. Other Applications
- 7.1. Market Analysis, Insights and Forecast - by Material Type
- 8. Europe Microcarrier Industry Analysis, Insights and Forecast, 2020-2032
- 8.1. Market Analysis, Insights and Forecast - by Material Type
- 8.1.1. Alginate-Based
- 8.1.2. Collagen-Based
- 8.1.3. Dextran-Based
- 8.1.4. Polystyrene-Based
- 8.1.5. Others
- 8.2. Market Analysis, Insights and Forecast - by Application
- 8.2.1. Cell Therapy
- 8.2.2. Vaccine Manufacturing
- 8.2.3. Other Applications
- 8.1. Market Analysis, Insights and Forecast - by Material Type
- 9. Asia Pacific Microcarrier Industry Analysis, Insights and Forecast, 2020-2032
- 9.1. Market Analysis, Insights and Forecast - by Material Type
- 9.1.1. Alginate-Based
- 9.1.2. Collagen-Based
- 9.1.3. Dextran-Based
- 9.1.4. Polystyrene-Based
- 9.1.5. Others
- 9.2. Market Analysis, Insights and Forecast - by Application
- 9.2.1. Cell Therapy
- 9.2.2. Vaccine Manufacturing
- 9.2.3. Other Applications
- 9.1. Market Analysis, Insights and Forecast - by Material Type
- 10. Middle East and Africa Microcarrier Industry Analysis, Insights and Forecast, 2020-2032
- 10.1. Market Analysis, Insights and Forecast - by Material Type
- 10.1.1. Alginate-Based
- 10.1.2. Collagen-Based
- 10.1.3. Dextran-Based
- 10.1.4. Polystyrene-Based
- 10.1.5. Others
- 10.2. Market Analysis, Insights and Forecast - by Application
- 10.2.1. Cell Therapy
- 10.2.2. Vaccine Manufacturing
- 10.2.3. Other Applications
- 10.1. Market Analysis, Insights and Forecast - by Material Type
- 11. South America Microcarrier Industry Analysis, Insights and Forecast, 2020-2032
- 11.1. Market Analysis, Insights and Forecast - by Material Type
- 11.1.1. Alginate-Based
- 11.1.2. Collagen-Based
- 11.1.3. Dextran-Based
- 11.1.4. Polystyrene-Based
- 11.1.5. Others
- 11.2. Market Analysis, Insights and Forecast - by Application
- 11.2.1. Cell Therapy
- 11.2.2. Vaccine Manufacturing
- 11.2.3. Other Applications
- 11.1. Market Analysis, Insights and Forecast - by Material Type
- 12. Competitive Analysis
- 12.1. Company Profiles
- 12.1.1 Merck KGaA
- 12.1.1.1. Company Overview
- 12.1.1.2. Products
- 12.1.1.3. Company Financials
- 12.1.1.4. SWOT Analysis
- 12.1.2 Thermo Fisher Scientific Inc
- 12.1.2.1. Company Overview
- 12.1.2.2. Products
- 12.1.2.3. Company Financials
- 12.1.2.4. SWOT Analysis
- 12.1.3 Eppendorf AG
- 12.1.3.1. Company Overview
- 12.1.3.2. Products
- 12.1.3.3. Company Financials
- 12.1.3.4. SWOT Analysis
- 12.1.4 Danaher Corporation
- 12.1.4.1. Company Overview
- 12.1.4.2. Products
- 12.1.4.3. Company Financials
- 12.1.4.4. SWOT Analysis
- 12.1.5 VWR International LLC
- 12.1.5.1. Company Overview
- 12.1.5.2. Products
- 12.1.5.3. Company Financials
- 12.1.5.4. SWOT Analysis
- 12.1.6 Lonza Group Ltd
- 12.1.6.1. Company Overview
- 12.1.6.2. Products
- 12.1.6.3. Company Financials
- 12.1.6.4. SWOT Analysis
- 12.1.7 Sartorius AG
- 12.1.7.1. Company Overview
- 12.1.7.2. Products
- 12.1.7.3. Company Financials
- 12.1.7.4. SWOT Analysis
- 12.1.1 Merck KGaA
- 12.2. Market Entropy
- 12.2.1 Company's Key Areas Served
- 12.2.2 Recent Developments
- 12.3. Company Market Share Analysis 2025
- 12.3.1 Top 5 Companies Market Share Analysis
- 12.3.2 Top 3 Companies Market Share Analysis
- 12.4. List of Potential Customers
- 13. Research Methodology
List of Figures
- Figure 1: Global Microcarrier Industry Revenue Breakdown (Million, %) by Region 2025 & 2033
- Figure 2: North America Microcarrier Industry Revenue (Million), by Material Type 2025 & 2033
- Figure 3: North America Microcarrier Industry Revenue Share (%), by Material Type 2025 & 2033
- Figure 4: North America Microcarrier Industry Revenue (Million), by Application 2025 & 2033
- Figure 5: North America Microcarrier Industry Revenue Share (%), by Application 2025 & 2033
- Figure 6: North America Microcarrier Industry Revenue (Million), by Country 2025 & 2033
- Figure 7: North America Microcarrier Industry Revenue Share (%), by Country 2025 & 2033
- Figure 8: Europe Microcarrier Industry Revenue (Million), by Material Type 2025 & 2033
- Figure 9: Europe Microcarrier Industry Revenue Share (%), by Material Type 2025 & 2033
- Figure 10: Europe Microcarrier Industry Revenue (Million), by Application 2025 & 2033
- Figure 11: Europe Microcarrier Industry Revenue Share (%), by Application 2025 & 2033
- Figure 12: Europe Microcarrier Industry Revenue (Million), by Country 2025 & 2033
- Figure 13: Europe Microcarrier Industry Revenue Share (%), by Country 2025 & 2033
- Figure 14: Asia Pacific Microcarrier Industry Revenue (Million), by Material Type 2025 & 2033
- Figure 15: Asia Pacific Microcarrier Industry Revenue Share (%), by Material Type 2025 & 2033
- Figure 16: Asia Pacific Microcarrier Industry Revenue (Million), by Application 2025 & 2033
- Figure 17: Asia Pacific Microcarrier Industry Revenue Share (%), by Application 2025 & 2033
- Figure 18: Asia Pacific Microcarrier Industry Revenue (Million), by Country 2025 & 2033
- Figure 19: Asia Pacific Microcarrier Industry Revenue Share (%), by Country 2025 & 2033
- Figure 20: Middle East and Africa Microcarrier Industry Revenue (Million), by Material Type 2025 & 2033
- Figure 21: Middle East and Africa Microcarrier Industry Revenue Share (%), by Material Type 2025 & 2033
- Figure 22: Middle East and Africa Microcarrier Industry Revenue (Million), by Application 2025 & 2033
- Figure 23: Middle East and Africa Microcarrier Industry Revenue Share (%), by Application 2025 & 2033
- Figure 24: Middle East and Africa Microcarrier Industry Revenue (Million), by Country 2025 & 2033
- Figure 25: Middle East and Africa Microcarrier Industry Revenue Share (%), by Country 2025 & 2033
- Figure 26: South America Microcarrier Industry Revenue (Million), by Material Type 2025 & 2033
- Figure 27: South America Microcarrier Industry Revenue Share (%), by Material Type 2025 & 2033
- Figure 28: South America Microcarrier Industry Revenue (Million), by Application 2025 & 2033
- Figure 29: South America Microcarrier Industry Revenue Share (%), by Application 2025 & 2033
- Figure 30: South America Microcarrier Industry Revenue (Million), by Country 2025 & 2033
- Figure 31: South America Microcarrier Industry Revenue Share (%), by Country 2025 & 2033
List of Tables
- Table 1: Global Microcarrier Industry Revenue Million Forecast, by Material Type 2020 & 2033
- Table 2: Global Microcarrier Industry Revenue Million Forecast, by Application 2020 & 2033
- Table 3: Global Microcarrier Industry Revenue Million Forecast, by Region 2020 & 2033
- Table 4: Global Microcarrier Industry Revenue Million Forecast, by Material Type 2020 & 2033
- Table 5: Global Microcarrier Industry Revenue Million Forecast, by Application 2020 & 2033
- Table 6: Global Microcarrier Industry Revenue Million Forecast, by Country 2020 & 2033
- Table 7: United States Microcarrier Industry Revenue (Million) Forecast, by Application 2020 & 2033
- Table 8: Canada Microcarrier Industry Revenue (Million) Forecast, by Application 2020 & 2033
- Table 9: Mexico Microcarrier Industry Revenue (Million) Forecast, by Application 2020 & 2033
- Table 10: Global Microcarrier Industry Revenue Million Forecast, by Material Type 2020 & 2033
- Table 11: Global Microcarrier Industry Revenue Million Forecast, by Application 2020 & 2033
- Table 12: Global Microcarrier Industry Revenue Million Forecast, by Country 2020 & 2033
- Table 13: Germany Microcarrier Industry Revenue (Million) Forecast, by Application 2020 & 2033
- Table 14: United Kingdom Microcarrier Industry Revenue (Million) Forecast, by Application 2020 & 2033
- Table 15: France Microcarrier Industry Revenue (Million) Forecast, by Application 2020 & 2033
- Table 16: Italy Microcarrier Industry Revenue (Million) Forecast, by Application 2020 & 2033
- Table 17: Spain Microcarrier Industry Revenue (Million) Forecast, by Application 2020 & 2033
- Table 18: Rest of Europe Microcarrier Industry Revenue (Million) Forecast, by Application 2020 & 2033
- Table 19: Global Microcarrier Industry Revenue Million Forecast, by Material Type 2020 & 2033
- Table 20: Global Microcarrier Industry Revenue Million Forecast, by Application 2020 & 2033
- Table 21: Global Microcarrier Industry Revenue Million Forecast, by Country 2020 & 2033
- Table 22: China Microcarrier Industry Revenue (Million) Forecast, by Application 2020 & 2033
- Table 23: Japan Microcarrier Industry Revenue (Million) Forecast, by Application 2020 & 2033
- Table 24: India Microcarrier Industry Revenue (Million) Forecast, by Application 2020 & 2033
- Table 25: Australia Microcarrier Industry Revenue (Million) Forecast, by Application 2020 & 2033
- Table 26: South Korea Microcarrier Industry Revenue (Million) Forecast, by Application 2020 & 2033
- Table 27: Rest of Asia Pacific Microcarrier Industry Revenue (Million) Forecast, by Application 2020 & 2033
- Table 28: Global Microcarrier Industry Revenue Million Forecast, by Material Type 2020 & 2033
- Table 29: Global Microcarrier Industry Revenue Million Forecast, by Application 2020 & 2033
- Table 30: Global Microcarrier Industry Revenue Million Forecast, by Country 2020 & 2033
- Table 31: GCC Microcarrier Industry Revenue (Million) Forecast, by Application 2020 & 2033
- Table 32: South Africa Microcarrier Industry Revenue (Million) Forecast, by Application 2020 & 2033
- Table 33: Rest of Middle East and Africa Microcarrier Industry Revenue (Million) Forecast, by Application 2020 & 2033
- Table 34: Global Microcarrier Industry Revenue Million Forecast, by Material Type 2020 & 2033
- Table 35: Global Microcarrier Industry Revenue Million Forecast, by Application 2020 & 2033
- Table 36: Global Microcarrier Industry Revenue Million Forecast, by Country 2020 & 2033
- Table 37: Brazil Microcarrier Industry Revenue (Million) Forecast, by Application 2020 & 2033
- Table 38: Argentina Microcarrier Industry Revenue (Million) Forecast, by Application 2020 & 2033
- Table 39: Rest of South America Microcarrier Industry Revenue (Million) Forecast, by Application 2020 & 2033
Frequently Asked Questions
1. What is the projected Compound Annual Growth Rate (CAGR) of the Microcarrier Industry?
The projected CAGR is approximately 5.82%.
2. Which companies are prominent players in the Microcarrier Industry?
Key companies in the market include Merck KGaA, Thermo Fisher Scientific Inc, Eppendorf AG, Danaher Corporation, VWR International LLC, Lonza Group Ltd, Sartorius AG.
3. What are the main segments of the Microcarrier Industry?
The market segments include Material Type, Application.
4. Can you provide details about the market size?
The market size is estimated to be USD 2.03 Million as of 2022.
5. What are some drivers contributing to market growth?
; Rising Demand for Cell-based Vaccines and Therapeutics; Rapid Growth of Biologics and Biosimilar Industry; Increasing R&D and Availability of Funding for Cell Therapy Research.
6. What are the notable trends driving market growth?
Cell Therapy is Expected to Show Fastest Growth by Application. Over the Forecast Period.
7. Are there any restraints impacting market growth?
; High Cost of Biologics and Cell-based Therapies; Possible Drawbacks of Microcarrier Cultures.
8. Can you provide examples of recent developments in the market?
N/A
9. What pricing options are available for accessing the report?
Pricing options include single-user, multi-user, and enterprise licenses priced at USD 4750, USD 5250, and USD 8750 respectively.
10. Is the market size provided in terms of value or volume?
The market size is provided in terms of value, measured in Million.
11. Are there any specific market keywords associated with the report?
Yes, the market keyword associated with the report is "Microcarrier Industry," which aids in identifying and referencing the specific market segment covered.
12. How do I determine which pricing option suits my needs best?
The pricing options vary based on user requirements and access needs. Individual users may opt for single-user licenses, while businesses requiring broader access may choose multi-user or enterprise licenses for cost-effective access to the report.
13. Are there any additional resources or data provided in the Microcarrier Industry report?
While the report offers comprehensive insights, it's advisable to review the specific contents or supplementary materials provided to ascertain if additional resources or data are available.
14. How can I stay updated on further developments or reports in the Microcarrier Industry?
To stay informed about further developments, trends, and reports in the Microcarrier Industry, consider subscribing to industry newsletters, following relevant companies and organizations, or regularly checking reputable industry news sources and publications.
Methodology
Step 1 - Identification of Relevant Samples Size from Population Database


Step 2 - Approaches for Defining Global Market Size (Value, Volume* & Price*)

Note*: In applicable scenarios
Step 3 - Data Sources
Primary Research
- Web Analytics
- Survey Reports
- Research Institute
- Latest Research Reports
- Opinion Leaders
Secondary Research
- Annual Reports
- White Paper
- Latest Press Release
- Industry Association
- Paid Database
- Investor Presentations

Step 4 - Data Triangulation
Involves using different sources of information in order to increase the validity of a study
These sources are likely to be stakeholders in a program - participants, other researchers, program staff, other community members, and so on.
Then we put all data in single framework & apply various statistical tools to find out the dynamic on the market.
During the analysis stage, feedback from the stakeholder groups would be compared to determine areas of agreement as well as areas of divergence

