
Key Insights
The global photopheresis products market is experiencing robust growth, driven by the increasing prevalence of autoimmune diseases and the rising number of organ transplant procedures. A compound annual growth rate (CAGR) of 5.30% from 2019 to 2024 suggests a significant market expansion. This growth is further fueled by advancements in photopheresis technology, leading to improved treatment efficacy and patient outcomes. The market is segmented by application (graft-versus-host disease, cutaneous T-cell lymphoma, transplant rejections, autoimmune diseases), end-user (hospitals, ambulatory centers), and product type (open and closed systems). Hospitals currently represent the largest end-user segment, owing to their comprehensive treatment capabilities and established infrastructure. However, the increasing preference for outpatient procedures is expected to drive growth in the ambulatory centers segment. The closed system segment is likely to witness faster growth due to advantages like reduced risk of contamination and improved ease of use. While North America currently holds a significant market share due to high healthcare expenditure and technological advancements, the Asia-Pacific region is anticipated to experience substantial growth in the coming years, propelled by rising healthcare awareness and increasing disposable incomes. Market restraints include the high cost of photopheresis procedures, limited reimbursement policies in some regions, and the availability of alternative treatment options. However, ongoing research and development efforts focused on improving the efficacy and accessibility of photopheresis technologies are expected to mitigate these challenges and continue driving market expansion.
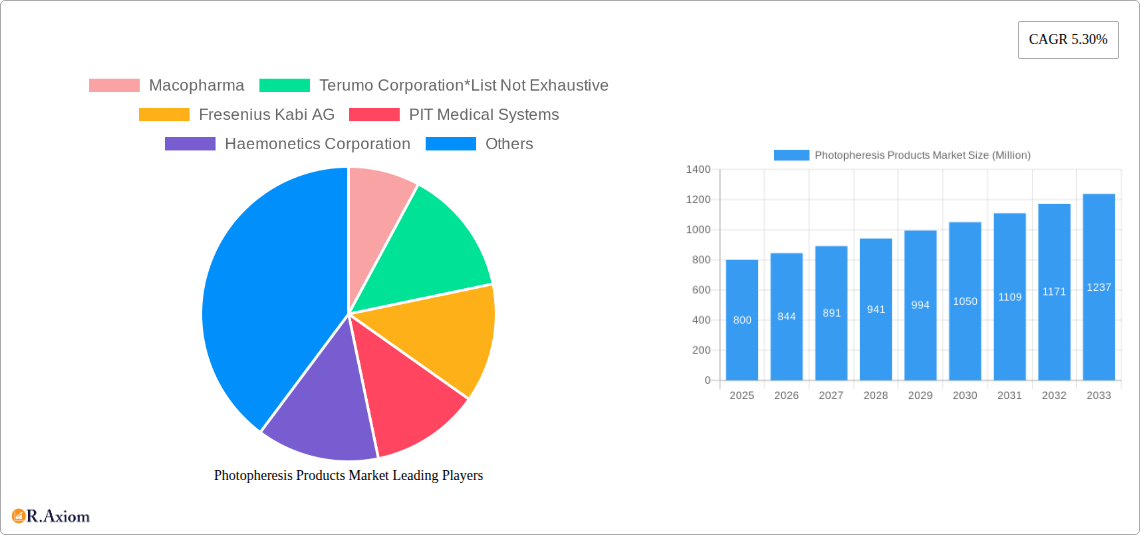
The competitive landscape is relatively consolidated, with major players such as Macopharma, Terumo Corporation, Fresenius Kabi AG, PIT Medical Systems, Haemonetics Corporation, and Mallinckrodt Pharmaceuticals holding significant market share. These companies are engaged in strategic collaborations, product development, and expansion activities to maintain their market positions and capitalize on the growing demand. Future growth will likely be shaped by factors such as technological innovations, regulatory approvals for new applications, and the development of more cost-effective treatment protocols. The increasing focus on personalized medicine further presents an opportunity for targeted therapies employing photopheresis, potentially expanding the market's reach and impact.
This in-depth report provides a comprehensive analysis of the Photopheresis Products Market, offering valuable insights for industry stakeholders, investors, and strategic decision-makers. Covering the period from 2019 to 2033, with a base year of 2025 and a forecast period of 2025-2033, this report delves into market dynamics, growth drivers, challenges, and future opportunities. The report segments the market by application, end-user, and product type, providing granular data and analysis for informed strategic planning.
Photopheresis Products Market Concentration & Innovation
The Photopheresis Products market exhibits a moderately concentrated landscape, with key players like Macopharma, Terumo Corporation, Fresenius Kabi AG, PIT Medical Systems, Haemonetics Corporation, and Mallinckrodt Pharmaceuticals holding significant market share. Precise market share figures are unavailable for all companies without further market research. However, existing data suggests a combined market share of approximately xx% for these leading companies in 2024. This concentration is driven by significant investments in R&D and the complex regulatory environment surrounding medical devices. Innovation within the market is focused on the development of closed systems, reducing the risk of contamination, and improving the efficiency of the photopheresis process. The regulatory landscape plays a crucial role, requiring stringent approvals and adherence to safety guidelines, thus raising the barrier to entry for new players. Product substitutes are currently limited, primarily due to the highly specific nature of photopheresis in treating certain diseases. The observed M&A activity, while not extensively documented in terms of deal values, suggests a trend toward consolidation within the sector, driven by the search for economies of scale and broader market reach. End-user trends reflect a growing demand for closed systems and improved efficacy, particularly in specialized healthcare settings like transplant centers and advanced oncology units.
Photopheresis Products Market Industry Trends & Insights
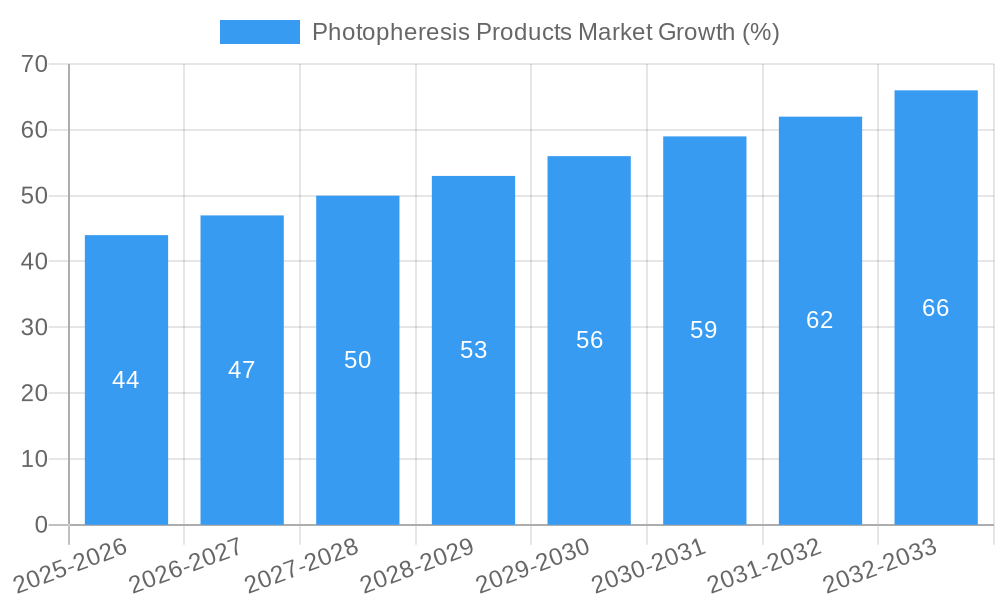
The Photopheresis Products market is experiencing significant growth, driven by several factors. The increasing prevalence of diseases like graft-versus-host disease (GvHD), cutaneous T-cell lymphoma (CTCL), and autoimmune disorders is a primary catalyst. Technological advancements, specifically the development of closed photopheresis systems, are improving safety and efficiency, driving adoption rates. Furthermore, rising healthcare expenditure globally, particularly in developed nations, is fueling market expansion. The consumer preference is shifting towards closed systems due to their inherent safety advantages, leading to an increase in the market share of this product type. Competitive dynamics are shaped by companies investing in R&D to enhance product features and gain a competitive edge through improved efficacy and ease of use. The market is projected to exhibit a Compound Annual Growth Rate (CAGR) of xx% during the forecast period (2025-2033), with market penetration expected to reach xx% by 2033. This growth trajectory anticipates the continued expansion of the photopheresis market across both developed and emerging economies.
Dominant Markets & Segments in Photopheresis Products Market
By Application: Graft-versus-host disease (GvHD) currently represents the largest application segment, driven by its high prevalence and the effectiveness of photopheresis in managing its complications. Cutaneous T-cell lymphoma (CTCL) is also a significant segment, with ongoing research and development contributing to market growth.
By End-User: Hospitals remain the dominant end-user segment, owing to their comprehensive infrastructure and specialized medical personnel. Ambulatory centers are also showing substantial growth, offering patients convenient access to photopheresis treatments.
By Product Type: The closed system segment is projected to hold the largest market share in the coming years, fueled by a strong preference for safer and more efficient treatment protocols. However, open systems continue to maintain a presence, particularly in regions with less developed healthcare infrastructure.
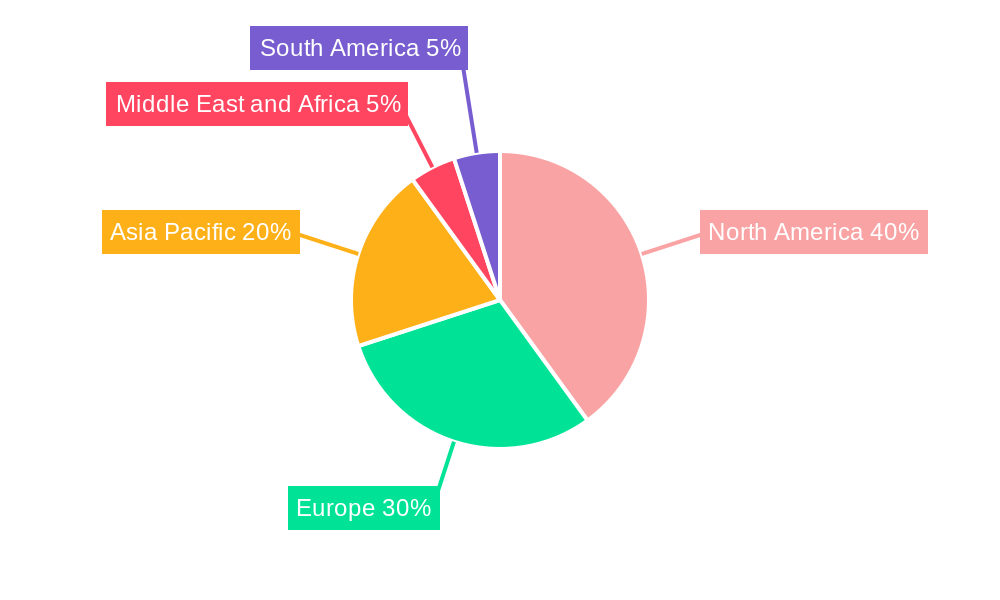
The North American market currently dominates the global photopheresis products market, primarily due to high healthcare spending, well-established healthcare infrastructure, and a significant prevalence of target diseases. Key drivers in this region include favorable reimbursement policies, extensive research and development activities, and a strong regulatory framework that supports the adoption of new technologies. Europe follows as a significant market, demonstrating considerable growth potential driven by increasing prevalence of autoimmune diseases and expanding healthcare investments.
Photopheresis Products Market Product Developments
Recent product innovations include the development of closed systems for photopheresis, offering improved safety and reduced contamination risks compared to open systems. These advancements are enhancing the efficiency and streamlining the photopheresis procedure. The improved instruments minimize operator intervention, leading to cost-effectiveness and reduced procedural time. The market fit for these enhanced products is positive, reflecting strong adoption by hospitals and ambulatory centers. Technological trends indicate a continued focus on closed systems and integration with other medical technologies to improve workflow efficiency within healthcare settings.
Report Scope & Segmentation Analysis
This report segments the Photopheresis Products market across several key parameters:
By Application: Graft versus Host Disease, Cutaneous T-Cell Lymphoma, Transplant Rejections, Autoimmune Diseases. Each segment's growth is projected based on disease prevalence and treatment adoption rates. Competitive dynamics vary across segments, reflecting the unique characteristics and therapeutic needs of each condition.
By End-User: Hospitals, Ambulatory Centers, Other End-Users. Market sizes are differentiated based on the volume of treatments performed in each setting. Competitive dynamics are influenced by the infrastructure and specialized services required for photopheresis delivery.
By Product Type: Open System, Closed System. Growth projections reflect the increasing preference for closed systems due to safety benefits, and market sizes are estimated based on sales data and adoption trends. Competitive dynamics are driven by innovation and technological advancements within each product category.
Key Drivers of Photopheresis Products Market Growth
The Photopheresis Products market is propelled by the rising prevalence of GvHD, CTCL, and other autoimmune disorders. Technological advancements, including the development of closed systems, enhance safety and efficacy, driving market expansion. Furthermore, growing healthcare expenditure, particularly in developed economies, fuels demand. Favorable reimbursement policies and government initiatives also contribute to market growth.
Challenges in the Photopheresis Products Market Sector
Challenges include the high cost of photopheresis treatments and stringent regulatory approvals. Supply chain disruptions can also impact product availability. Intense competition among established players poses a hurdle for new entrants. The overall market dynamics are impacted by the unpredictable demand based on the incidence of the diseases this technology serves to treat.
Emerging Opportunities in Photopheresis Products Market
Emerging opportunities lie in untapped markets in developing economies, the development of new applications for photopheresis, and advancements in closed-system technology. Technological innovation, including automation and integration with other diagnostic tools, offers significant potential. Personalized medicine approaches tailored to specific patient populations represent another area of growth.
Leading Players in the Photopheresis Products Market Market
- Macopharma
- Terumo Corporation
- Fresenius Kabi AG
- PIT Medical Systems
- Haemonetics Corporation
- Mallinckrodt Pharmaceuticals
Key Developments in Photopheresis Products Market Industry
September 2022: The UAE opened a new apheresis unit at Sheikh Shakhbout Medical City (SSMC), expanding treatment capabilities for diseases such as rare skin lymphoma. This development signifies an increased investment in advanced medical technologies within the region, driving market growth.
August 2022: Ikaria Australia Pty Ltd (Mallinckrodt Pharmaceuticals) launched the THERAKOS CELLEX Photopheresis System in Australia. This launch showcases market expansion and increased accessibility to closed-system photopheresis technology. This improves treatment options and increases market penetration within Australia.
Strategic Outlook for Photopheresis Products Market Market
The Photopheresis Products market exhibits significant growth potential driven by technological advancements, rising disease prevalence, and increasing healthcare spending. Future opportunities lie in expanding into new markets, developing novel applications, and focusing on personalized medicine approaches. Companies need to remain innovative and adapt to the evolving regulatory landscape to capture market share and maintain a competitive edge.
Photopheresis Products Market Segmentation
-
1. Product Type
- 1.1. Open System
- 1.2. Closed System
-
2. Application
- 2.1. Graft versus Host Disease
- 2.2. Cutaneous T-Cell Lymphoma
- 2.3. Transplant Rejections
- 2.4. Autoimmune Diseases
-
3. End User
- 3.1. Hospitals
- 3.2. Ambulatory Centers
- 3.3. Other End Users
Photopheresis Products Market Segmentation By Geography
-
1. North America
- 1.1. United States
- 1.2. Canada
- 1.3. Mexico
-
2. Europe
- 2.1. Germany
- 2.2. United Kingdom
- 2.3. France
- 2.4. Italy
- 2.5. Spain
- 2.6. Rest of Europe
-
3. Asia Pacific
- 3.1. China
- 3.2. Japan
- 3.3. India
- 3.4. Australia
- 3.5. South Korea
- 3.6. Rest of Asia Pacific
-
4. Middle East and Africa
- 4.1. GCC
- 4.2. South Africa
- 4.3. Rest of Middle East and Africa
-
5. South America
- 5.1. Brazil
- 5.2. Argentina
- 5.3. Rest of South America
Photopheresis Products Market REPORT HIGHLIGHTS
| Aspects | Details |
|---|---|
| Study Period | 2019-2033 |
| Base Year | 2024 |
| Estimated Year | 2025 |
| Forecast Period | 2025-2033 |
| Historical Period | 2019-2024 |
| Growth Rate | CAGR of 5.30% from 2019-2033 |
| Segmentation |
|
Table of Contents
- 1. Introduction
- 1.1. Research Scope
- 1.2. Market Segmentation
- 1.3. Research Methodology
- 1.4. Definitions and Assumptions
- 2. Executive Summary
- 2.1. Introduction
- 3. Market Dynamics
- 3.1. Introduction
- 3.2. Market Drivers
- 3.2.1. Rise in Prevalence of Autoimmune Diseases; Increasing Technological Advancements
- 3.3. Market Restrains
- 3.3.1. Low Adoption of Photopheresis in Pediatric Patients and Lack of Skilled Professionals
- 3.4. Market Trends
- 3.4.1. Chronic Graft Versus Host Disease (GvHD) is Expected to Hold a Significant Market Share in the Market Studied.
- 4. Market Factor Analysis
- 4.1. Porters Five Forces
- 4.2. Supply/Value Chain
- 4.3. PESTEL analysis
- 4.4. Market Entropy
- 4.5. Patent/Trademark Analysis
- 5. Global Photopheresis Products Market Analysis, Insights and Forecast, 2019-2031
- 5.1. Market Analysis, Insights and Forecast - by Product Type
- 5.1.1. Open System
- 5.1.2. Closed System
- 5.2. Market Analysis, Insights and Forecast - by Application
- 5.2.1. Graft versus Host Disease
- 5.2.2. Cutaneous T-Cell Lymphoma
- 5.2.3. Transplant Rejections
- 5.2.4. Autoimmune Diseases
- 5.3. Market Analysis, Insights and Forecast - by End User
- 5.3.1. Hospitals
- 5.3.2. Ambulatory Centers
- 5.3.3. Other End Users
- 5.4. Market Analysis, Insights and Forecast - by Region
- 5.4.1. North America
- 5.4.2. Europe
- 5.4.3. Asia Pacific
- 5.4.4. Middle East and Africa
- 5.4.5. South America
- 5.1. Market Analysis, Insights and Forecast - by Product Type
- 6. North America Photopheresis Products Market Analysis, Insights and Forecast, 2019-2031
- 6.1. Market Analysis, Insights and Forecast - by Product Type
- 6.1.1. Open System
- 6.1.2. Closed System
- 6.2. Market Analysis, Insights and Forecast - by Application
- 6.2.1. Graft versus Host Disease
- 6.2.2. Cutaneous T-Cell Lymphoma
- 6.2.3. Transplant Rejections
- 6.2.4. Autoimmune Diseases
- 6.3. Market Analysis, Insights and Forecast - by End User
- 6.3.1. Hospitals
- 6.3.2. Ambulatory Centers
- 6.3.3. Other End Users
- 6.1. Market Analysis, Insights and Forecast - by Product Type
- 7. Europe Photopheresis Products Market Analysis, Insights and Forecast, 2019-2031
- 7.1. Market Analysis, Insights and Forecast - by Product Type
- 7.1.1. Open System
- 7.1.2. Closed System
- 7.2. Market Analysis, Insights and Forecast - by Application
- 7.2.1. Graft versus Host Disease
- 7.2.2. Cutaneous T-Cell Lymphoma
- 7.2.3. Transplant Rejections
- 7.2.4. Autoimmune Diseases
- 7.3. Market Analysis, Insights and Forecast - by End User
- 7.3.1. Hospitals
- 7.3.2. Ambulatory Centers
- 7.3.3. Other End Users
- 7.1. Market Analysis, Insights and Forecast - by Product Type
- 8. Asia Pacific Photopheresis Products Market Analysis, Insights and Forecast, 2019-2031
- 8.1. Market Analysis, Insights and Forecast - by Product Type
- 8.1.1. Open System
- 8.1.2. Closed System
- 8.2. Market Analysis, Insights and Forecast - by Application
- 8.2.1. Graft versus Host Disease
- 8.2.2. Cutaneous T-Cell Lymphoma
- 8.2.3. Transplant Rejections
- 8.2.4. Autoimmune Diseases
- 8.3. Market Analysis, Insights and Forecast - by End User
- 8.3.1. Hospitals
- 8.3.2. Ambulatory Centers
- 8.3.3. Other End Users
- 8.1. Market Analysis, Insights and Forecast - by Product Type
- 9. Middle East and Africa Photopheresis Products Market Analysis, Insights and Forecast, 2019-2031
- 9.1. Market Analysis, Insights and Forecast - by Product Type
- 9.1.1. Open System
- 9.1.2. Closed System
- 9.2. Market Analysis, Insights and Forecast - by Application
- 9.2.1. Graft versus Host Disease
- 9.2.2. Cutaneous T-Cell Lymphoma
- 9.2.3. Transplant Rejections
- 9.2.4. Autoimmune Diseases
- 9.3. Market Analysis, Insights and Forecast - by End User
- 9.3.1. Hospitals
- 9.3.2. Ambulatory Centers
- 9.3.3. Other End Users
- 9.1. Market Analysis, Insights and Forecast - by Product Type
- 10. South America Photopheresis Products Market Analysis, Insights and Forecast, 2019-2031
- 10.1. Market Analysis, Insights and Forecast - by Product Type
- 10.1.1. Open System
- 10.1.2. Closed System
- 10.2. Market Analysis, Insights and Forecast - by Application
- 10.2.1. Graft versus Host Disease
- 10.2.2. Cutaneous T-Cell Lymphoma
- 10.2.3. Transplant Rejections
- 10.2.4. Autoimmune Diseases
- 10.3. Market Analysis, Insights and Forecast - by End User
- 10.3.1. Hospitals
- 10.3.2. Ambulatory Centers
- 10.3.3. Other End Users
- 10.1. Market Analysis, Insights and Forecast - by Product Type
- 11. North America Photopheresis Products Market Analysis, Insights and Forecast, 2019-2031
- 11.1. Market Analysis, Insights and Forecast - By Country/Sub-region
- 11.1.1 United States
- 11.1.2 Canada
- 11.1.3 Mexico
- 12. Europe Photopheresis Products Market Analysis, Insights and Forecast, 2019-2031
- 12.1. Market Analysis, Insights and Forecast - By Country/Sub-region
- 12.1.1 Germany
- 12.1.2 United Kingdom
- 12.1.3 France
- 12.1.4 Italy
- 12.1.5 Spain
- 12.1.6 Rest of Europe
- 13. Asia Pacific Photopheresis Products Market Analysis, Insights and Forecast, 2019-2031
- 13.1. Market Analysis, Insights and Forecast - By Country/Sub-region
- 13.1.1 China
- 13.1.2 Japan
- 13.1.3 India
- 13.1.4 Australia
- 13.1.5 South Korea
- 13.1.6 Rest of Asia Pacific
- 14. Middle East and Africa Photopheresis Products Market Analysis, Insights and Forecast, 2019-2031
- 14.1. Market Analysis, Insights and Forecast - By Country/Sub-region
- 14.1.1 GCC
- 14.1.2 South Africa
- 14.1.3 Rest of Middle East and Africa
- 15. South America Photopheresis Products Market Analysis, Insights and Forecast, 2019-2031
- 15.1. Market Analysis, Insights and Forecast - By Country/Sub-region
- 15.1.1 Brazil
- 15.1.2 Argentina
- 15.1.3 Rest of South America
- 16. Competitive Analysis
- 16.1. Global Market Share Analysis 2024
- 16.2. Company Profiles
- 16.2.1 Macopharma
- 16.2.1.1. Overview
- 16.2.1.2. Products
- 16.2.1.3. SWOT Analysis
- 16.2.1.4. Recent Developments
- 16.2.1.5. Financials (Based on Availability)
- 16.2.2 Terumo Corporation*List Not Exhaustive
- 16.2.2.1. Overview
- 16.2.2.2. Products
- 16.2.2.3. SWOT Analysis
- 16.2.2.4. Recent Developments
- 16.2.2.5. Financials (Based on Availability)
- 16.2.3 Fresenius Kabi AG
- 16.2.3.1. Overview
- 16.2.3.2. Products
- 16.2.3.3. SWOT Analysis
- 16.2.3.4. Recent Developments
- 16.2.3.5. Financials (Based on Availability)
- 16.2.4 PIT Medical Systems
- 16.2.4.1. Overview
- 16.2.4.2. Products
- 16.2.4.3. SWOT Analysis
- 16.2.4.4. Recent Developments
- 16.2.4.5. Financials (Based on Availability)
- 16.2.5 Haemonetics Corporation
- 16.2.5.1. Overview
- 16.2.5.2. Products
- 16.2.5.3. SWOT Analysis
- 16.2.5.4. Recent Developments
- 16.2.5.5. Financials (Based on Availability)
- 16.2.6 Mallinckrodt Pharmaceuticals
- 16.2.6.1. Overview
- 16.2.6.2. Products
- 16.2.6.3. SWOT Analysis
- 16.2.6.4. Recent Developments
- 16.2.6.5. Financials (Based on Availability)
- 16.2.1 Macopharma
List of Figures
- Figure 1: Global Photopheresis Products Market Revenue Breakdown (Million, %) by Region 2024 & 2032
- Figure 2: North America Photopheresis Products Market Revenue (Million), by Country 2024 & 2032
- Figure 3: North America Photopheresis Products Market Revenue Share (%), by Country 2024 & 2032
- Figure 4: Europe Photopheresis Products Market Revenue (Million), by Country 2024 & 2032
- Figure 5: Europe Photopheresis Products Market Revenue Share (%), by Country 2024 & 2032
- Figure 6: Asia Pacific Photopheresis Products Market Revenue (Million), by Country 2024 & 2032
- Figure 7: Asia Pacific Photopheresis Products Market Revenue Share (%), by Country 2024 & 2032
- Figure 8: Middle East and Africa Photopheresis Products Market Revenue (Million), by Country 2024 & 2032
- Figure 9: Middle East and Africa Photopheresis Products Market Revenue Share (%), by Country 2024 & 2032
- Figure 10: South America Photopheresis Products Market Revenue (Million), by Country 2024 & 2032
- Figure 11: South America Photopheresis Products Market Revenue Share (%), by Country 2024 & 2032
- Figure 12: North America Photopheresis Products Market Revenue (Million), by Product Type 2024 & 2032
- Figure 13: North America Photopheresis Products Market Revenue Share (%), by Product Type 2024 & 2032
- Figure 14: North America Photopheresis Products Market Revenue (Million), by Application 2024 & 2032
- Figure 15: North America Photopheresis Products Market Revenue Share (%), by Application 2024 & 2032
- Figure 16: North America Photopheresis Products Market Revenue (Million), by End User 2024 & 2032
- Figure 17: North America Photopheresis Products Market Revenue Share (%), by End User 2024 & 2032
- Figure 18: North America Photopheresis Products Market Revenue (Million), by Country 2024 & 2032
- Figure 19: North America Photopheresis Products Market Revenue Share (%), by Country 2024 & 2032
- Figure 20: Europe Photopheresis Products Market Revenue (Million), by Product Type 2024 & 2032
- Figure 21: Europe Photopheresis Products Market Revenue Share (%), by Product Type 2024 & 2032
- Figure 22: Europe Photopheresis Products Market Revenue (Million), by Application 2024 & 2032
- Figure 23: Europe Photopheresis Products Market Revenue Share (%), by Application 2024 & 2032
- Figure 24: Europe Photopheresis Products Market Revenue (Million), by End User 2024 & 2032
- Figure 25: Europe Photopheresis Products Market Revenue Share (%), by End User 2024 & 2032
- Figure 26: Europe Photopheresis Products Market Revenue (Million), by Country 2024 & 2032
- Figure 27: Europe Photopheresis Products Market Revenue Share (%), by Country 2024 & 2032
- Figure 28: Asia Pacific Photopheresis Products Market Revenue (Million), by Product Type 2024 & 2032
- Figure 29: Asia Pacific Photopheresis Products Market Revenue Share (%), by Product Type 2024 & 2032
- Figure 30: Asia Pacific Photopheresis Products Market Revenue (Million), by Application 2024 & 2032
- Figure 31: Asia Pacific Photopheresis Products Market Revenue Share (%), by Application 2024 & 2032
- Figure 32: Asia Pacific Photopheresis Products Market Revenue (Million), by End User 2024 & 2032
- Figure 33: Asia Pacific Photopheresis Products Market Revenue Share (%), by End User 2024 & 2032
- Figure 34: Asia Pacific Photopheresis Products Market Revenue (Million), by Country 2024 & 2032
- Figure 35: Asia Pacific Photopheresis Products Market Revenue Share (%), by Country 2024 & 2032
- Figure 36: Middle East and Africa Photopheresis Products Market Revenue (Million), by Product Type 2024 & 2032
- Figure 37: Middle East and Africa Photopheresis Products Market Revenue Share (%), by Product Type 2024 & 2032
- Figure 38: Middle East and Africa Photopheresis Products Market Revenue (Million), by Application 2024 & 2032
- Figure 39: Middle East and Africa Photopheresis Products Market Revenue Share (%), by Application 2024 & 2032
- Figure 40: Middle East and Africa Photopheresis Products Market Revenue (Million), by End User 2024 & 2032
- Figure 41: Middle East and Africa Photopheresis Products Market Revenue Share (%), by End User 2024 & 2032
- Figure 42: Middle East and Africa Photopheresis Products Market Revenue (Million), by Country 2024 & 2032
- Figure 43: Middle East and Africa Photopheresis Products Market Revenue Share (%), by Country 2024 & 2032
- Figure 44: South America Photopheresis Products Market Revenue (Million), by Product Type 2024 & 2032
- Figure 45: South America Photopheresis Products Market Revenue Share (%), by Product Type 2024 & 2032
- Figure 46: South America Photopheresis Products Market Revenue (Million), by Application 2024 & 2032
- Figure 47: South America Photopheresis Products Market Revenue Share (%), by Application 2024 & 2032
- Figure 48: South America Photopheresis Products Market Revenue (Million), by End User 2024 & 2032
- Figure 49: South America Photopheresis Products Market Revenue Share (%), by End User 2024 & 2032
- Figure 50: South America Photopheresis Products Market Revenue (Million), by Country 2024 & 2032
- Figure 51: South America Photopheresis Products Market Revenue Share (%), by Country 2024 & 2032
List of Tables
- Table 1: Global Photopheresis Products Market Revenue Million Forecast, by Region 2019 & 2032
- Table 2: Global Photopheresis Products Market Revenue Million Forecast, by Product Type 2019 & 2032
- Table 3: Global Photopheresis Products Market Revenue Million Forecast, by Application 2019 & 2032
- Table 4: Global Photopheresis Products Market Revenue Million Forecast, by End User 2019 & 2032
- Table 5: Global Photopheresis Products Market Revenue Million Forecast, by Region 2019 & 2032
- Table 6: Global Photopheresis Products Market Revenue Million Forecast, by Country 2019 & 2032
- Table 7: United States Photopheresis Products Market Revenue (Million) Forecast, by Application 2019 & 2032
- Table 8: Canada Photopheresis Products Market Revenue (Million) Forecast, by Application 2019 & 2032
- Table 9: Mexico Photopheresis Products Market Revenue (Million) Forecast, by Application 2019 & 2032
- Table 10: Global Photopheresis Products Market Revenue Million Forecast, by Country 2019 & 2032
- Table 11: Germany Photopheresis Products Market Revenue (Million) Forecast, by Application 2019 & 2032
- Table 12: United Kingdom Photopheresis Products Market Revenue (Million) Forecast, by Application 2019 & 2032
- Table 13: France Photopheresis Products Market Revenue (Million) Forecast, by Application 2019 & 2032
- Table 14: Italy Photopheresis Products Market Revenue (Million) Forecast, by Application 2019 & 2032
- Table 15: Spain Photopheresis Products Market Revenue (Million) Forecast, by Application 2019 & 2032
- Table 16: Rest of Europe Photopheresis Products Market Revenue (Million) Forecast, by Application 2019 & 2032
- Table 17: Global Photopheresis Products Market Revenue Million Forecast, by Country 2019 & 2032
- Table 18: China Photopheresis Products Market Revenue (Million) Forecast, by Application 2019 & 2032
- Table 19: Japan Photopheresis Products Market Revenue (Million) Forecast, by Application 2019 & 2032
- Table 20: India Photopheresis Products Market Revenue (Million) Forecast, by Application 2019 & 2032
- Table 21: Australia Photopheresis Products Market Revenue (Million) Forecast, by Application 2019 & 2032
- Table 22: South Korea Photopheresis Products Market Revenue (Million) Forecast, by Application 2019 & 2032
- Table 23: Rest of Asia Pacific Photopheresis Products Market Revenue (Million) Forecast, by Application 2019 & 2032
- Table 24: Global Photopheresis Products Market Revenue Million Forecast, by Country 2019 & 2032
- Table 25: GCC Photopheresis Products Market Revenue (Million) Forecast, by Application 2019 & 2032
- Table 26: South Africa Photopheresis Products Market Revenue (Million) Forecast, by Application 2019 & 2032
- Table 27: Rest of Middle East and Africa Photopheresis Products Market Revenue (Million) Forecast, by Application 2019 & 2032
- Table 28: Global Photopheresis Products Market Revenue Million Forecast, by Country 2019 & 2032
- Table 29: Brazil Photopheresis Products Market Revenue (Million) Forecast, by Application 2019 & 2032
- Table 30: Argentina Photopheresis Products Market Revenue (Million) Forecast, by Application 2019 & 2032
- Table 31: Rest of South America Photopheresis Products Market Revenue (Million) Forecast, by Application 2019 & 2032
- Table 32: Global Photopheresis Products Market Revenue Million Forecast, by Product Type 2019 & 2032
- Table 33: Global Photopheresis Products Market Revenue Million Forecast, by Application 2019 & 2032
- Table 34: Global Photopheresis Products Market Revenue Million Forecast, by End User 2019 & 2032
- Table 35: Global Photopheresis Products Market Revenue Million Forecast, by Country 2019 & 2032
- Table 36: United States Photopheresis Products Market Revenue (Million) Forecast, by Application 2019 & 2032
- Table 37: Canada Photopheresis Products Market Revenue (Million) Forecast, by Application 2019 & 2032
- Table 38: Mexico Photopheresis Products Market Revenue (Million) Forecast, by Application 2019 & 2032
- Table 39: Global Photopheresis Products Market Revenue Million Forecast, by Product Type 2019 & 2032
- Table 40: Global Photopheresis Products Market Revenue Million Forecast, by Application 2019 & 2032
- Table 41: Global Photopheresis Products Market Revenue Million Forecast, by End User 2019 & 2032
- Table 42: Global Photopheresis Products Market Revenue Million Forecast, by Country 2019 & 2032
- Table 43: Germany Photopheresis Products Market Revenue (Million) Forecast, by Application 2019 & 2032
- Table 44: United Kingdom Photopheresis Products Market Revenue (Million) Forecast, by Application 2019 & 2032
- Table 45: France Photopheresis Products Market Revenue (Million) Forecast, by Application 2019 & 2032
- Table 46: Italy Photopheresis Products Market Revenue (Million) Forecast, by Application 2019 & 2032
- Table 47: Spain Photopheresis Products Market Revenue (Million) Forecast, by Application 2019 & 2032
- Table 48: Rest of Europe Photopheresis Products Market Revenue (Million) Forecast, by Application 2019 & 2032
- Table 49: Global Photopheresis Products Market Revenue Million Forecast, by Product Type 2019 & 2032
- Table 50: Global Photopheresis Products Market Revenue Million Forecast, by Application 2019 & 2032
- Table 51: Global Photopheresis Products Market Revenue Million Forecast, by End User 2019 & 2032
- Table 52: Global Photopheresis Products Market Revenue Million Forecast, by Country 2019 & 2032
- Table 53: China Photopheresis Products Market Revenue (Million) Forecast, by Application 2019 & 2032
- Table 54: Japan Photopheresis Products Market Revenue (Million) Forecast, by Application 2019 & 2032
- Table 55: India Photopheresis Products Market Revenue (Million) Forecast, by Application 2019 & 2032
- Table 56: Australia Photopheresis Products Market Revenue (Million) Forecast, by Application 2019 & 2032
- Table 57: South Korea Photopheresis Products Market Revenue (Million) Forecast, by Application 2019 & 2032
- Table 58: Rest of Asia Pacific Photopheresis Products Market Revenue (Million) Forecast, by Application 2019 & 2032
- Table 59: Global Photopheresis Products Market Revenue Million Forecast, by Product Type 2019 & 2032
- Table 60: Global Photopheresis Products Market Revenue Million Forecast, by Application 2019 & 2032
- Table 61: Global Photopheresis Products Market Revenue Million Forecast, by End User 2019 & 2032
- Table 62: Global Photopheresis Products Market Revenue Million Forecast, by Country 2019 & 2032
- Table 63: GCC Photopheresis Products Market Revenue (Million) Forecast, by Application 2019 & 2032
- Table 64: South Africa Photopheresis Products Market Revenue (Million) Forecast, by Application 2019 & 2032
- Table 65: Rest of Middle East and Africa Photopheresis Products Market Revenue (Million) Forecast, by Application 2019 & 2032
- Table 66: Global Photopheresis Products Market Revenue Million Forecast, by Product Type 2019 & 2032
- Table 67: Global Photopheresis Products Market Revenue Million Forecast, by Application 2019 & 2032
- Table 68: Global Photopheresis Products Market Revenue Million Forecast, by End User 2019 & 2032
- Table 69: Global Photopheresis Products Market Revenue Million Forecast, by Country 2019 & 2032
- Table 70: Brazil Photopheresis Products Market Revenue (Million) Forecast, by Application 2019 & 2032
- Table 71: Argentina Photopheresis Products Market Revenue (Million) Forecast, by Application 2019 & 2032
- Table 72: Rest of South America Photopheresis Products Market Revenue (Million) Forecast, by Application 2019 & 2032
Frequently Asked Questions
1. What is the projected Compound Annual Growth Rate (CAGR) of the Photopheresis Products Market?
The projected CAGR is approximately 5.30%.
2. Which companies are prominent players in the Photopheresis Products Market?
Key companies in the market include Macopharma, Terumo Corporation*List Not Exhaustive, Fresenius Kabi AG, PIT Medical Systems, Haemonetics Corporation, Mallinckrodt Pharmaceuticals.
3. What are the main segments of the Photopheresis Products Market?
The market segments include Product Type, Application, End User.
4. Can you provide details about the market size?
The market size is estimated to be USD XX Million as of 2022.
5. What are some drivers contributing to market growth?
Rise in Prevalence of Autoimmune Diseases; Increasing Technological Advancements.
6. What are the notable trends driving market growth?
Chronic Graft Versus Host Disease (GvHD) is Expected to Hold a Significant Market Share in the Market Studied..
7. Are there any restraints impacting market growth?
Low Adoption of Photopheresis in Pediatric Patients and Lack of Skilled Professionals.
8. Can you provide examples of recent developments in the market?
In September 2022, UAE opened a new apheresis unit in the Sheikh Shakhbout Medical City (SSMC) as a collaboration between Abu Dhabi Health Services Company (SEHA) and Mayo Clinic. Sheikh Shakhbout Medical City widens the treatment scope for diseases, including rare lymphoma of the skin.
9. What pricing options are available for accessing the report?
Pricing options include single-user, multi-user, and enterprise licenses priced at USD 4750, USD 5250, and USD 8750 respectively.
10. Is the market size provided in terms of value or volume?
The market size is provided in terms of value, measured in Million.
11. Are there any specific market keywords associated with the report?
Yes, the market keyword associated with the report is "Photopheresis Products Market," which aids in identifying and referencing the specific market segment covered.
12. How do I determine which pricing option suits my needs best?
The pricing options vary based on user requirements and access needs. Individual users may opt for single-user licenses, while businesses requiring broader access may choose multi-user or enterprise licenses for cost-effective access to the report.
13. Are there any additional resources or data provided in the Photopheresis Products Market report?
While the report offers comprehensive insights, it's advisable to review the specific contents or supplementary materials provided to ascertain if additional resources or data are available.
14. How can I stay updated on further developments or reports in the Photopheresis Products Market?
To stay informed about further developments, trends, and reports in the Photopheresis Products Market, consider subscribing to industry newsletters, following relevant companies and organizations, or regularly checking reputable industry news sources and publications.
Methodology
Step 1 - Identification of Relevant Samples Size from Population Database


Step 2 - Approaches for Defining Global Market Size (Value, Volume* & Price*)

Note*: In applicable scenarios
Step 3 - Data Sources
Primary Research
- Web Analytics
- Survey Reports
- Research Institute
- Latest Research Reports
- Opinion Leaders
Secondary Research
- Annual Reports
- White Paper
- Latest Press Release
- Industry Association
- Paid Database
- Investor Presentations

Step 4 - Data Triangulation
Involves using different sources of information in order to increase the validity of a study
These sources are likely to be stakeholders in a program - participants, other researchers, program staff, other community members, and so on.
Then we put all data in single framework & apply various statistical tools to find out the dynamic on the market.
During the analysis stage, feedback from the stakeholder groups would be compared to determine areas of agreement as well as areas of divergence


