

Key Insights
The Circulating Tumor Cells (CTC) market is poised for substantial expansion, driven by advancements in enrichment and detection technologies and their growing adoption in applications such as chromosomal abnormality analysis, RNA profiling, and protein expression studies. The market is projected to reach $14.04 billion by 2025, with a compound annual growth rate (CAGR) of 13.92%. This growth is underpinned by the increasing global cancer burden, the demand for minimally invasive diagnostics, and the drive towards personalized medicine. Key technological advancements, including enhanced isolation techniques, improved analytical platforms for next-generation sequencing and mass cytometry, and the integration of artificial intelligence for data analysis, are significant growth catalysts. The market segmentation by technology and application highlights the impact of innovation in enrichment and detection methods on expanding clinical utility.
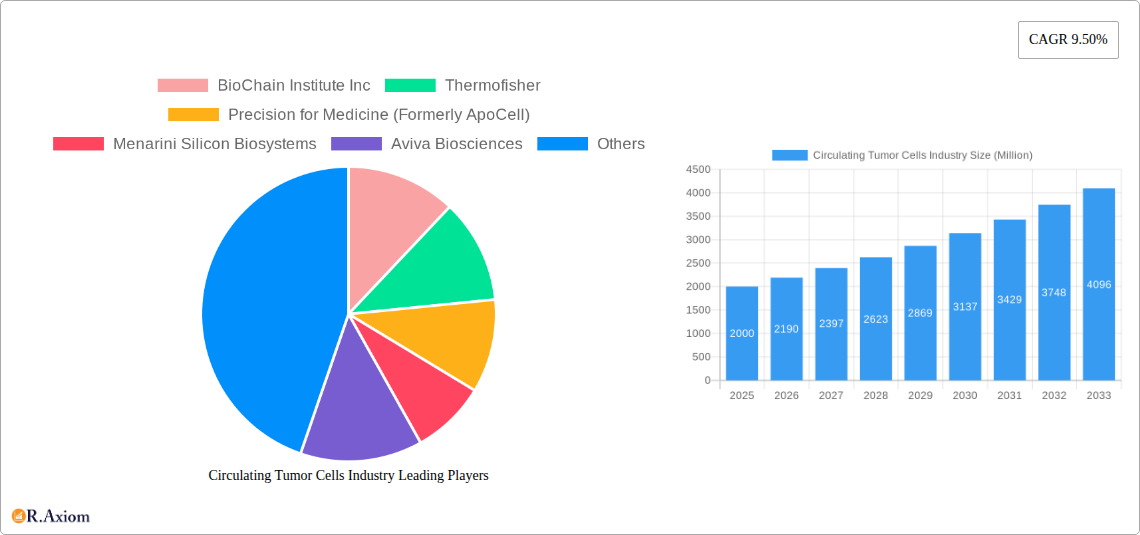
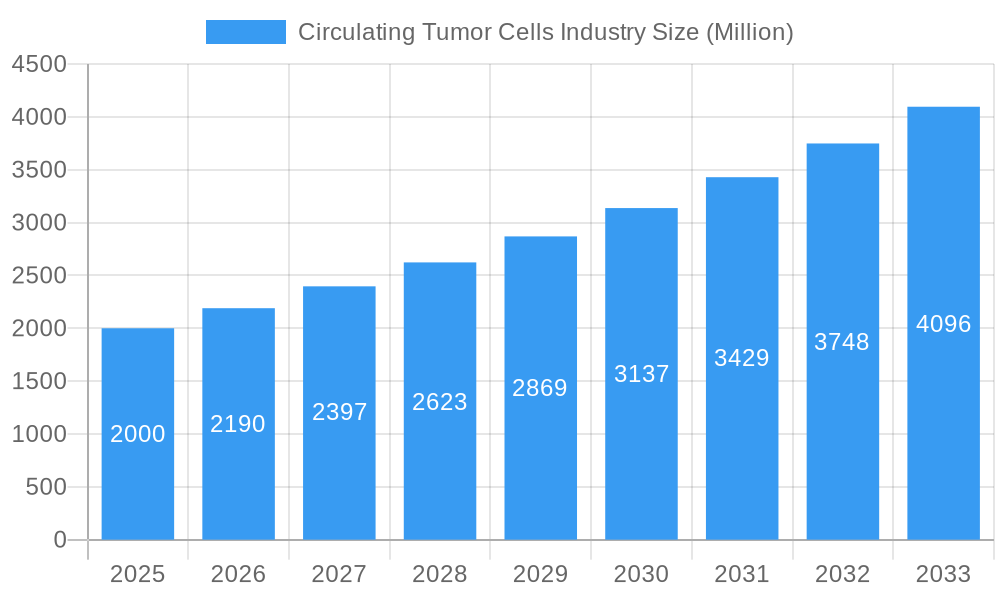
Circulating Tumor Cells Industry Market Size (In Billion)
Despite significant growth potential, the CTC market faces challenges, including the high cost of advanced technologies, complex regulatory pathways, and the need for standardized protocols. The competitive landscape is dynamic, with key players actively innovating to enhance their offerings. Geographically, North America and Europe are expected to lead, with emerging economies in the Asia Pacific region demonstrating considerable growth potential due to rising healthcare expenditure and increasing cancer incidence. Ongoing research and development, coupled with strategic collaborations, will further accelerate market expansion.
Circulating Tumor Cells Industry Company Market Share
This report offers a comprehensive analysis of the Circulating Tumor Cells (CTC) market, detailing market size, growth drivers, technological advancements, competitive dynamics, and future projections. The forecast period spans from 2019 to 2033, with 2025 designated as the base year. This research is vital for industry stakeholders, investors, and researchers seeking actionable insights into this dynamic market.
Circulating Tumor Cells Industry Market Concentration & Innovation
The CTC industry exhibits a moderately concentrated market structure, with key players such as Thermo Fisher Scientific, Qiagen NV, and Miltenyi Biotec holding significant market share. However, the emergence of innovative technologies and new entrants is fostering increased competition. Market concentration is expected to shift slightly by 2033 due to several factors. The market share of the top three players in 2025 is estimated at xx%, while by 2033, this is predicted to decrease to xx% due to the rise of new entrants and increased competition. M&A activities have played a crucial role in shaping the industry landscape, with deal values exceeding $xx Million in the period of 2019-2024. Examples include the acquisition of ApoCell by Precision for Medicine and others.
- Innovation Drivers: Advancements in CTC enrichment and detection technologies, coupled with increased demand for personalized medicine, are driving significant innovations.
- Regulatory Frameworks: Stringent regulatory approvals (e.g., FDA, CE marking) impact market entry and product development.
- Product Substitutes: While CTC analysis provides unique advantages, other liquid biopsy methods represent potential substitutes.
- End-User Trends: Growing adoption of CTC analysis in oncology research and clinical settings fuels market growth.
- M&A Activities: Consolidation through mergers and acquisitions is reshaping the competitive landscape, resulting in increased market concentration, particularly between 2021 and 2024.
Circulating Tumor Cells Industry Industry Trends & Insights
The global CTC industry is experiencing robust growth, driven by the increasing prevalence of cancer, rising demand for early cancer detection and personalized medicine, and technological advancements. The market is projected to reach $xx Million by 2033, exhibiting a Compound Annual Growth Rate (CAGR) of xx% during the forecast period (2025-2033). This growth is fueled by factors such as rising adoption of minimally invasive diagnostic techniques, increasing investments in cancer research, and the expanding application of CTC analysis in various cancers. Technological disruptions, such as the development of novel CTC enrichment methods and highly sensitive detection platforms, are accelerating market penetration and driving adoption by clinical oncologists. The market is witnessing a shift towards improved workflow automation and the integration of artificial intelligence (AI) for enhanced data analysis and interpretation. This is further fueled by consumer preferences for non-invasive diagnostic tools and the growing adoption of liquid biopsies as alternatives to traditional invasive tissue biopsies. However, challenges such as high assay costs, regulatory hurdles, and limited standardization remain.
Dominant Markets & Segments in Circulating Tumor Cells Industry
North America currently dominates the global CTC market, owing to factors such as the high prevalence of cancer, advanced healthcare infrastructure, substantial investments in research and development, and favorable regulatory environments. Within this region, the United States shows exceptionally strong adoption.
- Technology: CTC Enrichment Methods: Microfluidic-based methods hold a dominant share, followed by filtration-based techniques. Growth is driven by ongoing technological improvements focusing on higher purity and recovery rates.
- Other Technologies: CTC Detection Methods: Immunocytochemistry remains prevalent, yet advancements in molecular profiling technologies (e.g., next-generation sequencing, PCR) are fueling strong market expansion in this segment.
- Application: Multiple Chromosome Abnormalities: Analysis of chromosomal abnormalities in CTCs remains a crucial application, driving significant growth in this segment. This is closely followed by RNA profiling, as it is an important tool for diagnostics, prognostics, and therapeutic guidance.
- Application: RNA Profiling: The potential for early detection and personalized therapy guidance has significantly increased the demand in this segment.
- Application: Protein Expression: The ability to assess protein expression in CTCs provides valuable insights into tumor biology, driving growth in this segment, expected to reach $xx Million by 2033.
- Application: Cellular Communication: This emerging application is witnessing strong growth, driven by advancements in understanding intercellular communication in cancer progression.
- Other Applications: Other applications, such as circulating endothelial cells and circulating tumor DNA, complement the CTC market's overall growth.
Key Drivers for North American Dominance:
- High prevalence of cancer: Increased cancer cases and a growing aging population fuel the need for advanced diagnostic tools.
- Robust healthcare infrastructure: Well-established healthcare systems and advanced medical facilities facilitate the adoption of CTC analysis.
- Significant R&D investments: Large investments in cancer research drive the development of new CTC technologies.
- Favorable regulatory environment: Supportive regulatory policies encourage market entry and innovation.
Circulating Tumor Cells Industry Product Developments
Recent product innovations include the introduction of automated CTC enrichment and detection systems, along with improved sample preparation techniques. These advancements improve the efficiency and accuracy of CTC analysis, expanding clinical utility. The development of novel multiplex assays enables simultaneous analysis of multiple biomarkers, providing a more comprehensive understanding of tumor characteristics. These trends are driving increased adoption by clinical laboratories and research institutions. New applications focusing on early detection, treatment monitoring, and personalized therapies are further solidifying the market position of CTC analysis.
Report Scope & Segmentation Analysis
This report segments the CTC market based on technology (CTC enrichment methods, CTC detection methods), application (multiple chromosome abnormalities, RNA profiling, protein expression, cellular communication, other applications), and geography. Each segment's growth projections are based on analysis of historical data, current market dynamics, and future trends. The competitive landscape within each segment is analyzed to identify key players and their market strategies. For instance, the CTC enrichment methods segment is expected to see significant growth driven by advancements in microfluidic technologies, while the RNA profiling application segment will be significantly influenced by the rising adoption of next-generation sequencing technologies.
Key Drivers of Circulating Tumor Cells Industry Growth
Several factors are driving the growth of the CTC industry, including:
- Technological advancements: Continuous innovation in CTC enrichment and detection technologies is significantly improving the sensitivity, specificity, and cost-effectiveness of CTC analysis.
- Growing demand for personalized medicine: The shift towards personalized medicine is leading to a growing need for non-invasive diagnostic tools, such as CTC analysis, to guide treatment decisions.
- Increased cancer prevalence: The rising incidence of cancer worldwide is fueling the demand for early detection methods.
- Favorable regulatory environment: Increased regulatory support for liquid biopsy technologies is expediting the adoption of CTC analysis in clinical practice.
Challenges in the Circulating Tumor Cells Industry Sector
Despite the significant growth potential, the CTC industry faces certain challenges:
- High assay costs: The high cost of CTC assays limits access, particularly in resource-constrained settings. This translates to lower market penetration, particularly in developing regions. The price per test is estimated at $xx, impacting widespread adoption.
- Regulatory hurdles: The regulatory pathways for approval of new CTC-based diagnostic tools are complex and time-consuming. The time to market can impact early entry and ROI.
- Standardization challenges: Lack of standardization in CTC analysis methodologies can affect the reproducibility and comparability of results. This remains an ongoing obstacle to adoption among major healthcare providers.
- Technical limitations: Challenges remain in achieving high CTC recovery rates and low contamination rates, impacting sensitivity.
Emerging Opportunities in Circulating Tumor Cells Industry
Significant opportunities exist for growth within the CTC industry, including:
- Expansion into new applications: The application of CTC analysis is expanding to include additional cancer types and therapeutic areas, such as drug resistance.
- Development of novel technologies: Emerging technologies, like AI-powered image analysis, have the potential to significantly improve the efficiency and accuracy of CTC analysis.
- Integration with other liquid biopsy techniques: Combining CTC analysis with other liquid biopsy methods such as ctDNA analysis is likely to increase the information derived from a single sample.
- Increased collaborations: Partnerships between biotechnology companies, academic institutions, and healthcare providers will accelerate innovation and adoption.
Leading Players in the Circulating Tumor Cells Industry Market
- BioChain Institute Inc
- Thermofisher
- Precision for Medicine (Formerly ApoCell)
- Menarini Silicon Biosystems
- Aviva Biosciences
- Creatv Micro Tech Inc
- Miltenyi Biotec
- LungLife AI Inc
- Sysmex Corporation
- Qiagen NV
- Advanced Cell Diagnostics Inc
- Biocept Inc
Key Developments in Circulating Tumor Cells Industry Industry
- July 2021: Datar Cancer Genetics reported the publication of a MedTech Innovation Briefing (MIB) from the UK's NICE on its CE-marked 'Trueblood-Prostate' test. This highlights growing regulatory acceptance and the potential for wider clinical adoption.
- February 2021: Menarini Silicon Biosystems launched a CellMag product line for manual CTC enrichment and staining. This demonstrates ongoing innovation in enabling simpler and potentially more affordable CTC analysis.
Strategic Outlook for Circulating Tumor Cells Industry Market
The CTC industry is poised for significant growth, driven by technological advancements, increased demand for personalized medicine, and rising cancer prevalence. The market's future potential rests on continued innovation, the development of standardized methodologies, and wider clinical adoption. Overcoming challenges in cost and accessibility will be crucial for realizing the full potential of CTC analysis as a transformative tool in oncology. The integration of AI and machine learning will enhance analysis accuracy and efficiency, driving further market expansion.
Circulating Tumor Cells Industry Segmentation
-
1. Technology
-
1.1. CTC Enrichment Methods
- 1.1.1. Positive Enrichment
- 1.1.2. Negative Enrichment
- 1.1.3. Other Technologies
-
1.2. CTC Detection Methods
- 1.2.1. Immunocytochemical Technology
- 1.2.2. Molecular (RNA)-based Technology
- 1.2.3. Other CTC Detection Methods
-
1.1. CTC Enrichment Methods
-
2. Application
- 2.1. Multiple Chromosome Abnormalities
- 2.2. RNA Profiling
- 2.3. Protein Expression
- 2.4. Cellular Communication
- 2.5. Other Applications
Circulating Tumor Cells Industry Segmentation By Geography
-
1. North America
- 1.1. United States
- 1.2. Canada
- 1.3. Mexico
-
2. Europe
- 2.1. Germany
- 2.2. United Kingdom
- 2.3. France
- 2.4. Italy
- 2.5. Spain
- 2.6. Rest of Europe
-
3. Asia Pacific
- 3.1. China
- 3.2. Japan
- 3.3. India
- 3.4. Australia
- 3.5. South Korea
- 3.6. Rest of Asia Pacific
-
4. Middle East and Africa
- 4.1. GCC
- 4.2. South Africa
- 4.3. Rest of Middle East and Africa
-
5. South America
- 5.1. Brazil
- 5.2. Argentina
- 5.3. Rest of South America
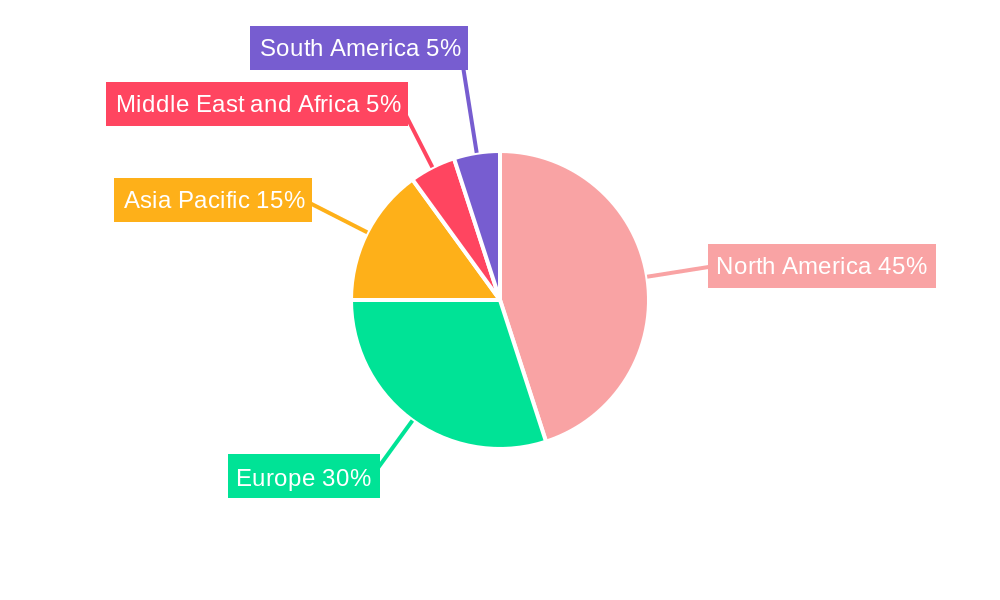
Circulating Tumor Cells Industry Regional Market Share
Geographic Coverage of Circulating Tumor Cells Industry
Circulating Tumor Cells Industry REPORT HIGHLIGHTS
| Aspects | Details |
|---|---|
| Study Period | 2020-2034 |
| Base Year | 2025 |
| Estimated Year | 2026 |
| Forecast Period | 2026-2034 |
| Historical Period | 2020-2025 |
| Growth Rate | CAGR of 13.92% from 2020-2034 |
| Segmentation |
|
Table of Contents
- 1. Introduction
- 1.1. Research Scope
- 1.2. Market Segmentation
- 1.3. Research Objective
- 1.4. Definitions and Assumptions
- 2. Executive Summary
- 2.1. Market Snapshot
- 3. Market Dynamics
- 3.1. Market Drivers
- 3.2. Market Restrains
- 3.3. Market Trends
- 3.4. Market Opportunities
- 4. Market Factor Analysis
- 4.1. Porters Five Forces
- 4.1.1. Bargaining Power of Suppliers
- 4.1.2. Bargaining Power of Buyers
- 4.1.3. Threat of New Entrants
- 4.1.4. Threat of Substitutes
- 4.1.5. Competitive Rivalry
- 4.2. PESTEL analysis
- 4.3. BCG Analysis
- 4.3.1. Stars (High Growth, High Market Share)
- 4.3.2. Cash Cows (Low Growth, High Market Share)
- 4.3.3. Question Mark (High Growth, Low Market Share)
- 4.3.4. Dogs (Low Growth, Low Market Share)
- 4.4. Ansoff Matrix Analysis
- 4.5. Supply Chain Analysis
- 4.6. Regulatory Landscape
- 4.7. Current Market Potential and Opportunity Assessment (TAM–SAM–SOM Framework)
- 4.8. RAX Analyst Note
- 4.1. Porters Five Forces
- 5. Market Analysis, Insights and Forecast 2021-2033
- 5.1. Market Analysis, Insights and Forecast - by Technology
- 5.1.1. CTC Enrichment Methods
- 5.1.1.1. Positive Enrichment
- 5.1.1.2. Negative Enrichment
- 5.1.1.3. Other Technologies
- 5.1.2. CTC Detection Methods
- 5.1.2.1. Immunocytochemical Technology
- 5.1.2.2. Molecular (RNA)-based Technology
- 5.1.2.3. Other CTC Detection Methods
- 5.1.1. CTC Enrichment Methods
- 5.2. Market Analysis, Insights and Forecast - by Application
- 5.2.1. Multiple Chromosome Abnormalities
- 5.2.2. RNA Profiling
- 5.2.3. Protein Expression
- 5.2.4. Cellular Communication
- 5.2.5. Other Applications
- 5.3. Market Analysis, Insights and Forecast - by Region
- 5.3.1. North America
- 5.3.2. Europe
- 5.3.3. Asia Pacific
- 5.3.4. Middle East and Africa
- 5.3.5. South America
- 5.1. Market Analysis, Insights and Forecast - by Technology
- 6. Global Circulating Tumor Cells Industry Analysis, Insights and Forecast, 2021-2033
- 6.1. Market Analysis, Insights and Forecast - by Technology
- 6.1.1. CTC Enrichment Methods
- 6.1.1.1. Positive Enrichment
- 6.1.1.2. Negative Enrichment
- 6.1.1.3. Other Technologies
- 6.1.2. CTC Detection Methods
- 6.1.2.1. Immunocytochemical Technology
- 6.1.2.2. Molecular (RNA)-based Technology
- 6.1.2.3. Other CTC Detection Methods
- 6.1.1. CTC Enrichment Methods
- 6.2. Market Analysis, Insights and Forecast - by Application
- 6.2.1. Multiple Chromosome Abnormalities
- 6.2.2. RNA Profiling
- 6.2.3. Protein Expression
- 6.2.4. Cellular Communication
- 6.2.5. Other Applications
- 6.1. Market Analysis, Insights and Forecast - by Technology
- 7. North America Circulating Tumor Cells Industry Analysis, Insights and Forecast, 2020-2032
- 7.1. Market Analysis, Insights and Forecast - by Technology
- 7.1.1. CTC Enrichment Methods
- 7.1.1.1. Positive Enrichment
- 7.1.1.2. Negative Enrichment
- 7.1.1.3. Other Technologies
- 7.1.2. CTC Detection Methods
- 7.1.2.1. Immunocytochemical Technology
- 7.1.2.2. Molecular (RNA)-based Technology
- 7.1.2.3. Other CTC Detection Methods
- 7.1.1. CTC Enrichment Methods
- 7.2. Market Analysis, Insights and Forecast - by Application
- 7.2.1. Multiple Chromosome Abnormalities
- 7.2.2. RNA Profiling
- 7.2.3. Protein Expression
- 7.2.4. Cellular Communication
- 7.2.5. Other Applications
- 7.1. Market Analysis, Insights and Forecast - by Technology
- 8. Europe Circulating Tumor Cells Industry Analysis, Insights and Forecast, 2020-2032
- 8.1. Market Analysis, Insights and Forecast - by Technology
- 8.1.1. CTC Enrichment Methods
- 8.1.1.1. Positive Enrichment
- 8.1.1.2. Negative Enrichment
- 8.1.1.3. Other Technologies
- 8.1.2. CTC Detection Methods
- 8.1.2.1. Immunocytochemical Technology
- 8.1.2.2. Molecular (RNA)-based Technology
- 8.1.2.3. Other CTC Detection Methods
- 8.1.1. CTC Enrichment Methods
- 8.2. Market Analysis, Insights and Forecast - by Application
- 8.2.1. Multiple Chromosome Abnormalities
- 8.2.2. RNA Profiling
- 8.2.3. Protein Expression
- 8.2.4. Cellular Communication
- 8.2.5. Other Applications
- 8.1. Market Analysis, Insights and Forecast - by Technology
- 9. Asia Pacific Circulating Tumor Cells Industry Analysis, Insights and Forecast, 2020-2032
- 9.1. Market Analysis, Insights and Forecast - by Technology
- 9.1.1. CTC Enrichment Methods
- 9.1.1.1. Positive Enrichment
- 9.1.1.2. Negative Enrichment
- 9.1.1.3. Other Technologies
- 9.1.2. CTC Detection Methods
- 9.1.2.1. Immunocytochemical Technology
- 9.1.2.2. Molecular (RNA)-based Technology
- 9.1.2.3. Other CTC Detection Methods
- 9.1.1. CTC Enrichment Methods
- 9.2. Market Analysis, Insights and Forecast - by Application
- 9.2.1. Multiple Chromosome Abnormalities
- 9.2.2. RNA Profiling
- 9.2.3. Protein Expression
- 9.2.4. Cellular Communication
- 9.2.5. Other Applications
- 9.1. Market Analysis, Insights and Forecast - by Technology
- 10. Middle East and Africa Circulating Tumor Cells Industry Analysis, Insights and Forecast, 2020-2032
- 10.1. Market Analysis, Insights and Forecast - by Technology
- 10.1.1. CTC Enrichment Methods
- 10.1.1.1. Positive Enrichment
- 10.1.1.2. Negative Enrichment
- 10.1.1.3. Other Technologies
- 10.1.2. CTC Detection Methods
- 10.1.2.1. Immunocytochemical Technology
- 10.1.2.2. Molecular (RNA)-based Technology
- 10.1.2.3. Other CTC Detection Methods
- 10.1.1. CTC Enrichment Methods
- 10.2. Market Analysis, Insights and Forecast - by Application
- 10.2.1. Multiple Chromosome Abnormalities
- 10.2.2. RNA Profiling
- 10.2.3. Protein Expression
- 10.2.4. Cellular Communication
- 10.2.5. Other Applications
- 10.1. Market Analysis, Insights and Forecast - by Technology
- 11. South America Circulating Tumor Cells Industry Analysis, Insights and Forecast, 2020-2032
- 11.1. Market Analysis, Insights and Forecast - by Technology
- 11.1.1. CTC Enrichment Methods
- 11.1.1.1. Positive Enrichment
- 11.1.1.2. Negative Enrichment
- 11.1.1.3. Other Technologies
- 11.1.2. CTC Detection Methods
- 11.1.2.1. Immunocytochemical Technology
- 11.1.2.2. Molecular (RNA)-based Technology
- 11.1.2.3. Other CTC Detection Methods
- 11.1.1. CTC Enrichment Methods
- 11.2. Market Analysis, Insights and Forecast - by Application
- 11.2.1. Multiple Chromosome Abnormalities
- 11.2.2. RNA Profiling
- 11.2.3. Protein Expression
- 11.2.4. Cellular Communication
- 11.2.5. Other Applications
- 11.1. Market Analysis, Insights and Forecast - by Technology
- 12. Competitive Analysis
- 12.1. Company Profiles
- 12.1.1 BioChain Institute Inc
- 12.1.1.1. Company Overview
- 12.1.1.2. Products
- 12.1.1.3. Company Financials
- 12.1.1.4. SWOT Analysis
- 12.1.2 Thermofisher
- 12.1.2.1. Company Overview
- 12.1.2.2. Products
- 12.1.2.3. Company Financials
- 12.1.2.4. SWOT Analysis
- 12.1.3 Precision for Medicine (Formerly ApoCell)
- 12.1.3.1. Company Overview
- 12.1.3.2. Products
- 12.1.3.3. Company Financials
- 12.1.3.4. SWOT Analysis
- 12.1.4 Menarini Silicon Biosystems
- 12.1.4.1. Company Overview
- 12.1.4.2. Products
- 12.1.4.3. Company Financials
- 12.1.4.4. SWOT Analysis
- 12.1.5 Aviva Biosciences
- 12.1.5.1. Company Overview
- 12.1.5.2. Products
- 12.1.5.3. Company Financials
- 12.1.5.4. SWOT Analysis
- 12.1.6 Creatv Micro Tech Inc
- 12.1.6.1. Company Overview
- 12.1.6.2. Products
- 12.1.6.3. Company Financials
- 12.1.6.4. SWOT Analysis
- 12.1.7 Miltenyi Biotec
- 12.1.7.1. Company Overview
- 12.1.7.2. Products
- 12.1.7.3. Company Financials
- 12.1.7.4. SWOT Analysis
- 12.1.8 LungLife AI Inc
- 12.1.8.1. Company Overview
- 12.1.8.2. Products
- 12.1.8.3. Company Financials
- 12.1.8.4. SWOT Analysis
- 12.1.9 Sysmex Corporation
- 12.1.9.1. Company Overview
- 12.1.9.2. Products
- 12.1.9.3. Company Financials
- 12.1.9.4. SWOT Analysis
- 12.1.10 Qiagen NV
- 12.1.10.1. Company Overview
- 12.1.10.2. Products
- 12.1.10.3. Company Financials
- 12.1.10.4. SWOT Analysis
- 12.1.11 Advanced Cell Diagnostics Inc
- 12.1.11.1. Company Overview
- 12.1.11.2. Products
- 12.1.11.3. Company Financials
- 12.1.11.4. SWOT Analysis
- 12.1.12 Biocept Inc
- 12.1.12.1. Company Overview
- 12.1.12.2. Products
- 12.1.12.3. Company Financials
- 12.1.12.4. SWOT Analysis
- 12.1.1 BioChain Institute Inc
- 12.2. Market Entropy
- 12.2.1 Company's Key Areas Served
- 12.2.2 Recent Developments
- 12.3. Company Market Share Analysis 2025
- 12.3.1 Top 5 Companies Market Share Analysis
- 12.3.2 Top 3 Companies Market Share Analysis
- 12.4. List of Potential Customers
- 13. Research Methodology
List of Figures
- Figure 1: Global Circulating Tumor Cells Industry Revenue Breakdown (billion, %) by Region 2025 & 2033
- Figure 2: Global Circulating Tumor Cells Industry Volume Breakdown (K Unit, %) by Region 2025 & 2033
- Figure 3: North America Circulating Tumor Cells Industry Revenue (billion), by Technology 2025 & 2033
- Figure 4: North America Circulating Tumor Cells Industry Volume (K Unit), by Technology 2025 & 2033
- Figure 5: North America Circulating Tumor Cells Industry Revenue Share (%), by Technology 2025 & 2033
- Figure 6: North America Circulating Tumor Cells Industry Volume Share (%), by Technology 2025 & 2033
- Figure 7: North America Circulating Tumor Cells Industry Revenue (billion), by Application 2025 & 2033
- Figure 8: North America Circulating Tumor Cells Industry Volume (K Unit), by Application 2025 & 2033
- Figure 9: North America Circulating Tumor Cells Industry Revenue Share (%), by Application 2025 & 2033
- Figure 10: North America Circulating Tumor Cells Industry Volume Share (%), by Application 2025 & 2033
- Figure 11: North America Circulating Tumor Cells Industry Revenue (billion), by Country 2025 & 2033
- Figure 12: North America Circulating Tumor Cells Industry Volume (K Unit), by Country 2025 & 2033
- Figure 13: North America Circulating Tumor Cells Industry Revenue Share (%), by Country 2025 & 2033
- Figure 14: North America Circulating Tumor Cells Industry Volume Share (%), by Country 2025 & 2033
- Figure 15: Europe Circulating Tumor Cells Industry Revenue (billion), by Technology 2025 & 2033
- Figure 16: Europe Circulating Tumor Cells Industry Volume (K Unit), by Technology 2025 & 2033
- Figure 17: Europe Circulating Tumor Cells Industry Revenue Share (%), by Technology 2025 & 2033
- Figure 18: Europe Circulating Tumor Cells Industry Volume Share (%), by Technology 2025 & 2033
- Figure 19: Europe Circulating Tumor Cells Industry Revenue (billion), by Application 2025 & 2033
- Figure 20: Europe Circulating Tumor Cells Industry Volume (K Unit), by Application 2025 & 2033
- Figure 21: Europe Circulating Tumor Cells Industry Revenue Share (%), by Application 2025 & 2033
- Figure 22: Europe Circulating Tumor Cells Industry Volume Share (%), by Application 2025 & 2033
- Figure 23: Europe Circulating Tumor Cells Industry Revenue (billion), by Country 2025 & 2033
- Figure 24: Europe Circulating Tumor Cells Industry Volume (K Unit), by Country 2025 & 2033
- Figure 25: Europe Circulating Tumor Cells Industry Revenue Share (%), by Country 2025 & 2033
- Figure 26: Europe Circulating Tumor Cells Industry Volume Share (%), by Country 2025 & 2033
- Figure 27: Asia Pacific Circulating Tumor Cells Industry Revenue (billion), by Technology 2025 & 2033
- Figure 28: Asia Pacific Circulating Tumor Cells Industry Volume (K Unit), by Technology 2025 & 2033
- Figure 29: Asia Pacific Circulating Tumor Cells Industry Revenue Share (%), by Technology 2025 & 2033
- Figure 30: Asia Pacific Circulating Tumor Cells Industry Volume Share (%), by Technology 2025 & 2033
- Figure 31: Asia Pacific Circulating Tumor Cells Industry Revenue (billion), by Application 2025 & 2033
- Figure 32: Asia Pacific Circulating Tumor Cells Industry Volume (K Unit), by Application 2025 & 2033
- Figure 33: Asia Pacific Circulating Tumor Cells Industry Revenue Share (%), by Application 2025 & 2033
- Figure 34: Asia Pacific Circulating Tumor Cells Industry Volume Share (%), by Application 2025 & 2033
- Figure 35: Asia Pacific Circulating Tumor Cells Industry Revenue (billion), by Country 2025 & 2033
- Figure 36: Asia Pacific Circulating Tumor Cells Industry Volume (K Unit), by Country 2025 & 2033
- Figure 37: Asia Pacific Circulating Tumor Cells Industry Revenue Share (%), by Country 2025 & 2033
- Figure 38: Asia Pacific Circulating Tumor Cells Industry Volume Share (%), by Country 2025 & 2033
- Figure 39: Middle East and Africa Circulating Tumor Cells Industry Revenue (billion), by Technology 2025 & 2033
- Figure 40: Middle East and Africa Circulating Tumor Cells Industry Volume (K Unit), by Technology 2025 & 2033
- Figure 41: Middle East and Africa Circulating Tumor Cells Industry Revenue Share (%), by Technology 2025 & 2033
- Figure 42: Middle East and Africa Circulating Tumor Cells Industry Volume Share (%), by Technology 2025 & 2033
- Figure 43: Middle East and Africa Circulating Tumor Cells Industry Revenue (billion), by Application 2025 & 2033
- Figure 44: Middle East and Africa Circulating Tumor Cells Industry Volume (K Unit), by Application 2025 & 2033
- Figure 45: Middle East and Africa Circulating Tumor Cells Industry Revenue Share (%), by Application 2025 & 2033
- Figure 46: Middle East and Africa Circulating Tumor Cells Industry Volume Share (%), by Application 2025 & 2033
- Figure 47: Middle East and Africa Circulating Tumor Cells Industry Revenue (billion), by Country 2025 & 2033
- Figure 48: Middle East and Africa Circulating Tumor Cells Industry Volume (K Unit), by Country 2025 & 2033
- Figure 49: Middle East and Africa Circulating Tumor Cells Industry Revenue Share (%), by Country 2025 & 2033
- Figure 50: Middle East and Africa Circulating Tumor Cells Industry Volume Share (%), by Country 2025 & 2033
- Figure 51: South America Circulating Tumor Cells Industry Revenue (billion), by Technology 2025 & 2033
- Figure 52: South America Circulating Tumor Cells Industry Volume (K Unit), by Technology 2025 & 2033
- Figure 53: South America Circulating Tumor Cells Industry Revenue Share (%), by Technology 2025 & 2033
- Figure 54: South America Circulating Tumor Cells Industry Volume Share (%), by Technology 2025 & 2033
- Figure 55: South America Circulating Tumor Cells Industry Revenue (billion), by Application 2025 & 2033
- Figure 56: South America Circulating Tumor Cells Industry Volume (K Unit), by Application 2025 & 2033
- Figure 57: South America Circulating Tumor Cells Industry Revenue Share (%), by Application 2025 & 2033
- Figure 58: South America Circulating Tumor Cells Industry Volume Share (%), by Application 2025 & 2033
- Figure 59: South America Circulating Tumor Cells Industry Revenue (billion), by Country 2025 & 2033
- Figure 60: South America Circulating Tumor Cells Industry Volume (K Unit), by Country 2025 & 2033
- Figure 61: South America Circulating Tumor Cells Industry Revenue Share (%), by Country 2025 & 2033
- Figure 62: South America Circulating Tumor Cells Industry Volume Share (%), by Country 2025 & 2033
List of Tables
- Table 1: Global Circulating Tumor Cells Industry Revenue billion Forecast, by Technology 2020 & 2033
- Table 2: Global Circulating Tumor Cells Industry Volume K Unit Forecast, by Technology 2020 & 2033
- Table 3: Global Circulating Tumor Cells Industry Revenue billion Forecast, by Application 2020 & 2033
- Table 4: Global Circulating Tumor Cells Industry Volume K Unit Forecast, by Application 2020 & 2033
- Table 5: Global Circulating Tumor Cells Industry Revenue billion Forecast, by Region 2020 & 2033
- Table 6: Global Circulating Tumor Cells Industry Volume K Unit Forecast, by Region 2020 & 2033
- Table 7: Global Circulating Tumor Cells Industry Revenue billion Forecast, by Technology 2020 & 2033
- Table 8: Global Circulating Tumor Cells Industry Volume K Unit Forecast, by Technology 2020 & 2033
- Table 9: Global Circulating Tumor Cells Industry Revenue billion Forecast, by Application 2020 & 2033
- Table 10: Global Circulating Tumor Cells Industry Volume K Unit Forecast, by Application 2020 & 2033
- Table 11: Global Circulating Tumor Cells Industry Revenue billion Forecast, by Country 2020 & 2033
- Table 12: Global Circulating Tumor Cells Industry Volume K Unit Forecast, by Country 2020 & 2033
- Table 13: United States Circulating Tumor Cells Industry Revenue (billion) Forecast, by Application 2020 & 2033
- Table 14: United States Circulating Tumor Cells Industry Volume (K Unit) Forecast, by Application 2020 & 2033
- Table 15: Canada Circulating Tumor Cells Industry Revenue (billion) Forecast, by Application 2020 & 2033
- Table 16: Canada Circulating Tumor Cells Industry Volume (K Unit) Forecast, by Application 2020 & 2033
- Table 17: Mexico Circulating Tumor Cells Industry Revenue (billion) Forecast, by Application 2020 & 2033
- Table 18: Mexico Circulating Tumor Cells Industry Volume (K Unit) Forecast, by Application 2020 & 2033
- Table 19: Global Circulating Tumor Cells Industry Revenue billion Forecast, by Technology 2020 & 2033
- Table 20: Global Circulating Tumor Cells Industry Volume K Unit Forecast, by Technology 2020 & 2033
- Table 21: Global Circulating Tumor Cells Industry Revenue billion Forecast, by Application 2020 & 2033
- Table 22: Global Circulating Tumor Cells Industry Volume K Unit Forecast, by Application 2020 & 2033
- Table 23: Global Circulating Tumor Cells Industry Revenue billion Forecast, by Country 2020 & 2033
- Table 24: Global Circulating Tumor Cells Industry Volume K Unit Forecast, by Country 2020 & 2033
- Table 25: Germany Circulating Tumor Cells Industry Revenue (billion) Forecast, by Application 2020 & 2033
- Table 26: Germany Circulating Tumor Cells Industry Volume (K Unit) Forecast, by Application 2020 & 2033
- Table 27: United Kingdom Circulating Tumor Cells Industry Revenue (billion) Forecast, by Application 2020 & 2033
- Table 28: United Kingdom Circulating Tumor Cells Industry Volume (K Unit) Forecast, by Application 2020 & 2033
- Table 29: France Circulating Tumor Cells Industry Revenue (billion) Forecast, by Application 2020 & 2033
- Table 30: France Circulating Tumor Cells Industry Volume (K Unit) Forecast, by Application 2020 & 2033
- Table 31: Italy Circulating Tumor Cells Industry Revenue (billion) Forecast, by Application 2020 & 2033
- Table 32: Italy Circulating Tumor Cells Industry Volume (K Unit) Forecast, by Application 2020 & 2033
- Table 33: Spain Circulating Tumor Cells Industry Revenue (billion) Forecast, by Application 2020 & 2033
- Table 34: Spain Circulating Tumor Cells Industry Volume (K Unit) Forecast, by Application 2020 & 2033
- Table 35: Rest of Europe Circulating Tumor Cells Industry Revenue (billion) Forecast, by Application 2020 & 2033
- Table 36: Rest of Europe Circulating Tumor Cells Industry Volume (K Unit) Forecast, by Application 2020 & 2033
- Table 37: Global Circulating Tumor Cells Industry Revenue billion Forecast, by Technology 2020 & 2033
- Table 38: Global Circulating Tumor Cells Industry Volume K Unit Forecast, by Technology 2020 & 2033
- Table 39: Global Circulating Tumor Cells Industry Revenue billion Forecast, by Application 2020 & 2033
- Table 40: Global Circulating Tumor Cells Industry Volume K Unit Forecast, by Application 2020 & 2033
- Table 41: Global Circulating Tumor Cells Industry Revenue billion Forecast, by Country 2020 & 2033
- Table 42: Global Circulating Tumor Cells Industry Volume K Unit Forecast, by Country 2020 & 2033
- Table 43: China Circulating Tumor Cells Industry Revenue (billion) Forecast, by Application 2020 & 2033
- Table 44: China Circulating Tumor Cells Industry Volume (K Unit) Forecast, by Application 2020 & 2033
- Table 45: Japan Circulating Tumor Cells Industry Revenue (billion) Forecast, by Application 2020 & 2033
- Table 46: Japan Circulating Tumor Cells Industry Volume (K Unit) Forecast, by Application 2020 & 2033
- Table 47: India Circulating Tumor Cells Industry Revenue (billion) Forecast, by Application 2020 & 2033
- Table 48: India Circulating Tumor Cells Industry Volume (K Unit) Forecast, by Application 2020 & 2033
- Table 49: Australia Circulating Tumor Cells Industry Revenue (billion) Forecast, by Application 2020 & 2033
- Table 50: Australia Circulating Tumor Cells Industry Volume (K Unit) Forecast, by Application 2020 & 2033
- Table 51: South Korea Circulating Tumor Cells Industry Revenue (billion) Forecast, by Application 2020 & 2033
- Table 52: South Korea Circulating Tumor Cells Industry Volume (K Unit) Forecast, by Application 2020 & 2033
- Table 53: Rest of Asia Pacific Circulating Tumor Cells Industry Revenue (billion) Forecast, by Application 2020 & 2033
- Table 54: Rest of Asia Pacific Circulating Tumor Cells Industry Volume (K Unit) Forecast, by Application 2020 & 2033
- Table 55: Global Circulating Tumor Cells Industry Revenue billion Forecast, by Technology 2020 & 2033
- Table 56: Global Circulating Tumor Cells Industry Volume K Unit Forecast, by Technology 2020 & 2033
- Table 57: Global Circulating Tumor Cells Industry Revenue billion Forecast, by Application 2020 & 2033
- Table 58: Global Circulating Tumor Cells Industry Volume K Unit Forecast, by Application 2020 & 2033
- Table 59: Global Circulating Tumor Cells Industry Revenue billion Forecast, by Country 2020 & 2033
- Table 60: Global Circulating Tumor Cells Industry Volume K Unit Forecast, by Country 2020 & 2033
- Table 61: GCC Circulating Tumor Cells Industry Revenue (billion) Forecast, by Application 2020 & 2033
- Table 62: GCC Circulating Tumor Cells Industry Volume (K Unit) Forecast, by Application 2020 & 2033
- Table 63: South Africa Circulating Tumor Cells Industry Revenue (billion) Forecast, by Application 2020 & 2033
- Table 64: South Africa Circulating Tumor Cells Industry Volume (K Unit) Forecast, by Application 2020 & 2033
- Table 65: Rest of Middle East and Africa Circulating Tumor Cells Industry Revenue (billion) Forecast, by Application 2020 & 2033
- Table 66: Rest of Middle East and Africa Circulating Tumor Cells Industry Volume (K Unit) Forecast, by Application 2020 & 2033
- Table 67: Global Circulating Tumor Cells Industry Revenue billion Forecast, by Technology 2020 & 2033
- Table 68: Global Circulating Tumor Cells Industry Volume K Unit Forecast, by Technology 2020 & 2033
- Table 69: Global Circulating Tumor Cells Industry Revenue billion Forecast, by Application 2020 & 2033
- Table 70: Global Circulating Tumor Cells Industry Volume K Unit Forecast, by Application 2020 & 2033
- Table 71: Global Circulating Tumor Cells Industry Revenue billion Forecast, by Country 2020 & 2033
- Table 72: Global Circulating Tumor Cells Industry Volume K Unit Forecast, by Country 2020 & 2033
- Table 73: Brazil Circulating Tumor Cells Industry Revenue (billion) Forecast, by Application 2020 & 2033
- Table 74: Brazil Circulating Tumor Cells Industry Volume (K Unit) Forecast, by Application 2020 & 2033
- Table 75: Argentina Circulating Tumor Cells Industry Revenue (billion) Forecast, by Application 2020 & 2033
- Table 76: Argentina Circulating Tumor Cells Industry Volume (K Unit) Forecast, by Application 2020 & 2033
- Table 77: Rest of South America Circulating Tumor Cells Industry Revenue (billion) Forecast, by Application 2020 & 2033
- Table 78: Rest of South America Circulating Tumor Cells Industry Volume (K Unit) Forecast, by Application 2020 & 2033
Frequently Asked Questions
1. What is the projected Compound Annual Growth Rate (CAGR) of the Circulating Tumor Cells Industry?
The projected CAGR is approximately 13.92%.
2. Which companies are prominent players in the Circulating Tumor Cells Industry?
Key companies in the market include BioChain Institute Inc, Thermofisher, Precision for Medicine (Formerly ApoCell), Menarini Silicon Biosystems, Aviva Biosciences, Creatv Micro Tech Inc, Miltenyi Biotec, LungLife AI Inc, Sysmex Corporation, Qiagen NV, Advanced Cell Diagnostics Inc, Biocept Inc.
3. What are the main segments of the Circulating Tumor Cells Industry?
The market segments include Technology, Application.
4. Can you provide details about the market size?
The market size is estimated to be USD 14.04 billion as of 2022.
5. What are some drivers contributing to market growth?
Advancements in Biomedical Imaging and Bioengineering Technology; Rising Demand for Preventive Medicine and Companion Diagnostics; Increasing Prevalence of Cancer.
6. What are the notable trends driving market growth?
The Negative Enrichment Segment is Expected to Hold a Major Market Share in the Circulating Tumor Cells (CTC) Market.
7. Are there any restraints impacting market growth?
Technical Difficulties in Detection and Characterization of CTCs Associated with High Cost of Diagnosis; Lack of Awarness and Unwillingness for the Adoption of Advanced CTC Technologies.
8. Can you provide examples of recent developments in the market?
In July 2021, Datar Cancer Genetics reported the publication of a MedTech Innovation Briefing (MIB) from the United Kingdom's National Institute for Health and Care Excellence (NICE) on its CE-marked 'Trueblood-Prostate' test to be used for precision triaging of patients to avoid unnecessary invasive biopsies.
9. What pricing options are available for accessing the report?
Pricing options include single-user, multi-user, and enterprise licenses priced at USD 4750, USD 5250, and USD 8750 respectively.
10. Is the market size provided in terms of value or volume?
The market size is provided in terms of value, measured in billion and volume, measured in K Unit.
11. Are there any specific market keywords associated with the report?
Yes, the market keyword associated with the report is "Circulating Tumor Cells Industry," which aids in identifying and referencing the specific market segment covered.
12. How do I determine which pricing option suits my needs best?
The pricing options vary based on user requirements and access needs. Individual users may opt for single-user licenses, while businesses requiring broader access may choose multi-user or enterprise licenses for cost-effective access to the report.
13. Are there any additional resources or data provided in the Circulating Tumor Cells Industry report?
While the report offers comprehensive insights, it's advisable to review the specific contents or supplementary materials provided to ascertain if additional resources or data are available.
14. How can I stay updated on further developments or reports in the Circulating Tumor Cells Industry?
To stay informed about further developments, trends, and reports in the Circulating Tumor Cells Industry, consider subscribing to industry newsletters, following relevant companies and organizations, or regularly checking reputable industry news sources and publications.
Methodology
Step 1 - Identification of Relevant Samples Size from Population Database


Step 2 - Approaches for Defining Global Market Size (Value, Volume* & Price*)

Note*: In applicable scenarios
Step 3 - Data Sources
Primary Research
- Web Analytics
- Survey Reports
- Research Institute
- Latest Research Reports
- Opinion Leaders
Secondary Research
- Annual Reports
- White Paper
- Latest Press Release
- Industry Association
- Paid Database
- Investor Presentations

Step 4 - Data Triangulation
Involves using different sources of information in order to increase the validity of a study
These sources are likely to be stakeholders in a program - participants, other researchers, program staff, other community members, and so on.
Then we put all data in single framework & apply various statistical tools to find out the dynamic on the market.
During the analysis stage, feedback from the stakeholder groups would be compared to determine areas of agreement as well as areas of divergence