

Key Insights
The High Content Screening (HCS) market is driven by the escalating demand for efficient drug discovery and development solutions within the pharmaceutical and biotechnology industries. Key growth catalysts include the rising incidence of chronic diseases, advancements in imaging and analysis technologies, and the increasing adoption of personalized medicine. Projected for robust expansion, the market is estimated to reach $1.52 billion by 2025, exhibiting a compound annual growth rate (CAGR) of 7.5%. Market segmentation highlights the significant contributions of instruments and consumables, with pharmaceutical and biotechnology companies representing a primary end-user segment. North America and Europe currently dominate the market due to established research infrastructure, while the Asia-Pacific region is poised for substantial growth driven by increased R&D investments and a burgeoning pharmaceutical sector.
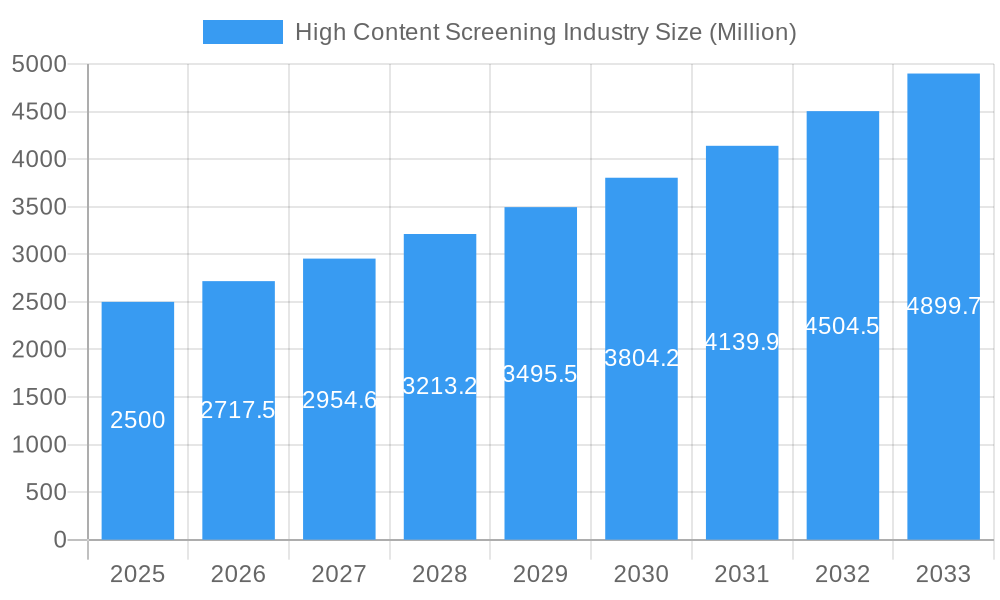
High Content Screening Industry Market Size (In Billion)
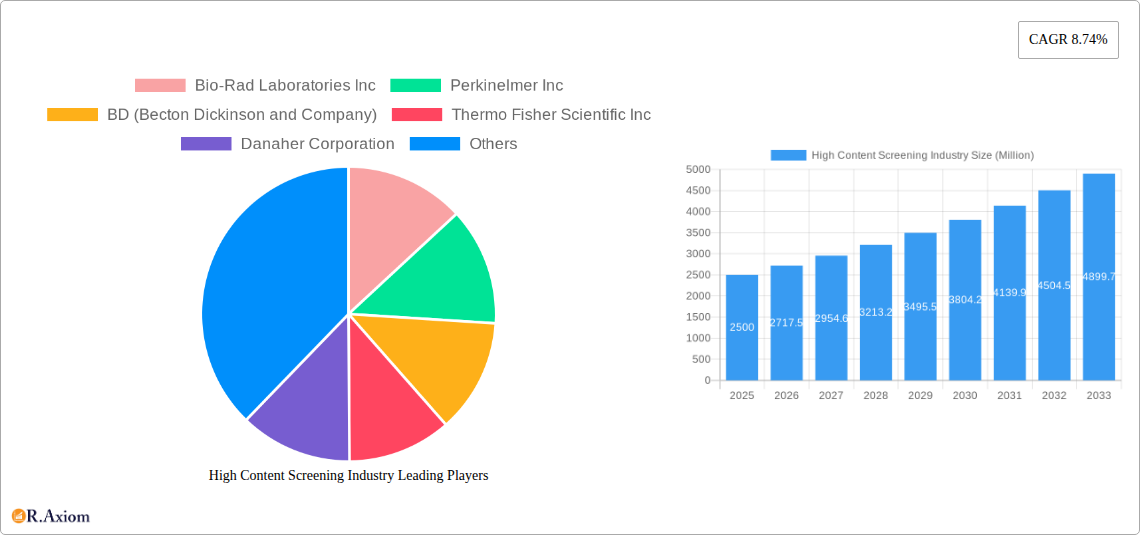
The competitive landscape features prominent players including Bio-Rad Laboratories, PerkinElmer, BD, Thermo Fisher Scientific, and Danaher. Future growth will be propelled by the integration of artificial intelligence (AI) and machine learning (ML) into HCS platforms, enhancing data analysis and throughput. The development of advanced assays and the expansion of HCS applications beyond drug discovery into toxicology and personalized medicine will further fuel market growth. While high instrument and consumable costs, along with the need for specialized expertise, present potential challenges, the technology's significant advantages are expected to outweigh these limitations.
High Content Screening Industry Company Market Share
High Content Screening Industry Market Analysis: 2025-2033
This report delivers a comprehensive analysis of the High Content Screening (HCS) industry, providing critical insights for stakeholders. Covering the period 2025-2033, with a base year of 2025, this report details market size, growth drivers, challenges, and future opportunities. Market size is presented in billions of USD.
High Content Screening Industry Market Concentration & Innovation
The High Content Screening industry exhibits a moderately concentrated market structure, dominated by several multinational corporations. Key players such as Bio-Rad Laboratories Inc, PerkinElmer Inc, BD (Becton, Dickinson and Company), Thermo Fisher Scientific Inc, Danaher Corporation, Merck KGaA, Yokogawa Electric Corporation, and Agilent Technologies hold significant market share, estimated collectively at xx% in 2025. Market share distribution among these companies is dynamic, with ongoing competition and strategic acquisitions influencing their positions. Innovation is a key driver, fueled by advancements in imaging technologies, automation, and data analysis. Regulatory frameworks, particularly those related to drug development and clinical trials, significantly impact industry growth and adoption. Substitutes for HCS technologies are limited, although alternative screening methods exist, but they often lack the high-throughput and image-based capabilities of HCS. End-user trends indicate a growing preference for integrated solutions that streamline workflows and reduce costs. The industry has witnessed several mergers and acquisitions (M&A) in recent years, with deal values exceeding xx million USD in the period 2019-2024.
- Market Share: Bio-Rad Laboratories Inc: xx%; PerkinElmer Inc: xx%; BD: xx%; Thermo Fisher Scientific Inc: xx%; Danaher Corporation: xx%; Merck KGaA: xx%; Yokogawa Electric Corporation: xx%; Agilent Technologies: xx%; Others: xx%
- M&A Activity: xx major M&A deals completed between 2019-2024 with a total value of approximately xx Million USD.
High Content Screening Industry Industry Trends & Insights
The High Content Screening industry is experiencing robust growth, driven by factors such as the increasing prevalence of chronic diseases, rising demand for personalized medicine, and the continuous advancement of technologies. The market is projected to witness a Compound Annual Growth Rate (CAGR) of xx% during the forecast period (2025-2033), reaching a market value of xx Million USD by 2033. Market penetration remains relatively high among pharmaceutical and biotechnology companies, however growth is expected from expansion into academic research and contract research organizations. Technological disruptions, particularly in areas like artificial intelligence (AI) and machine learning (ML) for image analysis, are revolutionizing data handling and interpretation capabilities. This trend is significantly impacting efficiency and the speed of drug discovery. The competitive landscape is characterized by both intense rivalry among established players and the emergence of innovative startups.
Dominant Markets & Segments in High Content Screening Industry
The North American region currently dominates the High Content Screening market, driven by a robust pharmaceutical and biotechnology sector, along with significant investments in research and development. Within the segments:
Product: Instruments segment holds the largest market share due to high initial investment required and ongoing demand for advanced features. Consumables (Flow Cytometers and Other) represent a substantial recurring revenue stream. Software and services are witnessing rapid growth, driven by the increasing need for sophisticated data analysis and workflow management tools.
Application: Primary and secondary screening account for the highest market share, while target identification, validation, toxicity studies, and compound profiling are high-growth areas. The 'Other applications' segment comprises niche applications like cell biology research.
End User: Pharmaceutical and biotechnology companies constitute the largest segment, with significant investment in HCS technologies for drug discovery and development. Academic and government institutions contribute substantial research volumes. Contract research organizations (CROs) play a crucial role in outsourcing HCS services.
Key Drivers for Dominant Segments:
- North America: Strong R&D investment, presence of major pharmaceutical companies, advanced healthcare infrastructure.
- Instruments: Need for high-throughput screening, advanced imaging capabilities, and automation.
- Pharmaceutical & Biotech Companies: High demand for efficient drug discovery tools and increased investments in R&D.
High Content Screening Industry Product Developments
Recent product innovations focus on improving throughput, image quality, and data analysis capabilities. Miniaturization of systems is trending, increasing efficiency and reducing costs. Integration of AI and ML algorithms into software solutions is a key focus, enabling improved data interpretation and automation of workflows. The market is witnessing the development of integrated platforms, combining multiple HCS functionalities within a single system. These advancements provide significant competitive advantages by offering improved speed, accuracy, and cost-effectiveness.
Report Scope & Segmentation Analysis
This report segments the High Content Screening market across various parameters, including product type (Instruments, Flow Cytometers, Other Consumables, Software, Services), application (Primary and Secondary Screening, Target Identification and Validation, Toxicity Studies, Compound Profiling, Other Applications), and end-user (Pharmaceutical and Biotechnology Companies, Academic and Government Institutions, Contract Research Organizations). Each segment is analyzed in detail, providing market size, growth projections, and competitive dynamics. For example, the instrument segment is expected to grow at a CAGR of xx% during the forecast period, driven by demand for advanced imaging and automation technologies.
Key Drivers of High Content Screening Industry Growth
Several key factors drive the growth of the High Content Screening industry. Advancements in imaging and automation technologies significantly increase screening throughput and data quality. The increasing prevalence of chronic diseases and rising demand for personalized medicines fuel the need for efficient drug discovery and development tools. Favorable regulatory environments and substantial funding for biomedical research are supporting the adoption of HCS technologies.
Challenges in the High Content Screening Industry Sector
The HCS industry faces several challenges. High initial investment costs associated with acquiring advanced systems can restrict smaller organizations' access. The complexity of data analysis and the need for skilled personnel pose another obstacle. Intense competition among existing players and the emergence of innovative startups require constant technological advancement and adaptation. Regulatory hurdles concerning new drug approvals add another layer of complexity. Supply chain disruptions can impact the availability of essential consumables and components.
Emerging Opportunities in High Content Screening Industry
Emerging opportunities exist in integrating AI and ML for advanced data analysis and automation, leading to improved efficiency and accuracy. Expansion into new therapeutic areas such as oncology and immunology presents significant growth prospects. The development of cost-effective, user-friendly systems can enhance market penetration among smaller research organizations. The increasing demand for personalized medicine is driving the development of specialized HCS assays for personalized drug discovery.
Leading Players in the High Content Screening Industry Market
Key Developments in High Content Screening Industry Industry
- September 2022: BD (Becton, Dickinson and Company) launched BD Research Cloud, a cloud-based software solution designed to streamline the flow cytometry workflow, enhancing data analysis and collaboration.
- April 2022: Sysmex Europe launched the CE-IVD-marked Flow Cytometer XF-1600, expanding the availability of robust immunophenotyping tools in clinical settings.
Strategic Outlook for High Content Screening Industry Market
The High Content Screening market is poised for continued growth, driven by technological advancements, increasing research funding, and the expanding demand for faster and more efficient drug discovery methods. Strategic partnerships and collaborations among industry players are expected to drive innovation and market expansion. The focus on developing cost-effective, user-friendly solutions and expanding into new therapeutic areas will further shape the industry’s trajectory. The integration of AI and ML will continue to be a key driver, leading to enhanced data analysis and automation of workflows.
High Content Screening Industry Segmentation
-
1. Product
-
1.1. Instruments
- 1.1.1. Cell Imaging and Analysis Systems
- 1.1.2. Flow Cytometers
-
1.2. Consumables
- 1.2.1. Reagents and Assay Kits
- 1.2.2. Microplates
- 1.2.3. Other Consumables
- 1.3. Software
- 1.4. Services
-
1.1. Instruments
-
2. Application
- 2.1. Primary and Secondary Screening
- 2.2. Target Identification and Validation
- 2.3. Toxicity Studies
- 2.4. Compound Profiling
- 2.5. Other Applications
-
3. End User
- 3.1. Pharmaceutical and Biotechnology Companies
- 3.2. Academic and Government Institutions
- 3.3. Contract Research Organization
High Content Screening Industry Segmentation By Geography
-
1. North America
- 1.1. United States
- 1.2. Canada
- 1.3. Mexico
-
2. Europe
- 2.1. Germany
- 2.2. United Kingdom
- 2.3. France
- 2.4. Italy
- 2.5. Spain
- 2.6. Rest of Europe
-
3. Asia Pacific
- 3.1. China
- 3.2. Japan
- 3.3. India
- 3.4. Australia
- 3.5. South Korea
- 3.6. Rest of Asia Pacific
-
4. Middle East and Africa
- 4.1. GCC
- 4.2. South Africa
- 4.3. Rest of Middle East and Africa
-
5. South America
- 5.1. Brazil
- 5.2. Argentina
- 5.3. Rest of South America
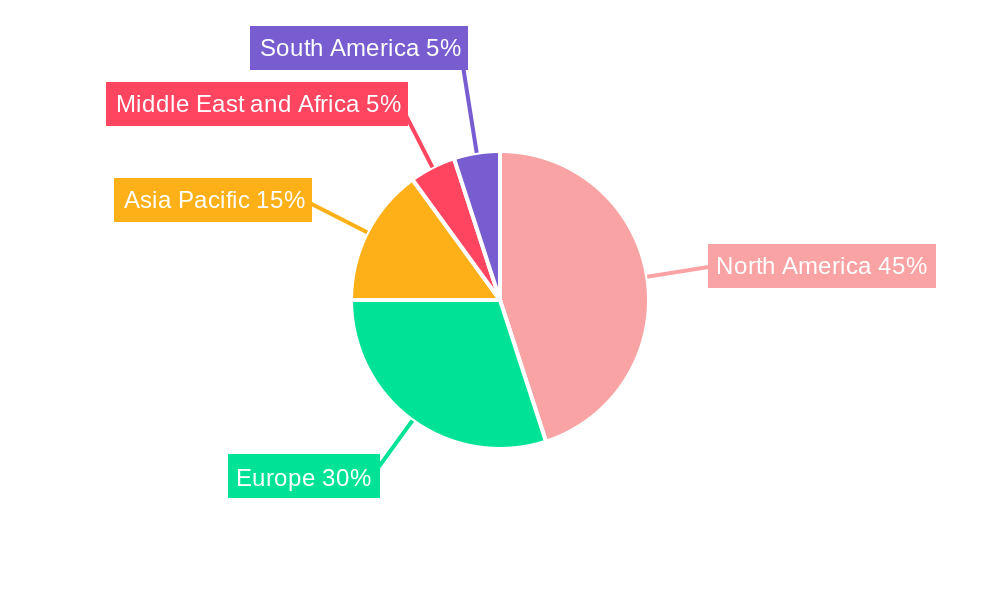
High Content Screening Industry Regional Market Share
Geographic Coverage of High Content Screening Industry
High Content Screening Industry REPORT HIGHLIGHTS
| Aspects | Details |
|---|---|
| Study Period | 2020-2034 |
| Base Year | 2025 |
| Estimated Year | 2026 |
| Forecast Period | 2026-2034 |
| Historical Period | 2020-2025 |
| Growth Rate | CAGR of 7.5% from 2020-2034 |
| Segmentation |
|
Table of Contents
- 1. Introduction
- 1.1. Research Scope
- 1.2. Market Segmentation
- 1.3. Research Objective
- 1.4. Definitions and Assumptions
- 2. Executive Summary
- 2.1. Market Snapshot
- 3. Market Dynamics
- 3.1. Market Drivers
- 3.2. Market Restrains
- 3.3. Market Trends
- 3.4. Market Opportunities
- 4. Market Factor Analysis
- 4.1. Porters Five Forces
- 4.1.1. Bargaining Power of Suppliers
- 4.1.2. Bargaining Power of Buyers
- 4.1.3. Threat of New Entrants
- 4.1.4. Threat of Substitutes
- 4.1.5. Competitive Rivalry
- 4.2. PESTEL analysis
- 4.3. BCG Analysis
- 4.3.1. Stars (High Growth, High Market Share)
- 4.3.2. Cash Cows (Low Growth, High Market Share)
- 4.3.3. Question Mark (High Growth, Low Market Share)
- 4.3.4. Dogs (Low Growth, Low Market Share)
- 4.4. Ansoff Matrix Analysis
- 4.5. Supply Chain Analysis
- 4.6. Regulatory Landscape
- 4.7. Current Market Potential and Opportunity Assessment (TAM–SAM–SOM Framework)
- 4.8. RAX Analyst Note
- 4.1. Porters Five Forces
- 5. Market Analysis, Insights and Forecast 2021-2033
- 5.1. Market Analysis, Insights and Forecast - by Product
- 5.1.1. Instruments
- 5.1.1.1. Cell Imaging and Analysis Systems
- 5.1.1.2. Flow Cytometers
- 5.1.2. Consumables
- 5.1.2.1. Reagents and Assay Kits
- 5.1.2.2. Microplates
- 5.1.2.3. Other Consumables
- 5.1.3. Software
- 5.1.4. Services
- 5.1.1. Instruments
- 5.2. Market Analysis, Insights and Forecast - by Application
- 5.2.1. Primary and Secondary Screening
- 5.2.2. Target Identification and Validation
- 5.2.3. Toxicity Studies
- 5.2.4. Compound Profiling
- 5.2.5. Other Applications
- 5.3. Market Analysis, Insights and Forecast - by End User
- 5.3.1. Pharmaceutical and Biotechnology Companies
- 5.3.2. Academic and Government Institutions
- 5.3.3. Contract Research Organization
- 5.4. Market Analysis, Insights and Forecast - by Region
- 5.4.1. North America
- 5.4.2. Europe
- 5.4.3. Asia Pacific
- 5.4.4. Middle East and Africa
- 5.4.5. South America
- 5.1. Market Analysis, Insights and Forecast - by Product
- 6. Global High Content Screening Industry Analysis, Insights and Forecast, 2021-2033
- 6.1. Market Analysis, Insights and Forecast - by Product
- 6.1.1. Instruments
- 6.1.1.1. Cell Imaging and Analysis Systems
- 6.1.1.2. Flow Cytometers
- 6.1.2. Consumables
- 6.1.2.1. Reagents and Assay Kits
- 6.1.2.2. Microplates
- 6.1.2.3. Other Consumables
- 6.1.3. Software
- 6.1.4. Services
- 6.1.1. Instruments
- 6.2. Market Analysis, Insights and Forecast - by Application
- 6.2.1. Primary and Secondary Screening
- 6.2.2. Target Identification and Validation
- 6.2.3. Toxicity Studies
- 6.2.4. Compound Profiling
- 6.2.5. Other Applications
- 6.3. Market Analysis, Insights and Forecast - by End User
- 6.3.1. Pharmaceutical and Biotechnology Companies
- 6.3.2. Academic and Government Institutions
- 6.3.3. Contract Research Organization
- 6.1. Market Analysis, Insights and Forecast - by Product
- 7. North America High Content Screening Industry Analysis, Insights and Forecast, 2020-2032
- 7.1. Market Analysis, Insights and Forecast - by Product
- 7.1.1. Instruments
- 7.1.1.1. Cell Imaging and Analysis Systems
- 7.1.1.2. Flow Cytometers
- 7.1.2. Consumables
- 7.1.2.1. Reagents and Assay Kits
- 7.1.2.2. Microplates
- 7.1.2.3. Other Consumables
- 7.1.3. Software
- 7.1.4. Services
- 7.1.1. Instruments
- 7.2. Market Analysis, Insights and Forecast - by Application
- 7.2.1. Primary and Secondary Screening
- 7.2.2. Target Identification and Validation
- 7.2.3. Toxicity Studies
- 7.2.4. Compound Profiling
- 7.2.5. Other Applications
- 7.3. Market Analysis, Insights and Forecast - by End User
- 7.3.1. Pharmaceutical and Biotechnology Companies
- 7.3.2. Academic and Government Institutions
- 7.3.3. Contract Research Organization
- 7.1. Market Analysis, Insights and Forecast - by Product
- 8. Europe High Content Screening Industry Analysis, Insights and Forecast, 2020-2032
- 8.1. Market Analysis, Insights and Forecast - by Product
- 8.1.1. Instruments
- 8.1.1.1. Cell Imaging and Analysis Systems
- 8.1.1.2. Flow Cytometers
- 8.1.2. Consumables
- 8.1.2.1. Reagents and Assay Kits
- 8.1.2.2. Microplates
- 8.1.2.3. Other Consumables
- 8.1.3. Software
- 8.1.4. Services
- 8.1.1. Instruments
- 8.2. Market Analysis, Insights and Forecast - by Application
- 8.2.1. Primary and Secondary Screening
- 8.2.2. Target Identification and Validation
- 8.2.3. Toxicity Studies
- 8.2.4. Compound Profiling
- 8.2.5. Other Applications
- 8.3. Market Analysis, Insights and Forecast - by End User
- 8.3.1. Pharmaceutical and Biotechnology Companies
- 8.3.2. Academic and Government Institutions
- 8.3.3. Contract Research Organization
- 8.1. Market Analysis, Insights and Forecast - by Product
- 9. Asia Pacific High Content Screening Industry Analysis, Insights and Forecast, 2020-2032
- 9.1. Market Analysis, Insights and Forecast - by Product
- 9.1.1. Instruments
- 9.1.1.1. Cell Imaging and Analysis Systems
- 9.1.1.2. Flow Cytometers
- 9.1.2. Consumables
- 9.1.2.1. Reagents and Assay Kits
- 9.1.2.2. Microplates
- 9.1.2.3. Other Consumables
- 9.1.3. Software
- 9.1.4. Services
- 9.1.1. Instruments
- 9.2. Market Analysis, Insights and Forecast - by Application
- 9.2.1. Primary and Secondary Screening
- 9.2.2. Target Identification and Validation
- 9.2.3. Toxicity Studies
- 9.2.4. Compound Profiling
- 9.2.5. Other Applications
- 9.3. Market Analysis, Insights and Forecast - by End User
- 9.3.1. Pharmaceutical and Biotechnology Companies
- 9.3.2. Academic and Government Institutions
- 9.3.3. Contract Research Organization
- 9.1. Market Analysis, Insights and Forecast - by Product
- 10. Middle East and Africa High Content Screening Industry Analysis, Insights and Forecast, 2020-2032
- 10.1. Market Analysis, Insights and Forecast - by Product
- 10.1.1. Instruments
- 10.1.1.1. Cell Imaging and Analysis Systems
- 10.1.1.2. Flow Cytometers
- 10.1.2. Consumables
- 10.1.2.1. Reagents and Assay Kits
- 10.1.2.2. Microplates
- 10.1.2.3. Other Consumables
- 10.1.3. Software
- 10.1.4. Services
- 10.1.1. Instruments
- 10.2. Market Analysis, Insights and Forecast - by Application
- 10.2.1. Primary and Secondary Screening
- 10.2.2. Target Identification and Validation
- 10.2.3. Toxicity Studies
- 10.2.4. Compound Profiling
- 10.2.5. Other Applications
- 10.3. Market Analysis, Insights and Forecast - by End User
- 10.3.1. Pharmaceutical and Biotechnology Companies
- 10.3.2. Academic and Government Institutions
- 10.3.3. Contract Research Organization
- 10.1. Market Analysis, Insights and Forecast - by Product
- 11. South America High Content Screening Industry Analysis, Insights and Forecast, 2020-2032
- 11.1. Market Analysis, Insights and Forecast - by Product
- 11.1.1. Instruments
- 11.1.1.1. Cell Imaging and Analysis Systems
- 11.1.1.2. Flow Cytometers
- 11.1.2. Consumables
- 11.1.2.1. Reagents and Assay Kits
- 11.1.2.2. Microplates
- 11.1.2.3. Other Consumables
- 11.1.3. Software
- 11.1.4. Services
- 11.1.1. Instruments
- 11.2. Market Analysis, Insights and Forecast - by Application
- 11.2.1. Primary and Secondary Screening
- 11.2.2. Target Identification and Validation
- 11.2.3. Toxicity Studies
- 11.2.4. Compound Profiling
- 11.2.5. Other Applications
- 11.3. Market Analysis, Insights and Forecast - by End User
- 11.3.1. Pharmaceutical and Biotechnology Companies
- 11.3.2. Academic and Government Institutions
- 11.3.3. Contract Research Organization
- 11.1. Market Analysis, Insights and Forecast - by Product
- 12. Competitive Analysis
- 12.1. Company Profiles
- 12.1.1 Bio-Rad Laboratories Inc
- 12.1.1.1. Company Overview
- 12.1.1.2. Products
- 12.1.1.3. Company Financials
- 12.1.1.4. SWOT Analysis
- 12.1.2 Perkinelmer Inc
- 12.1.2.1. Company Overview
- 12.1.2.2. Products
- 12.1.2.3. Company Financials
- 12.1.2.4. SWOT Analysis
- 12.1.3 BD (Becton Dickinson and Company)
- 12.1.3.1. Company Overview
- 12.1.3.2. Products
- 12.1.3.3. Company Financials
- 12.1.3.4. SWOT Analysis
- 12.1.4 Thermo Fisher Scientific Inc
- 12.1.4.1. Company Overview
- 12.1.4.2. Products
- 12.1.4.3. Company Financials
- 12.1.4.4. SWOT Analysis
- 12.1.5 Danaher Corporation
- 12.1.5.1. Company Overview
- 12.1.5.2. Products
- 12.1.5.3. Company Financials
- 12.1.5.4. SWOT Analysis
- 12.1.6 Merck KGaA
- 12.1.6.1. Company Overview
- 12.1.6.2. Products
- 12.1.6.3. Company Financials
- 12.1.6.4. SWOT Analysis
- 12.1.7 Yokogawa Electric Corporation
- 12.1.7.1. Company Overview
- 12.1.7.2. Products
- 12.1.7.3. Company Financials
- 12.1.7.4. SWOT Analysis
- 12.1.8 Agilent Technologies
- 12.1.8.1. Company Overview
- 12.1.8.2. Products
- 12.1.8.3. Company Financials
- 12.1.8.4. SWOT Analysis
- 12.1.1 Bio-Rad Laboratories Inc
- 12.2. Market Entropy
- 12.2.1 Company's Key Areas Served
- 12.2.2 Recent Developments
- 12.3. Company Market Share Analysis 2025
- 12.3.1 Top 5 Companies Market Share Analysis
- 12.3.2 Top 3 Companies Market Share Analysis
- 12.4. List of Potential Customers
- 13. Research Methodology
List of Figures
- Figure 1: Global High Content Screening Industry Revenue Breakdown (billion, %) by Region 2025 & 2033
- Figure 2: North America High Content Screening Industry Revenue (billion), by Product 2025 & 2033
- Figure 3: North America High Content Screening Industry Revenue Share (%), by Product 2025 & 2033
- Figure 4: North America High Content Screening Industry Revenue (billion), by Application 2025 & 2033
- Figure 5: North America High Content Screening Industry Revenue Share (%), by Application 2025 & 2033
- Figure 6: North America High Content Screening Industry Revenue (billion), by End User 2025 & 2033
- Figure 7: North America High Content Screening Industry Revenue Share (%), by End User 2025 & 2033
- Figure 8: North America High Content Screening Industry Revenue (billion), by Country 2025 & 2033
- Figure 9: North America High Content Screening Industry Revenue Share (%), by Country 2025 & 2033
- Figure 10: Europe High Content Screening Industry Revenue (billion), by Product 2025 & 2033
- Figure 11: Europe High Content Screening Industry Revenue Share (%), by Product 2025 & 2033
- Figure 12: Europe High Content Screening Industry Revenue (billion), by Application 2025 & 2033
- Figure 13: Europe High Content Screening Industry Revenue Share (%), by Application 2025 & 2033
- Figure 14: Europe High Content Screening Industry Revenue (billion), by End User 2025 & 2033
- Figure 15: Europe High Content Screening Industry Revenue Share (%), by End User 2025 & 2033
- Figure 16: Europe High Content Screening Industry Revenue (billion), by Country 2025 & 2033
- Figure 17: Europe High Content Screening Industry Revenue Share (%), by Country 2025 & 2033
- Figure 18: Asia Pacific High Content Screening Industry Revenue (billion), by Product 2025 & 2033
- Figure 19: Asia Pacific High Content Screening Industry Revenue Share (%), by Product 2025 & 2033
- Figure 20: Asia Pacific High Content Screening Industry Revenue (billion), by Application 2025 & 2033
- Figure 21: Asia Pacific High Content Screening Industry Revenue Share (%), by Application 2025 & 2033
- Figure 22: Asia Pacific High Content Screening Industry Revenue (billion), by End User 2025 & 2033
- Figure 23: Asia Pacific High Content Screening Industry Revenue Share (%), by End User 2025 & 2033
- Figure 24: Asia Pacific High Content Screening Industry Revenue (billion), by Country 2025 & 2033
- Figure 25: Asia Pacific High Content Screening Industry Revenue Share (%), by Country 2025 & 2033
- Figure 26: Middle East and Africa High Content Screening Industry Revenue (billion), by Product 2025 & 2033
- Figure 27: Middle East and Africa High Content Screening Industry Revenue Share (%), by Product 2025 & 2033
- Figure 28: Middle East and Africa High Content Screening Industry Revenue (billion), by Application 2025 & 2033
- Figure 29: Middle East and Africa High Content Screening Industry Revenue Share (%), by Application 2025 & 2033
- Figure 30: Middle East and Africa High Content Screening Industry Revenue (billion), by End User 2025 & 2033
- Figure 31: Middle East and Africa High Content Screening Industry Revenue Share (%), by End User 2025 & 2033
- Figure 32: Middle East and Africa High Content Screening Industry Revenue (billion), by Country 2025 & 2033
- Figure 33: Middle East and Africa High Content Screening Industry Revenue Share (%), by Country 2025 & 2033
- Figure 34: South America High Content Screening Industry Revenue (billion), by Product 2025 & 2033
- Figure 35: South America High Content Screening Industry Revenue Share (%), by Product 2025 & 2033
- Figure 36: South America High Content Screening Industry Revenue (billion), by Application 2025 & 2033
- Figure 37: South America High Content Screening Industry Revenue Share (%), by Application 2025 & 2033
- Figure 38: South America High Content Screening Industry Revenue (billion), by End User 2025 & 2033
- Figure 39: South America High Content Screening Industry Revenue Share (%), by End User 2025 & 2033
- Figure 40: South America High Content Screening Industry Revenue (billion), by Country 2025 & 2033
- Figure 41: South America High Content Screening Industry Revenue Share (%), by Country 2025 & 2033
List of Tables
- Table 1: Global High Content Screening Industry Revenue billion Forecast, by Product 2020 & 2033
- Table 2: Global High Content Screening Industry Revenue billion Forecast, by Application 2020 & 2033
- Table 3: Global High Content Screening Industry Revenue billion Forecast, by End User 2020 & 2033
- Table 4: Global High Content Screening Industry Revenue billion Forecast, by Region 2020 & 2033
- Table 5: Global High Content Screening Industry Revenue billion Forecast, by Product 2020 & 2033
- Table 6: Global High Content Screening Industry Revenue billion Forecast, by Application 2020 & 2033
- Table 7: Global High Content Screening Industry Revenue billion Forecast, by End User 2020 & 2033
- Table 8: Global High Content Screening Industry Revenue billion Forecast, by Country 2020 & 2033
- Table 9: United States High Content Screening Industry Revenue (billion) Forecast, by Application 2020 & 2033
- Table 10: Canada High Content Screening Industry Revenue (billion) Forecast, by Application 2020 & 2033
- Table 11: Mexico High Content Screening Industry Revenue (billion) Forecast, by Application 2020 & 2033
- Table 12: Global High Content Screening Industry Revenue billion Forecast, by Product 2020 & 2033
- Table 13: Global High Content Screening Industry Revenue billion Forecast, by Application 2020 & 2033
- Table 14: Global High Content Screening Industry Revenue billion Forecast, by End User 2020 & 2033
- Table 15: Global High Content Screening Industry Revenue billion Forecast, by Country 2020 & 2033
- Table 16: Germany High Content Screening Industry Revenue (billion) Forecast, by Application 2020 & 2033
- Table 17: United Kingdom High Content Screening Industry Revenue (billion) Forecast, by Application 2020 & 2033
- Table 18: France High Content Screening Industry Revenue (billion) Forecast, by Application 2020 & 2033
- Table 19: Italy High Content Screening Industry Revenue (billion) Forecast, by Application 2020 & 2033
- Table 20: Spain High Content Screening Industry Revenue (billion) Forecast, by Application 2020 & 2033
- Table 21: Rest of Europe High Content Screening Industry Revenue (billion) Forecast, by Application 2020 & 2033
- Table 22: Global High Content Screening Industry Revenue billion Forecast, by Product 2020 & 2033
- Table 23: Global High Content Screening Industry Revenue billion Forecast, by Application 2020 & 2033
- Table 24: Global High Content Screening Industry Revenue billion Forecast, by End User 2020 & 2033
- Table 25: Global High Content Screening Industry Revenue billion Forecast, by Country 2020 & 2033
- Table 26: China High Content Screening Industry Revenue (billion) Forecast, by Application 2020 & 2033
- Table 27: Japan High Content Screening Industry Revenue (billion) Forecast, by Application 2020 & 2033
- Table 28: India High Content Screening Industry Revenue (billion) Forecast, by Application 2020 & 2033
- Table 29: Australia High Content Screening Industry Revenue (billion) Forecast, by Application 2020 & 2033
- Table 30: South Korea High Content Screening Industry Revenue (billion) Forecast, by Application 2020 & 2033
- Table 31: Rest of Asia Pacific High Content Screening Industry Revenue (billion) Forecast, by Application 2020 & 2033
- Table 32: Global High Content Screening Industry Revenue billion Forecast, by Product 2020 & 2033
- Table 33: Global High Content Screening Industry Revenue billion Forecast, by Application 2020 & 2033
- Table 34: Global High Content Screening Industry Revenue billion Forecast, by End User 2020 & 2033
- Table 35: Global High Content Screening Industry Revenue billion Forecast, by Country 2020 & 2033
- Table 36: GCC High Content Screening Industry Revenue (billion) Forecast, by Application 2020 & 2033
- Table 37: South Africa High Content Screening Industry Revenue (billion) Forecast, by Application 2020 & 2033
- Table 38: Rest of Middle East and Africa High Content Screening Industry Revenue (billion) Forecast, by Application 2020 & 2033
- Table 39: Global High Content Screening Industry Revenue billion Forecast, by Product 2020 & 2033
- Table 40: Global High Content Screening Industry Revenue billion Forecast, by Application 2020 & 2033
- Table 41: Global High Content Screening Industry Revenue billion Forecast, by End User 2020 & 2033
- Table 42: Global High Content Screening Industry Revenue billion Forecast, by Country 2020 & 2033
- Table 43: Brazil High Content Screening Industry Revenue (billion) Forecast, by Application 2020 & 2033
- Table 44: Argentina High Content Screening Industry Revenue (billion) Forecast, by Application 2020 & 2033
- Table 45: Rest of South America High Content Screening Industry Revenue (billion) Forecast, by Application 2020 & 2033
Frequently Asked Questions
1. What is the projected Compound Annual Growth Rate (CAGR) of the High Content Screening Industry?
The projected CAGR is approximately 7.5%.
2. Which companies are prominent players in the High Content Screening Industry?
Key companies in the market include Bio-Rad Laboratories Inc, Perkinelmer Inc, BD (Becton Dickinson and Company), Thermo Fisher Scientific Inc, Danaher Corporation, Merck KGaA, Yokogawa Electric Corporation, Agilent Technologies.
3. What are the main segments of the High Content Screening Industry?
The market segments include Product, Application, End User.
4. Can you provide details about the market size?
The market size is estimated to be USD 1.52 billion as of 2022.
5. What are some drivers contributing to market growth?
Government Funding and Venture Capital Investments Across Developed Markets; Increasing Applications of High Content Screening in Life Science Research; Advancements in Informatic Solutions and Imaging Systems.
6. What are the notable trends driving market growth?
Flow Cytometry is Expected to Hold a Significant Market Share Over The Forecast Period.
7. Are there any restraints impacting market growth?
Lower Adoption of High Content Screening Instruments Due to Their High Prices.
8. Can you provide examples of recent developments in the market?
September 2022: BD (Becton, Dickinson and Company) launched BD Research Cloud, a cloud-based software solution designed to streamline the flow cytometry workflow. Its goal is to simplify the workflow for scientists working in a variety of fields, such as immunology, virology, oncology, and infectious disease monitoring, to enable higher-quality experiments with quicker time to insight.
9. What pricing options are available for accessing the report?
Pricing options include single-user, multi-user, and enterprise licenses priced at USD 4750, USD 5250, and USD 8750 respectively.
10. Is the market size provided in terms of value or volume?
The market size is provided in terms of value, measured in billion.
11. Are there any specific market keywords associated with the report?
Yes, the market keyword associated with the report is "High Content Screening Industry," which aids in identifying and referencing the specific market segment covered.
12. How do I determine which pricing option suits my needs best?
The pricing options vary based on user requirements and access needs. Individual users may opt for single-user licenses, while businesses requiring broader access may choose multi-user or enterprise licenses for cost-effective access to the report.
13. Are there any additional resources or data provided in the High Content Screening Industry report?
While the report offers comprehensive insights, it's advisable to review the specific contents or supplementary materials provided to ascertain if additional resources or data are available.
14. How can I stay updated on further developments or reports in the High Content Screening Industry?
To stay informed about further developments, trends, and reports in the High Content Screening Industry, consider subscribing to industry newsletters, following relevant companies and organizations, or regularly checking reputable industry news sources and publications.
Methodology
Step 1 - Identification of Relevant Samples Size from Population Database


Step 2 - Approaches for Defining Global Market Size (Value, Volume* & Price*)

Note*: In applicable scenarios
Step 3 - Data Sources
Primary Research
- Web Analytics
- Survey Reports
- Research Institute
- Latest Research Reports
- Opinion Leaders
Secondary Research
- Annual Reports
- White Paper
- Latest Press Release
- Industry Association
- Paid Database
- Investor Presentations

Step 4 - Data Triangulation
Involves using different sources of information in order to increase the validity of a study
These sources are likely to be stakeholders in a program - participants, other researchers, program staff, other community members, and so on.
Then we put all data in single framework & apply various statistical tools to find out the dynamic on the market.
During the analysis stage, feedback from the stakeholder groups would be compared to determine areas of agreement as well as areas of divergence