

Key Insights
The global Anti Counterfeit Measures in Packaging market is poised for significant expansion, projected to reach an estimated USD 204.08 billion in 2025. This robust growth is driven by an anticipated compound annual growth rate (CAGR) of 9.4% throughout the forecast period of 2025-2033. The increasing sophistication and prevalence of counterfeit products across various industries, including food and beverage, healthcare, and consumer electronics, are compelling manufacturers to invest heavily in advanced authentication and traceability solutions. Regulatory pressures aimed at ensuring product integrity and consumer safety are also acting as powerful catalysts for market adoption. The integration of technologies like trace and track systems, tamper-evident features, and covert and overt markers is becoming indispensable for brands seeking to protect their reputation, revenue, and consumer trust.
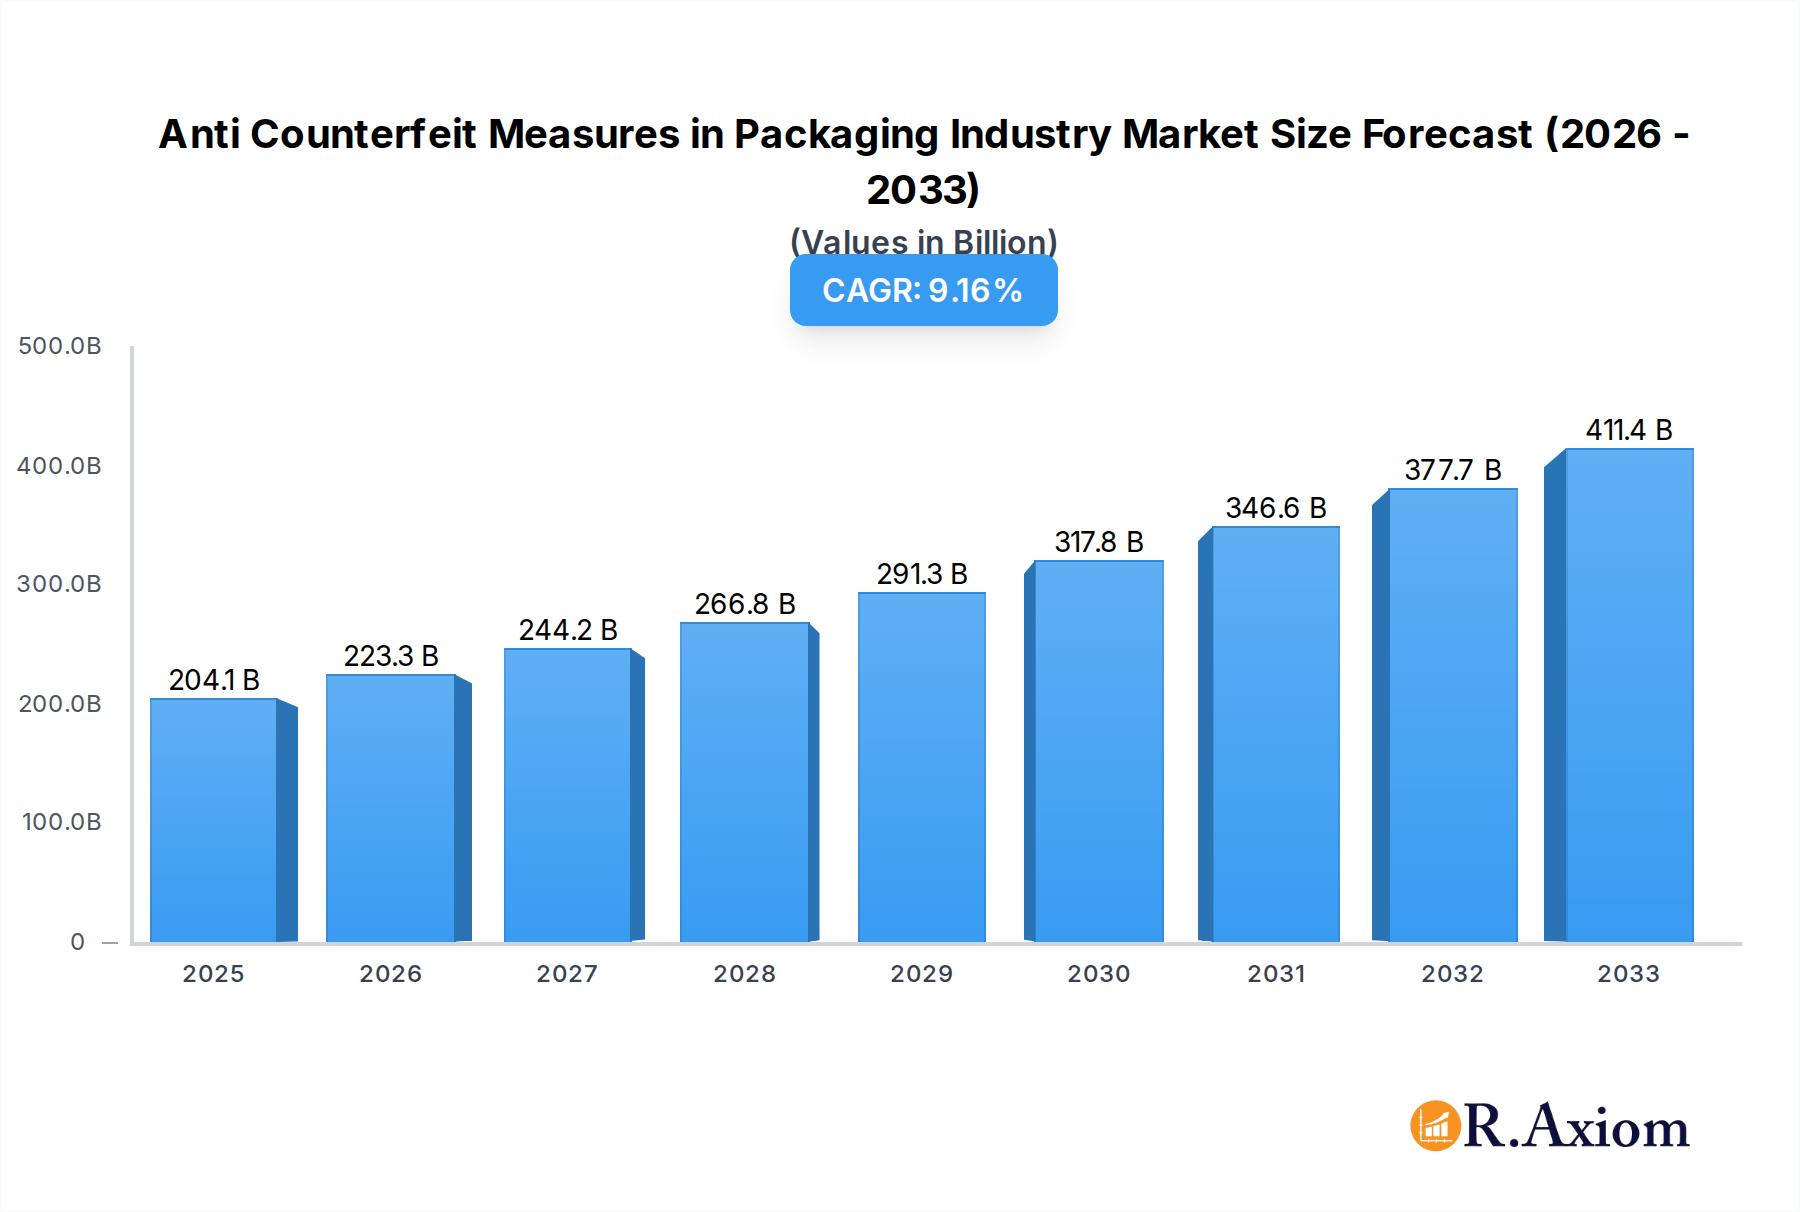
Anti Counterfeit Measures in Packaging Industry Market Size (In Billion)
The market's dynamism is further shaped by key trends such as the burgeoning demand for serialization and track-and-trace solutions in pharmaceuticals to combat drug counterfeiting and the rising adoption of smart packaging technologies incorporating NFC tags and QR codes for enhanced product verification. While the market exhibits strong growth prospects, certain restraints, such as the initial high cost of implementing advanced anti-counterfeiting systems and the need for industry-wide standardization, need to be addressed. However, the overarching need for brand protection and supply chain integrity is expected to outweigh these challenges, paving the way for sustained market advancement. Key segments driving this growth include the trace and track technology, with the food and beverage and healthcare and pharmaceuticals sectors representing major end-user industries. Leading companies are actively innovating and expanding their offerings to capture this growing market.

Anti Counterfeit Measures in Packaging Industry Company Market Share
This in-depth report, covering the Study Period of 2019–2033 with a Base Year of 2025 and a Forecast Period of 2025–2033, provides an exhaustive analysis of the global Anti Counterfeit Measures in Packaging Industry. Delving into critical aspects such as market dynamics, technological advancements, regulatory landscapes, and key player strategies, this report offers actionable insights for stakeholders aiming to navigate and capitalize on this rapidly evolving sector. With historical data from 2019–2024 and detailed projections, industry leaders, manufacturers, and investors will find a strategic roadmap to address the escalating threat of counterfeiting across diverse end-user industries.
Anti Counterfeit Measures in Packaging Industry Market Concentration & Innovation
The Anti Counterfeit Measures in Packaging Industry exhibits a moderate level of market concentration, with several key players holding significant market share, alongside a vibrant ecosystem of niche providers. Innovation serves as a primary driver, fueled by the relentless pursuit of advanced technologies to outmaneuver counterfeiters. Regulatory frameworks worldwide are increasingly stringent, mandating robust anti-counterfeiting solutions, particularly in the Healthcare and Pharmaceuticals and Food and Beverage sectors. The threat of product substitutes, though present in simpler forms of packaging, is being steadily mitigated by sophisticated, multi-layered security features. End-user trends are leaning towards integrated, intelligent packaging solutions that offer both security and enhanced consumer engagement. Mergers and acquisitions (M&A) activities are on the rise, indicating a consolidation trend as larger entities seek to expand their technological capabilities and market reach. For instance, in August 2021, Avery Dennison Corporation acquired Vestcom for an investment of USD 1.45 billion, a significant M&A deal value, aiming to bolster its branded labeling offerings. This strategic move underscores the industry's focus on innovation and market expansion.
Anti Counterfeit Measures in Packaging Industry Industry Trends & Insights
The Anti Counterfeit Measures in Packaging Industry is experiencing robust growth, driven by an escalating global challenge posed by counterfeit goods, estimated to cause trillions in economic losses annually. The market is projected to grow at a substantial Compound Annual Growth Rate (CAGR) of approximately 11.5% from 2025 to 2033. This expansion is propelled by increasing consumer awareness regarding the dangers of counterfeit products, particularly in sectors like pharmaceuticals and food, where authenticity directly impacts health and safety. Technological disruptions are at the forefront, with the integration of Trace and Track technologies, leveraging blockchain and IoT, offering unprecedented supply chain visibility and product authentication. Tamper-evident features are becoming more sophisticated, employing advanced materials and holographic designs to deter unauthorized access. Covert and overt security features, including invisible inks, micro-taggants, and unique serializations, are continuously being developed to provide layers of protection. Market penetration is deepening across all end-user segments, with significant adoption in Consumer Electronics and Industrial and Automotive sectors due to the high value and brand reputation at stake. Consumer preferences are shifting towards products that offer verifiable authenticity, empowering them to make informed purchasing decisions. This creates a strong demand for smart packaging solutions that can be easily verified by consumers using readily available devices. The competitive landscape is dynamic, characterized by strategic partnerships, R&D investments, and a race to develop patent-protected technologies. Companies like PharmaSecure Inc, AlpVision SA, Uflex Limited, Sicpa Holding SA, 3M Company, CCL Industries Inc, Avery Dennison Corporation, Applied Dna Sciences Inc, Authentix Inc, and Zebra Technologies Corporation are at the forefront, investing heavily in innovation to maintain their competitive edge. The increasing regulatory pressure and the economic incentives for brands to protect their intellectual property and revenue streams will continue to be significant market growth drivers.
Dominant Markets & Segments in Anti Counterfeit Measures in Packaging Industry
The Healthcare and Pharmaceuticals segment stands out as a dominant market within the Anti Counterfeit Measures in Packaging Industry, driven by stringent regulatory mandates and the critical need to protect patient safety from counterfeit drugs. The global market size for anti-counterfeiting in this sector is projected to reach over USD 200 billion by 2025. The Trace and Track technology segment is a significant growth engine, with its ability to provide end-to-end visibility of pharmaceutical products throughout the supply chain. Key drivers for this dominance include:
- Regulatory Mandates: Regulations such as the Drug Supply Chain Security Act (DSCSA) in the US and the Falsified Medicines Directive (FMD) in Europe necessitate robust track and trace systems and serialization.
- Patient Safety Concerns: The life-threatening risks associated with counterfeit medications create an urgent demand for foolproof authentication.
- High Product Value: The high price point of many pharmaceutical products makes them attractive targets for counterfeiters, thus justifying significant investment in security measures.
- Technological Advancements: The development of advanced serialization, aggregation, and authentication technologies makes effective implementation feasible.
The Food and Beverage sector is another substantial and rapidly growing segment, driven by concerns over food safety, brand integrity, and consumer trust. Market penetration is increasing as food fraud becomes more prevalent and sophisticated.
- Food Safety Regulations: Increasing global scrutiny on food safety standards pushes manufacturers to implement verifiable authentication methods.
- Brand Reputation Management: Counterfeit food and beverages can severely damage brand equity and consumer loyalty.
- Premium Product Protection: High-value food items, such as premium spirits and organic products, are increasingly targeted and require advanced protection.
Among the technology segments, Trace and Track solutions, powered by technologies like serialization, RFID, NFC, and blockchain, are witnessing the highest adoption rates. This is due to their comprehensive approach to supply chain integrity.
- Supply Chain Visibility: Enables real-time tracking of products from manufacturing to the point of sale.
- Data Integrity: Blockchain technology offers immutable records, ensuring the trustworthiness of supply chain data.
- Consumer Engagement: Integrated with mobile apps, these solutions can provide consumers with product origin and authenticity information.
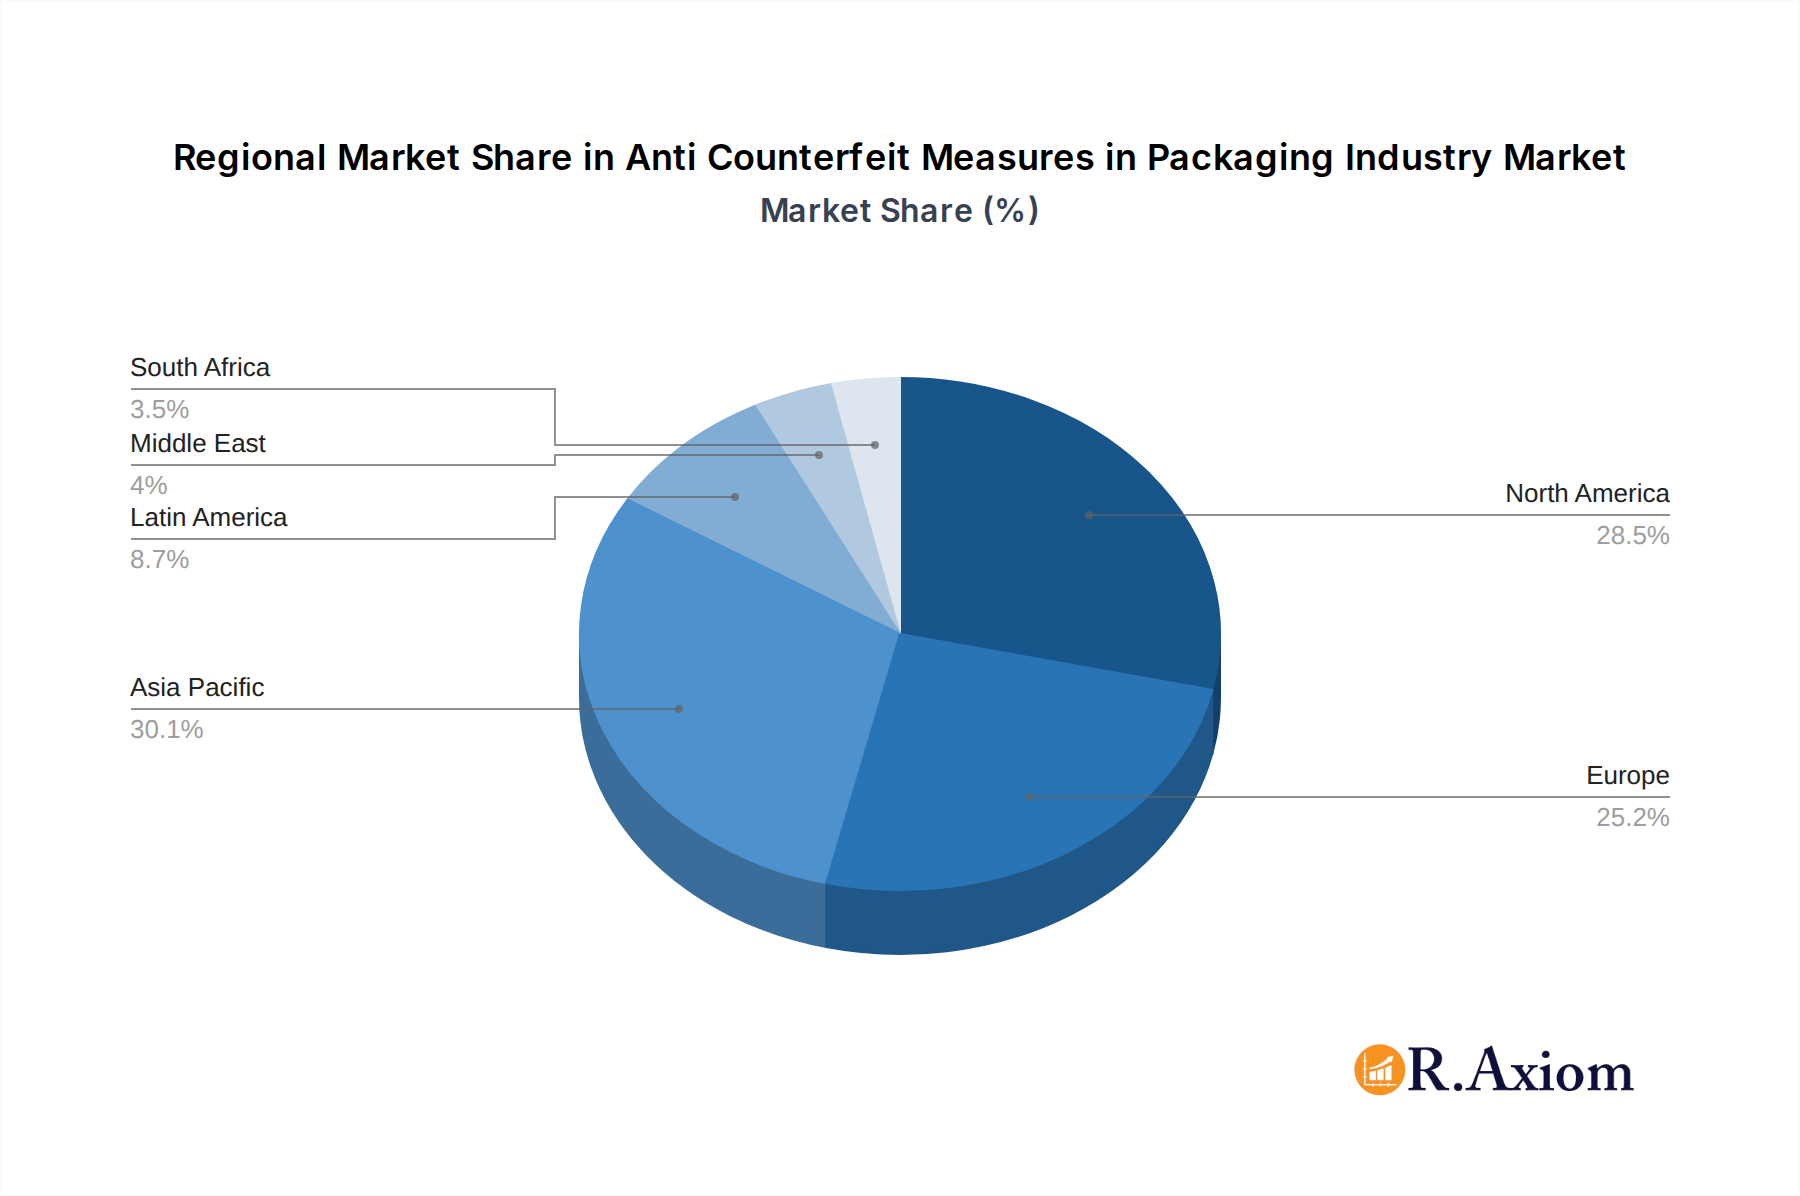
The Asia Pacific region is emerging as a dominant geographical market due to its large manufacturing base, growing consumer markets, and increasing awareness of intellectual property rights. Economic policies favoring technological adoption and infrastructure development further support this growth.
Anti Counterfeit Measures in Packaging Industry Product Developments
Recent product developments in the Anti Counterfeit Measures in Packaging Industry are focused on enhancing integration, user-friendliness, and advanced security features. Innovations include the proliferation of smart labels embedding NFC or RFID chips for seamless track and trace capabilities, alongside the refinement of forensic markers and covert inks offering highly secure, invisible authentication. Companies are also developing integrated solutions that combine multiple security layers, such as tamper-evident seals with unique serial numbers and holographic overlays, providing a comprehensive defense against counterfeiting. The competitive advantage lies in offering scalable, cost-effective, and easily verifiable solutions that meet the diverse needs of industries ranging from pharmaceuticals to consumer electronics, adapting to evolving counterfeiting tactics with cutting-edge technology.
Report Scope & Segmentation Analysis
This report meticulously segments the Anti Counterfeit Measures in Packaging Industry across key technologies and end-user verticals. The technology segmentation includes: Trace and Track, focusing on solutions enabling supply chain visibility and product authentication; Tamper-evident features, designed to indicate unauthorized access; Covert measures, employing hidden security features for authentication; Overt features, utilizing visible security elements like holograms; and Forensic Markers, incorporating unique chemical or biological identifiers. The end-user segmentation encompasses: Food and Beverage, addressing concerns around food safety and brand authenticity; Healthcare and Pharmaceuticals, vital for patient safety and drug integrity; Industrial and Automotive, protecting high-value components and brand reputation; Consumer Electronics, safeguarding against fake devices and parts; and Other End Users, including luxury goods, apparel, and cosmetics. Growth projections indicate substantial market expansion across all segments, with Trace and Track and Healthcare & Pharmaceuticals leading the charge, driven by regulatory compliance and critical safety concerns. Competitive dynamics are characterized by technological innovation and strategic partnerships aimed at providing comprehensive anti-counterfeiting solutions.
Key Drivers of Anti Counterfeit Measures in Packaging Industry Growth
The growth of the Anti Counterfeit Measures in Packaging Industry is propelled by a confluence of powerful drivers. The escalating global prevalence of counterfeit goods across all sectors represents a significant economic and safety threat, compelling businesses to invest in robust protective measures. Stringent regulatory frameworks, particularly in the Healthcare and Pharmaceuticals and Food and Beverage industries, mandate the implementation of track and trace systems and serialization, acting as a major catalyst. Technological advancements in areas such as blockchain, AI-powered authentication, and advanced material science are enabling more sophisticated and cost-effective anti-counterfeiting solutions. Furthermore, growing consumer awareness and demand for authentic products are pushing brands to adopt visible and verifiable security features, thereby enhancing brand loyalty and market trust.
Challenges in the Anti Counterfeit Measures in Packaging Industry Sector
Despite robust growth, the Anti Counterfeit Measures in Packaging Industry faces several challenges. The dynamic and evolving nature of counterfeiting tactics necessitates continuous innovation and investment, creating a perpetual arms race. Implementing comprehensive track and trace systems can be costly, especially for small and medium-sized enterprises, posing a barrier to widespread adoption. Supply chain complexities, particularly in globalized markets, can hinder the effective deployment and management of anti-counterfeiting solutions. Furthermore, varying regulatory landscapes across different regions can create compliance challenges for multinational corporations. The availability of low-cost, less secure alternatives can also exert competitive pressure.
Emerging Opportunities in Anti Counterfeit Measures in Packaging Industry
Emerging opportunities in the Anti Counterfeit Measures in Packaging Industry are abundant, driven by technological innovation and evolving market demands. The integration of Artificial Intelligence (AI) and machine learning for real-time anomaly detection in supply chains presents a significant opportunity. The growing demand for sustainable and eco-friendly anti-counterfeiting solutions, such as biodegradable smart labels, is another key area of development. The expansion of e-commerce and the direct-to-consumer (DTC) model creates new avenues for deploying digital authentication solutions that consumers can easily verify via their smartphones. Furthermore, the increasing focus on supply chain resilience and transparency post-pandemic is driving demand for comprehensive serialization and track and trace solutions.
Leading Players in the Anti Counterfeit Measures in Packaging Industry Market
- PharmaSecure Inc
- AlpVision SA
- Uflex Limited
- Sicpa Holding SA
- 3M Company
- CCL Industries Inc
- Avery Dennison Corporation
- Applied Dna Sciences Inc
- Authentix Inc
- Zebra Technologies Corporation
- E I Du Pont De Nemours and Company
- Ampacet Corporation
Key Developments in Anti Counterfeit Measures in Packaging Industry Industry
- August 2021: Avery Dennison Corporation acquired Vestcom for an investment of USD 1.45 billion. The acquisition will help the company expand its branded labeling offerings for retail and consumer packaged goods industries.
- Ongoing: Continuous advancements in blockchain integration for enhanced supply chain traceability and immutability.
- Ongoing: Development of advanced covert security inks and micro-taggants with enhanced forensic detection capabilities.
- Ongoing: Proliferation of NFC and RFID enabled smart labels for seamless consumer authentication and product information access.
- Ongoing: Increased adoption of AI and machine learning for predictive analytics in detecting counterfeit patterns within supply chains.
Strategic Outlook for Anti Counterfeit Measures in Packaging Industry Market
The strategic outlook for the Anti Counterfeit Measures in Packaging Industry is exceptionally positive, with sustained growth anticipated over the forecast period. The persistent threat of counterfeiting, coupled with increasingly stringent global regulations, will continue to be the primary growth catalyst. Key strategic imperatives for market players will include continued investment in research and development to stay ahead of counterfeiters, fostering strategic partnerships to expand technological offerings and market reach, and focusing on providing integrated, user-friendly solutions that cater to the specific needs of diverse end-user industries. The expansion into emerging markets and the development of sustainable anti-counterfeiting solutions will also be crucial for long-term success and market leadership in this critical sector.
Anti Counterfeit Measures in Packaging Industry Segmentation
-
1. Technology
- 1.1. Trace and Track
- 1.2. Tamper-evident
- 1.3. Covert
- 1.4. Overt
- 1.5. Forensic Markers
-
2. End User
- 2.1. Food and Beverage
- 2.2. Healthcare and Pharmaceuticals
- 2.3. Industrial and Automotive
- 2.4. Consumer Electronics
- 2.5. Other End Users
Anti Counterfeit Measures in Packaging Industry Segmentation By Geography
-
1. North America
- 1.1. United States
- 1.2. Canada
-
2. Europe
- 2.1. United Kingdom
- 2.2. Germany
- 2.3. France
- 2.4. Italy
- 2.5. Spain
- 2.6. Rest of Europe
-
3. Asia Pacific
- 3.1. China
- 3.2. India
- 3.3. Japan
- 3.4. Australia
- 3.5. Rest of Asia Pacific
-
4. Latin America
- 4.1. Brazil
- 4.2. Argentina
- 4.3. Rest of Latin America
- 5. Middle East
-
6. South Africa
- 6.1. United Arab Emirates
- 6.2. Rest of Middle East
Anti Counterfeit Measures in Packaging Industry Regional Market Share
Geographic Coverage of Anti Counterfeit Measures in Packaging Industry
Anti Counterfeit Measures in Packaging Industry REPORT HIGHLIGHTS
| Aspects | Details |
|---|---|
| Study Period | 2020-2034 |
| Base Year | 2025 |
| Estimated Year | 2026 |
| Forecast Period | 2026-2034 |
| Historical Period | 2020-2025 |
| Growth Rate | CAGR of 9.4% from 2020-2034 |
| Segmentation |
|
Table of Contents
- 1. Introduction
- 1.1. Research Scope
- 1.2. Market Segmentation
- 1.3. Research Objective
- 1.4. Definitions and Assumptions
- 2. Executive Summary
- 2.1. Market Snapshot
- 3. Market Dynamics
- 3.1. Market Drivers
- 3.2. Market Restrains
- 3.3. Market Trends
- 3.4. Market Opportunities
- 4. Market Factor Analysis
- 4.1. Porters Five Forces
- 4.1.1. Bargaining Power of Suppliers
- 4.1.2. Bargaining Power of Buyers
- 4.1.3. Threat of New Entrants
- 4.1.4. Threat of Substitutes
- 4.1.5. Competitive Rivalry
- 4.2. PESTEL analysis
- 4.3. BCG Analysis
- 4.3.1. Stars (High Growth, High Market Share)
- 4.3.2. Cash Cows (Low Growth, High Market Share)
- 4.3.3. Question Mark (High Growth, Low Market Share)
- 4.3.4. Dogs (Low Growth, Low Market Share)
- 4.4. Ansoff Matrix Analysis
- 4.5. Supply Chain Analysis
- 4.6. Regulatory Landscape
- 4.7. Current Market Potential and Opportunity Assessment (TAM–SAM–SOM Framework)
- 4.8. RAX Analyst Note
- 4.1. Porters Five Forces
- 5. Market Analysis, Insights and Forecast 2021-2033
- 5.1. Market Analysis, Insights and Forecast - by Technology
- 5.1.1. Trace and Track
- 5.1.2. Tamper-evident
- 5.1.3. Covert
- 5.1.4. Overt
- 5.1.5. Forensic Markers
- 5.2. Market Analysis, Insights and Forecast - by End User
- 5.2.1. Food and Beverage
- 5.2.2. Healthcare and Pharmaceuticals
- 5.2.3. Industrial and Automotive
- 5.2.4. Consumer Electronics
- 5.2.5. Other End Users
- 5.3. Market Analysis, Insights and Forecast - by Region
- 5.3.1. North America
- 5.3.2. Europe
- 5.3.3. Asia Pacific
- 5.3.4. Latin America
- 5.3.5. Middle East
- 5.3.6. South Africa
- 5.1. Market Analysis, Insights and Forecast - by Technology
- 6. Global Anti Counterfeit Measures in Packaging Industry Analysis, Insights and Forecast, 2021-2033
- 6.1. Market Analysis, Insights and Forecast - by Technology
- 6.1.1. Trace and Track
- 6.1.2. Tamper-evident
- 6.1.3. Covert
- 6.1.4. Overt
- 6.1.5. Forensic Markers
- 6.2. Market Analysis, Insights and Forecast - by End User
- 6.2.1. Food and Beverage
- 6.2.2. Healthcare and Pharmaceuticals
- 6.2.3. Industrial and Automotive
- 6.2.4. Consumer Electronics
- 6.2.5. Other End Users
- 6.1. Market Analysis, Insights and Forecast - by Technology
- 7. North America Anti Counterfeit Measures in Packaging Industry Analysis, Insights and Forecast, 2020-2032
- 7.1. Market Analysis, Insights and Forecast - by Technology
- 7.1.1. Trace and Track
- 7.1.2. Tamper-evident
- 7.1.3. Covert
- 7.1.4. Overt
- 7.1.5. Forensic Markers
- 7.2. Market Analysis, Insights and Forecast - by End User
- 7.2.1. Food and Beverage
- 7.2.2. Healthcare and Pharmaceuticals
- 7.2.3. Industrial and Automotive
- 7.2.4. Consumer Electronics
- 7.2.5. Other End Users
- 7.1. Market Analysis, Insights and Forecast - by Technology
- 8. Europe Anti Counterfeit Measures in Packaging Industry Analysis, Insights and Forecast, 2020-2032
- 8.1. Market Analysis, Insights and Forecast - by Technology
- 8.1.1. Trace and Track
- 8.1.2. Tamper-evident
- 8.1.3. Covert
- 8.1.4. Overt
- 8.1.5. Forensic Markers
- 8.2. Market Analysis, Insights and Forecast - by End User
- 8.2.1. Food and Beverage
- 8.2.2. Healthcare and Pharmaceuticals
- 8.2.3. Industrial and Automotive
- 8.2.4. Consumer Electronics
- 8.2.5. Other End Users
- 8.1. Market Analysis, Insights and Forecast - by Technology
- 9. Asia Pacific Anti Counterfeit Measures in Packaging Industry Analysis, Insights and Forecast, 2020-2032
- 9.1. Market Analysis, Insights and Forecast - by Technology
- 9.1.1. Trace and Track
- 9.1.2. Tamper-evident
- 9.1.3. Covert
- 9.1.4. Overt
- 9.1.5. Forensic Markers
- 9.2. Market Analysis, Insights and Forecast - by End User
- 9.2.1. Food and Beverage
- 9.2.2. Healthcare and Pharmaceuticals
- 9.2.3. Industrial and Automotive
- 9.2.4. Consumer Electronics
- 9.2.5. Other End Users
- 9.1. Market Analysis, Insights and Forecast - by Technology
- 10. Latin America Anti Counterfeit Measures in Packaging Industry Analysis, Insights and Forecast, 2020-2032
- 10.1. Market Analysis, Insights and Forecast - by Technology
- 10.1.1. Trace and Track
- 10.1.2. Tamper-evident
- 10.1.3. Covert
- 10.1.4. Overt
- 10.1.5. Forensic Markers
- 10.2. Market Analysis, Insights and Forecast - by End User
- 10.2.1. Food and Beverage
- 10.2.2. Healthcare and Pharmaceuticals
- 10.2.3. Industrial and Automotive
- 10.2.4. Consumer Electronics
- 10.2.5. Other End Users
- 10.1. Market Analysis, Insights and Forecast - by Technology
- 11. Middle East Anti Counterfeit Measures in Packaging Industry Analysis, Insights and Forecast, 2020-2032
- 11.1. Market Analysis, Insights and Forecast - by Technology
- 11.1.1. Trace and Track
- 11.1.2. Tamper-evident
- 11.1.3. Covert
- 11.1.4. Overt
- 11.1.5. Forensic Markers
- 11.2. Market Analysis, Insights and Forecast - by End User
- 11.2.1. Food and Beverage
- 11.2.2. Healthcare and Pharmaceuticals
- 11.2.3. Industrial and Automotive
- 11.2.4. Consumer Electronics
- 11.2.5. Other End Users
- 11.1. Market Analysis, Insights and Forecast - by Technology
- 12. South Africa Anti Counterfeit Measures in Packaging Industry Analysis, Insights and Forecast, 2020-2032
- 12.1. Market Analysis, Insights and Forecast - by Technology
- 12.1.1. Trace and Track
- 12.1.2. Tamper-evident
- 12.1.3. Covert
- 12.1.4. Overt
- 12.1.5. Forensic Markers
- 12.2. Market Analysis, Insights and Forecast - by End User
- 12.2.1. Food and Beverage
- 12.2.2. Healthcare and Pharmaceuticals
- 12.2.3. Industrial and Automotive
- 12.2.4. Consumer Electronics
- 12.2.5. Other End Users
- 12.1. Market Analysis, Insights and Forecast - by Technology
- 13. Competitive Analysis
- 13.1. Company Profiles
- 13.1.1 PharmaSecure Inc *List Not Exhaustive
- 13.1.1.1. Company Overview
- 13.1.1.2. Products
- 13.1.1.3. Company Financials
- 13.1.1.4. SWOT Analysis
- 13.1.2 AlpVision SA
- 13.1.2.1. Company Overview
- 13.1.2.2. Products
- 13.1.2.3. Company Financials
- 13.1.2.4. SWOT Analysis
- 13.1.3 Uflex Limited
- 13.1.3.1. Company Overview
- 13.1.3.2. Products
- 13.1.3.3. Company Financials
- 13.1.3.4. SWOT Analysis
- 13.1.4 Sicpa Holding SA
- 13.1.4.1. Company Overview
- 13.1.4.2. Products
- 13.1.4.3. Company Financials
- 13.1.4.4. SWOT Analysis
- 13.1.5 3M Company
- 13.1.5.1. Company Overview
- 13.1.5.2. Products
- 13.1.5.3. Company Financials
- 13.1.5.4. SWOT Analysis
- 13.1.6 CCL Industries Inc
- 13.1.6.1. Company Overview
- 13.1.6.2. Products
- 13.1.6.3. Company Financials
- 13.1.6.4. SWOT Analysis
- 13.1.7 Avery Dennison Corporation
- 13.1.7.1. Company Overview
- 13.1.7.2. Products
- 13.1.7.3. Company Financials
- 13.1.7.4. SWOT Analysis
- 13.1.8 Applied Dna Sciences Inc
- 13.1.8.1. Company Overview
- 13.1.8.2. Products
- 13.1.8.3. Company Financials
- 13.1.8.4. SWOT Analysis
- 13.1.9 Authentix Inc
- 13.1.9.1. Company Overview
- 13.1.9.2. Products
- 13.1.9.3. Company Financials
- 13.1.9.4. SWOT Analysis
- 13.1.10 Zebra Technologies Corporation
- 13.1.10.1. Company Overview
- 13.1.10.2. Products
- 13.1.10.3. Company Financials
- 13.1.10.4. SWOT Analysis
- 13.1.11 E I Du Pont De Nemours and Company
- 13.1.11.1. Company Overview
- 13.1.11.2. Products
- 13.1.11.3. Company Financials
- 13.1.11.4. SWOT Analysis
- 13.1.12 Ampacet Corporation
- 13.1.12.1. Company Overview
- 13.1.12.2. Products
- 13.1.12.3. Company Financials
- 13.1.12.4. SWOT Analysis
- 13.1.1 PharmaSecure Inc *List Not Exhaustive
- 13.2. Market Entropy
- 13.2.1 Company's Key Areas Served
- 13.2.2 Recent Developments
- 13.3. Company Market Share Analysis 2025
- 13.3.1 Top 5 Companies Market Share Analysis
- 13.3.2 Top 3 Companies Market Share Analysis
- 13.4. List of Potential Customers
- 14. Research Methodology
List of Figures
- Figure 1: Global Anti Counterfeit Measures in Packaging Industry Revenue Breakdown (billion, %) by Region 2025 & 2033
- Figure 2: North America Anti Counterfeit Measures in Packaging Industry Revenue (billion), by Technology 2025 & 2033
- Figure 3: North America Anti Counterfeit Measures in Packaging Industry Revenue Share (%), by Technology 2025 & 2033
- Figure 4: North America Anti Counterfeit Measures in Packaging Industry Revenue (billion), by End User 2025 & 2033
- Figure 5: North America Anti Counterfeit Measures in Packaging Industry Revenue Share (%), by End User 2025 & 2033
- Figure 6: North America Anti Counterfeit Measures in Packaging Industry Revenue (billion), by Country 2025 & 2033
- Figure 7: North America Anti Counterfeit Measures in Packaging Industry Revenue Share (%), by Country 2025 & 2033
- Figure 8: Europe Anti Counterfeit Measures in Packaging Industry Revenue (billion), by Technology 2025 & 2033
- Figure 9: Europe Anti Counterfeit Measures in Packaging Industry Revenue Share (%), by Technology 2025 & 2033
- Figure 10: Europe Anti Counterfeit Measures in Packaging Industry Revenue (billion), by End User 2025 & 2033
- Figure 11: Europe Anti Counterfeit Measures in Packaging Industry Revenue Share (%), by End User 2025 & 2033
- Figure 12: Europe Anti Counterfeit Measures in Packaging Industry Revenue (billion), by Country 2025 & 2033
- Figure 13: Europe Anti Counterfeit Measures in Packaging Industry Revenue Share (%), by Country 2025 & 2033
- Figure 14: Asia Pacific Anti Counterfeit Measures in Packaging Industry Revenue (billion), by Technology 2025 & 2033
- Figure 15: Asia Pacific Anti Counterfeit Measures in Packaging Industry Revenue Share (%), by Technology 2025 & 2033
- Figure 16: Asia Pacific Anti Counterfeit Measures in Packaging Industry Revenue (billion), by End User 2025 & 2033
- Figure 17: Asia Pacific Anti Counterfeit Measures in Packaging Industry Revenue Share (%), by End User 2025 & 2033
- Figure 18: Asia Pacific Anti Counterfeit Measures in Packaging Industry Revenue (billion), by Country 2025 & 2033
- Figure 19: Asia Pacific Anti Counterfeit Measures in Packaging Industry Revenue Share (%), by Country 2025 & 2033
- Figure 20: Latin America Anti Counterfeit Measures in Packaging Industry Revenue (billion), by Technology 2025 & 2033
- Figure 21: Latin America Anti Counterfeit Measures in Packaging Industry Revenue Share (%), by Technology 2025 & 2033
- Figure 22: Latin America Anti Counterfeit Measures in Packaging Industry Revenue (billion), by End User 2025 & 2033
- Figure 23: Latin America Anti Counterfeit Measures in Packaging Industry Revenue Share (%), by End User 2025 & 2033
- Figure 24: Latin America Anti Counterfeit Measures in Packaging Industry Revenue (billion), by Country 2025 & 2033
- Figure 25: Latin America Anti Counterfeit Measures in Packaging Industry Revenue Share (%), by Country 2025 & 2033
- Figure 26: Middle East Anti Counterfeit Measures in Packaging Industry Revenue (billion), by Technology 2025 & 2033
- Figure 27: Middle East Anti Counterfeit Measures in Packaging Industry Revenue Share (%), by Technology 2025 & 2033
- Figure 28: Middle East Anti Counterfeit Measures in Packaging Industry Revenue (billion), by End User 2025 & 2033
- Figure 29: Middle East Anti Counterfeit Measures in Packaging Industry Revenue Share (%), by End User 2025 & 2033
- Figure 30: Middle East Anti Counterfeit Measures in Packaging Industry Revenue (billion), by Country 2025 & 2033
- Figure 31: Middle East Anti Counterfeit Measures in Packaging Industry Revenue Share (%), by Country 2025 & 2033
- Figure 32: South Africa Anti Counterfeit Measures in Packaging Industry Revenue (billion), by Technology 2025 & 2033
- Figure 33: South Africa Anti Counterfeit Measures in Packaging Industry Revenue Share (%), by Technology 2025 & 2033
- Figure 34: South Africa Anti Counterfeit Measures in Packaging Industry Revenue (billion), by End User 2025 & 2033
- Figure 35: South Africa Anti Counterfeit Measures in Packaging Industry Revenue Share (%), by End User 2025 & 2033
- Figure 36: South Africa Anti Counterfeit Measures in Packaging Industry Revenue (billion), by Country 2025 & 2033
- Figure 37: South Africa Anti Counterfeit Measures in Packaging Industry Revenue Share (%), by Country 2025 & 2033
List of Tables
- Table 1: Global Anti Counterfeit Measures in Packaging Industry Revenue billion Forecast, by Technology 2020 & 2033
- Table 2: Global Anti Counterfeit Measures in Packaging Industry Revenue billion Forecast, by End User 2020 & 2033
- Table 3: Global Anti Counterfeit Measures in Packaging Industry Revenue billion Forecast, by Region 2020 & 2033
- Table 4: Global Anti Counterfeit Measures in Packaging Industry Revenue billion Forecast, by Technology 2020 & 2033
- Table 5: Global Anti Counterfeit Measures in Packaging Industry Revenue billion Forecast, by End User 2020 & 2033
- Table 6: Global Anti Counterfeit Measures in Packaging Industry Revenue billion Forecast, by Country 2020 & 2033
- Table 7: United States Anti Counterfeit Measures in Packaging Industry Revenue (billion) Forecast, by Application 2020 & 2033
- Table 8: Canada Anti Counterfeit Measures in Packaging Industry Revenue (billion) Forecast, by Application 2020 & 2033
- Table 9: Global Anti Counterfeit Measures in Packaging Industry Revenue billion Forecast, by Technology 2020 & 2033
- Table 10: Global Anti Counterfeit Measures in Packaging Industry Revenue billion Forecast, by End User 2020 & 2033
- Table 11: Global Anti Counterfeit Measures in Packaging Industry Revenue billion Forecast, by Country 2020 & 2033
- Table 12: United Kingdom Anti Counterfeit Measures in Packaging Industry Revenue (billion) Forecast, by Application 2020 & 2033
- Table 13: Germany Anti Counterfeit Measures in Packaging Industry Revenue (billion) Forecast, by Application 2020 & 2033
- Table 14: France Anti Counterfeit Measures in Packaging Industry Revenue (billion) Forecast, by Application 2020 & 2033
- Table 15: Italy Anti Counterfeit Measures in Packaging Industry Revenue (billion) Forecast, by Application 2020 & 2033
- Table 16: Spain Anti Counterfeit Measures in Packaging Industry Revenue (billion) Forecast, by Application 2020 & 2033
- Table 17: Rest of Europe Anti Counterfeit Measures in Packaging Industry Revenue (billion) Forecast, by Application 2020 & 2033
- Table 18: Global Anti Counterfeit Measures in Packaging Industry Revenue billion Forecast, by Technology 2020 & 2033
- Table 19: Global Anti Counterfeit Measures in Packaging Industry Revenue billion Forecast, by End User 2020 & 2033
- Table 20: Global Anti Counterfeit Measures in Packaging Industry Revenue billion Forecast, by Country 2020 & 2033
- Table 21: China Anti Counterfeit Measures in Packaging Industry Revenue (billion) Forecast, by Application 2020 & 2033
- Table 22: India Anti Counterfeit Measures in Packaging Industry Revenue (billion) Forecast, by Application 2020 & 2033
- Table 23: Japan Anti Counterfeit Measures in Packaging Industry Revenue (billion) Forecast, by Application 2020 & 2033
- Table 24: Australia Anti Counterfeit Measures in Packaging Industry Revenue (billion) Forecast, by Application 2020 & 2033
- Table 25: Rest of Asia Pacific Anti Counterfeit Measures in Packaging Industry Revenue (billion) Forecast, by Application 2020 & 2033
- Table 26: Global Anti Counterfeit Measures in Packaging Industry Revenue billion Forecast, by Technology 2020 & 2033
- Table 27: Global Anti Counterfeit Measures in Packaging Industry Revenue billion Forecast, by End User 2020 & 2033
- Table 28: Global Anti Counterfeit Measures in Packaging Industry Revenue billion Forecast, by Country 2020 & 2033
- Table 29: Brazil Anti Counterfeit Measures in Packaging Industry Revenue (billion) Forecast, by Application 2020 & 2033
- Table 30: Argentina Anti Counterfeit Measures in Packaging Industry Revenue (billion) Forecast, by Application 2020 & 2033
- Table 31: Rest of Latin America Anti Counterfeit Measures in Packaging Industry Revenue (billion) Forecast, by Application 2020 & 2033
- Table 32: Global Anti Counterfeit Measures in Packaging Industry Revenue billion Forecast, by Technology 2020 & 2033
- Table 33: Global Anti Counterfeit Measures in Packaging Industry Revenue billion Forecast, by End User 2020 & 2033
- Table 34: Global Anti Counterfeit Measures in Packaging Industry Revenue billion Forecast, by Country 2020 & 2033
- Table 35: Global Anti Counterfeit Measures in Packaging Industry Revenue billion Forecast, by Technology 2020 & 2033
- Table 36: Global Anti Counterfeit Measures in Packaging Industry Revenue billion Forecast, by End User 2020 & 2033
- Table 37: Global Anti Counterfeit Measures in Packaging Industry Revenue billion Forecast, by Country 2020 & 2033
- Table 38: United Arab Emirates Anti Counterfeit Measures in Packaging Industry Revenue (billion) Forecast, by Application 2020 & 2033
- Table 39: Rest of Middle East Anti Counterfeit Measures in Packaging Industry Revenue (billion) Forecast, by Application 2020 & 2033
Frequently Asked Questions
1. What is the projected Compound Annual Growth Rate (CAGR) of the Anti Counterfeit Measures in Packaging Industry?
The projected CAGR is approximately 9.4%.
2. Which companies are prominent players in the Anti Counterfeit Measures in Packaging Industry?
Key companies in the market include PharmaSecure Inc *List Not Exhaustive, AlpVision SA, Uflex Limited, Sicpa Holding SA, 3M Company, CCL Industries Inc, Avery Dennison Corporation, Applied Dna Sciences Inc, Authentix Inc, Zebra Technologies Corporation, E I Du Pont De Nemours and Company, Ampacet Corporation.
3. What are the main segments of the Anti Counterfeit Measures in Packaging Industry?
The market segments include Technology, End User.
4. Can you provide details about the market size?
The market size is estimated to be USD 204.08 billion as of 2022.
5. What are some drivers contributing to market growth?
Booming E-commerce Industry; Increasing Focus of Manufacturers on Brand Protection.
6. What are the notable trends driving market growth?
Pharmaceuticals and Healthcare to Drive the Market Demand.
7. Are there any restraints impacting market growth?
High-initial Costs.
8. Can you provide examples of recent developments in the market?
In August 2021, - Avery Dennison Corporation acquired Vestcom for an investment of USD 1.45 billion. The acquisition will help the company expand its branded labeling offerings for retail and consumer packaged goods industries.
9. What pricing options are available for accessing the report?
Pricing options include single-user, multi-user, and enterprise licenses priced at USD 4750, USD 5250, and USD 8750 respectively.
10. Is the market size provided in terms of value or volume?
The market size is provided in terms of value, measured in billion.
11. Are there any specific market keywords associated with the report?
Yes, the market keyword associated with the report is "Anti Counterfeit Measures in Packaging Industry," which aids in identifying and referencing the specific market segment covered.
12. How do I determine which pricing option suits my needs best?
The pricing options vary based on user requirements and access needs. Individual users may opt for single-user licenses, while businesses requiring broader access may choose multi-user or enterprise licenses for cost-effective access to the report.
13. Are there any additional resources or data provided in the Anti Counterfeit Measures in Packaging Industry report?
While the report offers comprehensive insights, it's advisable to review the specific contents or supplementary materials provided to ascertain if additional resources or data are available.
14. How can I stay updated on further developments or reports in the Anti Counterfeit Measures in Packaging Industry?
To stay informed about further developments, trends, and reports in the Anti Counterfeit Measures in Packaging Industry, consider subscribing to industry newsletters, following relevant companies and organizations, or regularly checking reputable industry news sources and publications.
Methodology
Step 1 - Identification of Relevant Samples Size from Population Database


Step 2 - Approaches for Defining Global Market Size (Value, Volume* & Price*)

Note*: In applicable scenarios
Step 3 - Data Sources
Primary Research
- Web Analytics
- Survey Reports
- Research Institute
- Latest Research Reports
- Opinion Leaders
Secondary Research
- Annual Reports
- White Paper
- Latest Press Release
- Industry Association
- Paid Database
- Investor Presentations

Step 4 - Data Triangulation
Involves using different sources of information in order to increase the validity of a study
These sources are likely to be stakeholders in a program - participants, other researchers, program staff, other community members, and so on.
Then we put all data in single framework & apply various statistical tools to find out the dynamic on the market.
During the analysis stage, feedback from the stakeholder groups would be compared to determine areas of agreement as well as areas of divergence