

Key Insights
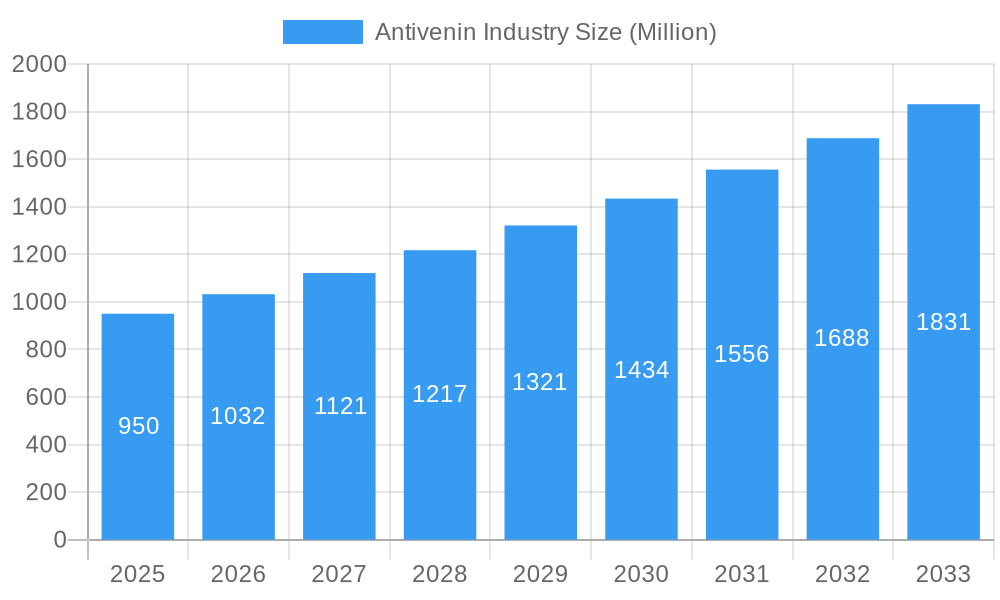
The global antivenin market is projected for robust expansion, reaching an estimated market size of 1.24 billion by 2025, driven by a compound annual growth rate (CAGR) of 3.13%. This growth is propelled by increasing incidences of venomous creature bites and stings worldwide, particularly in biodiversity-rich and agriculturally active regions. Heightened public and professional awareness of timely antivenin administration and advancements in production technologies enhancing efficacy and safety are key market drivers. Supportive government initiatives focused on improving access to essential antivenom treatments and reducing mortality rates further bolster market dynamics.
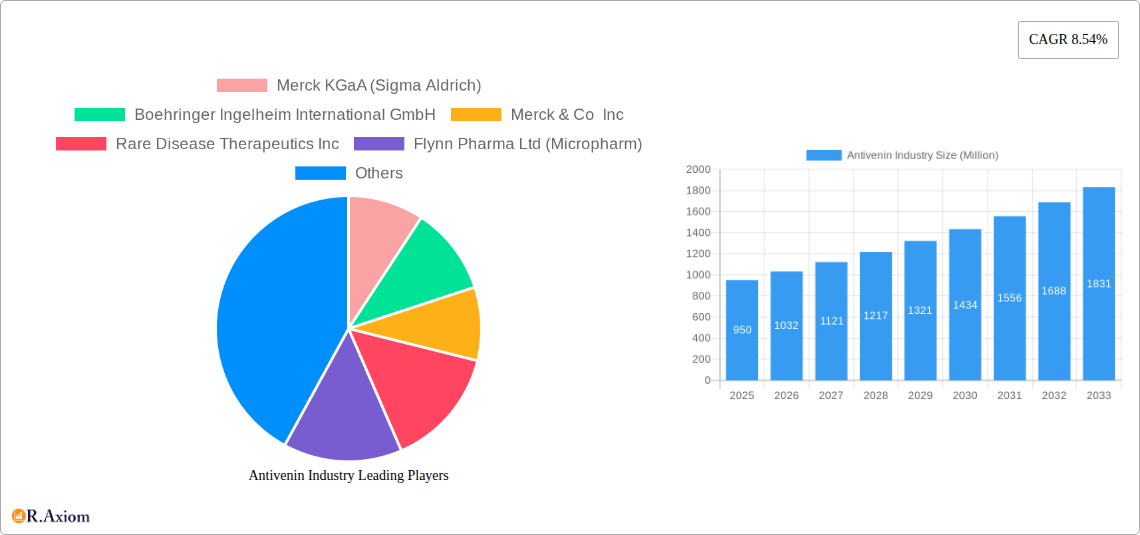
Antivenin Industry Market Size (In Billion)
The antivenin market is segmented by species, with snakes, scorpions, and spiders being primary categories. Polyvalent antivenoms are expected to dominate, alongside specialized monovalent options. Geographically, Asia Pacific is anticipated to lead due to its large population and agricultural focus. North America and Europe represent significant markets with strong R&D. Emerging economies in the Middle East, Africa, and South America offer substantial growth potential due to higher venomous incident prevalence and improving healthcare access. Challenges include high production and distribution costs, particularly in remote areas, and the development of effective antivenoms for rare venoms.
Antivenin Industry Company Market Share
Antivenin Industry: Comprehensive Market Analysis and Future Outlook (2019-2033)
This in-depth report provides a comprehensive analysis of the global Antivenin Industry, encompassing market dynamics, key trends, growth drivers, challenges, and strategic opportunities. With a study period from 2019 to 2033, a base year of 2025, and a forecast period from 2025 to 2033, this report offers critical insights for industry stakeholders, including manufacturers, researchers, policymakers, and investors. The report delves into market concentration, innovation, regulatory landscapes, and competitive strategies, equipping stakeholders with the knowledge to navigate and capitalize on the evolving antivenin market.
Antivenin Industry Market Concentration & Innovation
The Antivenin Industry, while vital, exhibits moderate to high market concentration, with a few key players dominating production and distribution. Innovation is a critical differentiator, driven by the need for more effective, safer, and broadly neutralizing antivenoms. Regulatory frameworks, such as stringent approval processes by bodies like the FDA and EMA, significantly influence market entry and product development. Product substitutes, while limited in direct efficacy, include supportive care and, in some instances, antivenoms for related species. End-user trends point towards increased demand in regions with higher snakebite incidence and a growing emphasis on rapid treatment protocols. Mergers and acquisitions (M&A) are strategic tools for expanding product portfolios and geographical reach. For example, a recent M&A deal in the vaccine sector, while not directly antivenin, indicates significant investment potential in biological therapeutics, with estimated M&A deal values reaching several hundred million dollars annually across related biopharmaceutical segments.
- Market Concentration: Dominated by key global biopharmaceutical companies.
- Innovation Drivers: Enhanced efficacy, reduced side effects, broader spectrum neutralization, and cost-effectiveness.
- Regulatory Frameworks: Strict oversight by health authorities for product safety and efficacy.
- Product Substitutes: Supportive medical interventions.
- End-User Trends: Rising demand in endemic regions, increasing healthcare access, and faster diagnostic capabilities.
- M&A Activities: Strategic consolidation to enhance market share and R&D capabilities.
Antivenin Industry Industry Trends & Insights
The Antivenin Industry is experiencing robust growth, propelled by several interconnected trends and insights. A primary growth driver is the persistent burden of snakebite envenoming, particularly in tropical and subtropical regions of Asia, Africa, and Latin America, where snakebite is a significant public health concern, leading to an estimated xx million deaths and long-term disabilities annually. The growing awareness among healthcare providers and the public regarding the severity of snakebite incidents is further fueling market expansion. Technological advancements in recombinant DNA technology and advanced purification techniques are enabling the development of more potent and specific antivenoms, thereby improving patient outcomes. The rising incidence of venomous animal bites and stings beyond snakes, including scorpions and spiders, is broadening the market scope for various antivenom types. Government initiatives and non-governmental organization (NGO) support in endemic countries are crucial in improving access to life-saving antivenoms, contributing significantly to market penetration. The projected Compound Annual Growth Rate (CAGR) for the Antivenin Industry is estimated to be around xx% during the forecast period. Furthermore, an increase in global healthcare expenditure and improved diagnostic capabilities for identifying specific venom types are key market penetration factors, allowing for more targeted and effective treatment. The development of thermostable antivenoms also addresses logistical challenges in remote areas, expanding their accessibility.
Dominant Markets & Segments in Antivenin Industry
The Antivenin Industry is characterized by a dominant global market, with Asia Pacific emerging as a leading region due to its high prevalence of snakebite envenoming. Countries like India, Indonesia, and Vietnam, with large rural populations and significant agricultural activity, experience a disproportionately high number of snakebites, driving substantial demand for antivenoms. The species segment most impacting the market is Snake, accounting for an estimated xx% of the total antivenom market size. This dominance stems from the widespread distribution of venomous snakes and the inherent toxicity of their venoms. Within the antivenom type segmentation, Polyvalent Anti-venoms hold a commanding share, estimated at xx% of the market. Their broad-spectrum activity against multiple venom components from various species found within a specific geographic region makes them highly practical and cost-effective for emergency medical response.
- Leading Region: Asia Pacific, driven by high snakebite incidence and population density.
- Dominant Species: Snake, with an estimated xx% market share, due to global distribution and venom toxicity.
- Dominant Anti-venom Type: Polyvalent Anti-venoms, representing xx% of the market, offering broad-spectrum efficacy against multiple venom types.
- Key Drivers for Dominance:
- Economic Policies: Government funding for public health initiatives and antivenom procurement programs in endemic countries.
- Infrastructure: Development of healthcare facilities and cold chain logistics for antivenom distribution in remote areas.
- Awareness Campaigns: Public and healthcare professional education on snakebite prevention and timely treatment.
- Research & Development: Continuous efforts to improve antivenom efficacy and reduce adverse reactions.
- Technological Advancements: Improved manufacturing processes leading to higher quality and more accessible antivenoms.
The market penetration in these dominant segments is further supported by factors such as the availability of affordable antivenoms and supportive international aid. The market size for snake antivenoms alone is projected to reach xx million dollars by 2033.
Antivenin Industry Product Developments
Product development in the Antivenin Industry is focused on enhancing therapeutic efficacy and patient safety. Innovations include the development of recombinant antivenoms, which offer greater specificity and reduced immunogenicity compared to traditional plasma-derived products. Advances in purification technologies are leading to antivenoms with lower protein impurities, minimizing the risk of allergic reactions. Furthermore, research into thermostable antivenoms addresses the critical challenge of maintaining efficacy in regions with limited cold chain infrastructure. The development of diagnostic tools that rapidly identify venom composition allows for the administration of more targeted antivenoms, improving treatment outcomes and reducing unnecessary exposure to broad-spectrum treatments. Competitive advantages are being gained through faster production cycles and reduced manufacturing costs associated with these novel approaches.
Report Scope & Segmentation Analysis
This report provides a comprehensive segmentation of the Antivenin Industry.
- Species: The market is segmented into Snake, Scorpion, Spiders, and Other Species. The Snake segment is expected to dominate with a market size of xx million dollars by 2033, driven by widespread distribution and the severity of envenomation. Scorpion and Spider antivenoms represent niche but growing segments, with market sizes of xx million and xx million dollars respectively.
- Anti-venom Type: Key segments include Polyvalent Anti-venoms, Monovalent Anti-venom, and Other Anti-venom Types. Polyvalent anti-venoms are forecast to hold the largest market share, estimated at xx million dollars by 2033, due to their broad applicability in diverse geographic settings. Monovalent anti-venoms, offering targeted therapy, are expected to grow at a CAGR of xx%.
Key Drivers of Antivenin Industry Growth
Several factors are propelling the growth of the Antivenin Industry.
- Increasing Incidence of Venomous Bites: The high prevalence of snakebite envenoming in tropical and subtropical regions, coupled with rising numbers of scorpion and spider bites, directly fuels demand.
- Technological Advancements: Innovations in biotechnology, such as recombinant DNA technology and improved purification methods, are leading to more effective and safer antivenoms.
- Government Initiatives and Public Health Focus: Increased investment in healthcare infrastructure and dedicated antivenom programs by governments in endemic nations are crucial growth catalysts.
- Growing Awareness and Accessibility: Enhanced public health education and improved distribution networks are making antivenoms more accessible to affected populations.
Challenges in the Antivenin Industry Sector
Despite its growth potential, the Antivenin Industry faces significant challenges.
- Regulatory Hurdles: Stringent and lengthy approval processes for new antivenoms can delay market entry and increase development costs.
- Supply Chain and Cold Chain Issues: Maintaining the efficacy of temperature-sensitive antivenoms, especially in remote or resource-limited areas, poses a constant logistical challenge.
- High Cost of Production: The complex manufacturing process and relatively low market demand in non-endemic regions contribute to the high cost of antivenoms, limiting accessibility.
- Limited Research and Development Investment: Compared to other pharmaceutical sectors, R&D investment in antivenoms can be insufficient, slowing down the development of novel and improved products.
- Antivenom Resistance: The emergence of resistance to existing antivenoms due to venom evolution or variations presents a long-term challenge.
Emerging Opportunities in Antivenin Industry
The Antivenin Industry is ripe with emerging opportunities.
- Development of Universal Antivenoms: Research into broadly neutralizing antivenoms that can effectively treat a wide range of venomous bites is a significant opportunity.
- Expansion into Emerging Markets: Increased focus on neglected tropical diseases is leading to greater attention and investment in antivenom production and distribution in under-served regions.
- Integration of AI and Machine Learning: Utilizing AI for venom analysis and antivenom design can accelerate R&D processes and identify novel therapeutic targets.
- Public-Private Partnerships: Collaborations between research institutions, pharmaceutical companies, and NGOs can streamline R&D, manufacturing, and distribution efforts.
- Thermostable Antivenom Development: Creating antivenoms that do not require refrigeration will revolutionize access in challenging geographical locations.
Leading Players in the Antivenin Industry Market
- Merck KGaA (Sigma Aldrich)
- Boehringer Ingelheim International GmbH
- Merck & Co Inc
- Rare Disease Therapeutics Inc
- Flynn Pharma Ltd (Micropharm)
- South African Vaccine Producers (Pty) Ltd
- Bharat Serums and Vaccines Ltd
- CSL Limited
- Boston Scientific Corporation
- Pfizer Inc
Key Developments in Antivenin Industry Industry
- July 2022: Foundation of the Antivenom Research and Development Centre (AVRDC) at the Institute of Bioinformatics and Applied Biotechnology (IBAB), Bengaluru Helix Biotech Park, Electronics City, to boost antivenom production activities.
- April 2022: Signing of a complementary agreement between Brazil and the Republic of the Union of Myanmar for the project "Improving methodologies and techniques for the production of antivenom serum in Myanmar - phase II: antivenom quality." The aim is to enhance the quality and performance of antivenom serum produced in Myanmar.
Strategic Outlook for Antivenin Industry Market
The strategic outlook for the Antivenin Industry is one of significant growth and innovation. The persistent global burden of snakebite envenoming, coupled with advancements in biotechnology, presents a strong foundation for market expansion. Key growth catalysts include increased government investment in public health infrastructure, greater awareness of snakebite as a neglected tropical disease, and the development of more effective and accessible antivenoms. Strategic partnerships between manufacturers, research institutions, and NGOs will be crucial in overcoming challenges related to production costs and distribution. The ongoing research into recombinant antivenoms and thermostable formulations holds immense potential for revolutionizing treatment and improving patient outcomes globally, driving the market towards an estimated value of xx Billion dollars by 2033.
Antivenin Industry Segmentation
-
1. Species
- 1.1. Snake
- 1.2. Scorpion
- 1.3. Spiders
- 1.4. Other Species
-
2. Anti-venom Type
- 2.1. Polyvalent Anti-venoms
- 2.2. Monovalent Anti-venom
- 2.3. Other Anti-venom Types
Antivenin Industry Segmentation By Geography
-
1. North America
- 1.1. United States
- 1.2. Canada
- 1.3. Mexico
-
2. Europe
- 2.1. Germany
- 2.2. United Kingdom
- 2.3. France
- 2.4. Italy
- 2.5. Spain
- 2.6. Rest of Europe
-
3. Asia Pacific
- 3.1. China
- 3.2. Japan
- 3.3. India
- 3.4. Australia
- 3.5. South Korea
- 3.6. Rest of Asia Pacific
-
4. Middle East and Africa
- 4.1. GCC
- 4.2. South Africa
- 4.3. Rest of Middle East and Africa
-
5. South America
- 5.1. Brazil
- 5.2. Argentina
- 5.3. Rest of South America
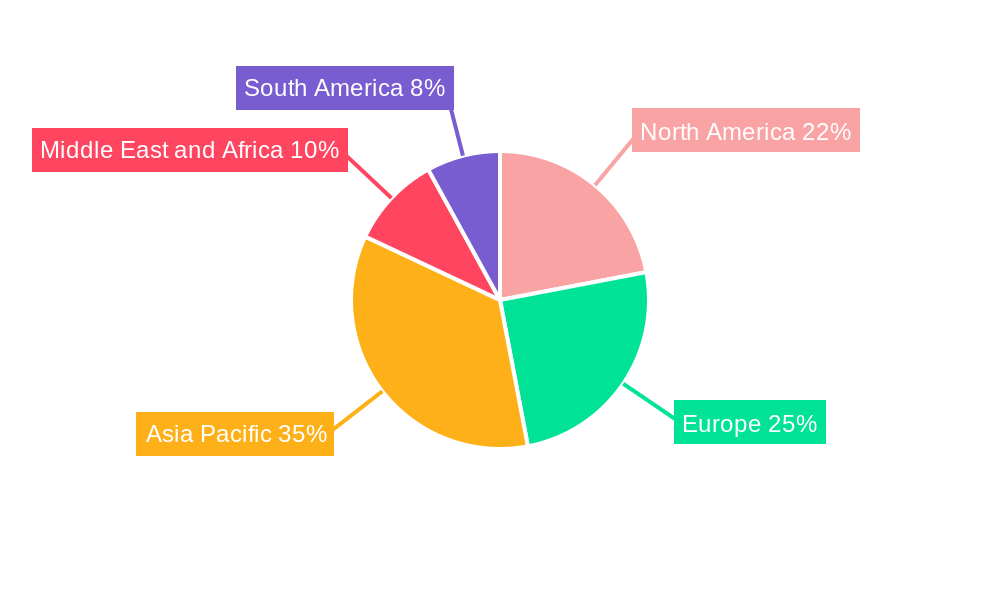
Antivenin Industry Regional Market Share
Geographic Coverage of Antivenin Industry
Antivenin Industry REPORT HIGHLIGHTS
| Aspects | Details |
|---|---|
| Study Period | 2020-2034 |
| Base Year | 2025 |
| Estimated Year | 2026 |
| Forecast Period | 2026-2034 |
| Historical Period | 2020-2025 |
| Growth Rate | CAGR of 3.13% from 2020-2034 |
| Segmentation |
|
Table of Contents
- 1. Introduction
- 1.1. Research Scope
- 1.2. Market Segmentation
- 1.3. Research Objective
- 1.4. Definitions and Assumptions
- 2. Executive Summary
- 2.1. Market Snapshot
- 3. Market Dynamics
- 3.1. Market Drivers
- 3.2. Market Restrains
- 3.3. Market Trends
- 3.4. Market Opportunities
- 4. Market Factor Analysis
- 4.1. Porters Five Forces
- 4.1.1. Bargaining Power of Suppliers
- 4.1.2. Bargaining Power of Buyers
- 4.1.3. Threat of New Entrants
- 4.1.4. Threat of Substitutes
- 4.1.5. Competitive Rivalry
- 4.2. PESTEL analysis
- 4.3. BCG Analysis
- 4.3.1. Stars (High Growth, High Market Share)
- 4.3.2. Cash Cows (Low Growth, High Market Share)
- 4.3.3. Question Mark (High Growth, Low Market Share)
- 4.3.4. Dogs (Low Growth, Low Market Share)
- 4.4. Ansoff Matrix Analysis
- 4.5. Supply Chain Analysis
- 4.6. Regulatory Landscape
- 4.7. Current Market Potential and Opportunity Assessment (TAM–SAM–SOM Framework)
- 4.8. RAX Analyst Note
- 4.1. Porters Five Forces
- 5. Market Analysis, Insights and Forecast 2021-2033
- 5.1. Market Analysis, Insights and Forecast - by Species
- 5.1.1. Snake
- 5.1.2. Scorpion
- 5.1.3. Spiders
- 5.1.4. Other Species
- 5.2. Market Analysis, Insights and Forecast - by Anti-venom Type
- 5.2.1. Polyvalent Anti-venoms
- 5.2.2. Monovalent Anti-venom
- 5.2.3. Other Anti-venom Types
- 5.3. Market Analysis, Insights and Forecast - by Region
- 5.3.1. North America
- 5.3.2. Europe
- 5.3.3. Asia Pacific
- 5.3.4. Middle East and Africa
- 5.3.5. South America
- 5.1. Market Analysis, Insights and Forecast - by Species
- 6. Global Antivenin Industry Analysis, Insights and Forecast, 2021-2033
- 6.1. Market Analysis, Insights and Forecast - by Species
- 6.1.1. Snake
- 6.1.2. Scorpion
- 6.1.3. Spiders
- 6.1.4. Other Species
- 6.2. Market Analysis, Insights and Forecast - by Anti-venom Type
- 6.2.1. Polyvalent Anti-venoms
- 6.2.2. Monovalent Anti-venom
- 6.2.3. Other Anti-venom Types
- 6.1. Market Analysis, Insights and Forecast - by Species
- 7. North America Antivenin Industry Analysis, Insights and Forecast, 2020-2032
- 7.1. Market Analysis, Insights and Forecast - by Species
- 7.1.1. Snake
- 7.1.2. Scorpion
- 7.1.3. Spiders
- 7.1.4. Other Species
- 7.2. Market Analysis, Insights and Forecast - by Anti-venom Type
- 7.2.1. Polyvalent Anti-venoms
- 7.2.2. Monovalent Anti-venom
- 7.2.3. Other Anti-venom Types
- 7.1. Market Analysis, Insights and Forecast - by Species
- 8. Europe Antivenin Industry Analysis, Insights and Forecast, 2020-2032
- 8.1. Market Analysis, Insights and Forecast - by Species
- 8.1.1. Snake
- 8.1.2. Scorpion
- 8.1.3. Spiders
- 8.1.4. Other Species
- 8.2. Market Analysis, Insights and Forecast - by Anti-venom Type
- 8.2.1. Polyvalent Anti-venoms
- 8.2.2. Monovalent Anti-venom
- 8.2.3. Other Anti-venom Types
- 8.1. Market Analysis, Insights and Forecast - by Species
- 9. Asia Pacific Antivenin Industry Analysis, Insights and Forecast, 2020-2032
- 9.1. Market Analysis, Insights and Forecast - by Species
- 9.1.1. Snake
- 9.1.2. Scorpion
- 9.1.3. Spiders
- 9.1.4. Other Species
- 9.2. Market Analysis, Insights and Forecast - by Anti-venom Type
- 9.2.1. Polyvalent Anti-venoms
- 9.2.2. Monovalent Anti-venom
- 9.2.3. Other Anti-venom Types
- 9.1. Market Analysis, Insights and Forecast - by Species
- 10. Middle East and Africa Antivenin Industry Analysis, Insights and Forecast, 2020-2032
- 10.1. Market Analysis, Insights and Forecast - by Species
- 10.1.1. Snake
- 10.1.2. Scorpion
- 10.1.3. Spiders
- 10.1.4. Other Species
- 10.2. Market Analysis, Insights and Forecast - by Anti-venom Type
- 10.2.1. Polyvalent Anti-venoms
- 10.2.2. Monovalent Anti-venom
- 10.2.3. Other Anti-venom Types
- 10.1. Market Analysis, Insights and Forecast - by Species
- 11. South America Antivenin Industry Analysis, Insights and Forecast, 2020-2032
- 11.1. Market Analysis, Insights and Forecast - by Species
- 11.1.1. Snake
- 11.1.2. Scorpion
- 11.1.3. Spiders
- 11.1.4. Other Species
- 11.2. Market Analysis, Insights and Forecast - by Anti-venom Type
- 11.2.1. Polyvalent Anti-venoms
- 11.2.2. Monovalent Anti-venom
- 11.2.3. Other Anti-venom Types
- 11.1. Market Analysis, Insights and Forecast - by Species
- 12. Competitive Analysis
- 12.1. Company Profiles
- 12.1.1 Merck KGaA (Sigma Aldrich)
- 12.1.1.1. Company Overview
- 12.1.1.2. Products
- 12.1.1.3. Company Financials
- 12.1.1.4. SWOT Analysis
- 12.1.2 Boehringer Ingelheim International GmbH
- 12.1.2.1. Company Overview
- 12.1.2.2. Products
- 12.1.2.3. Company Financials
- 12.1.2.4. SWOT Analysis
- 12.1.3 Merck & Co Inc
- 12.1.3.1. Company Overview
- 12.1.3.2. Products
- 12.1.3.3. Company Financials
- 12.1.3.4. SWOT Analysis
- 12.1.4 Rare Disease Therapeutics Inc
- 12.1.4.1. Company Overview
- 12.1.4.2. Products
- 12.1.4.3. Company Financials
- 12.1.4.4. SWOT Analysis
- 12.1.5 Flynn Pharma Ltd (Micropharm)
- 12.1.5.1. Company Overview
- 12.1.5.2. Products
- 12.1.5.3. Company Financials
- 12.1.5.4. SWOT Analysis
- 12.1.6 South African Vaccine Producers (Pty) Ltd*List Not Exhaustive
- 12.1.6.1. Company Overview
- 12.1.6.2. Products
- 12.1.6.3. Company Financials
- 12.1.6.4. SWOT Analysis
- 12.1.7 Bharat Serums and Vaccines Ltd
- 12.1.7.1. Company Overview
- 12.1.7.2. Products
- 12.1.7.3. Company Financials
- 12.1.7.4. SWOT Analysis
- 12.1.8 CSL Limited
- 12.1.8.1. Company Overview
- 12.1.8.2. Products
- 12.1.8.3. Company Financials
- 12.1.8.4. SWOT Analysis
- 12.1.9 Boston Scientific Corporation
- 12.1.9.1. Company Overview
- 12.1.9.2. Products
- 12.1.9.3. Company Financials
- 12.1.9.4. SWOT Analysis
- 12.1.10 Pfizer Inc
- 12.1.10.1. Company Overview
- 12.1.10.2. Products
- 12.1.10.3. Company Financials
- 12.1.10.4. SWOT Analysis
- 12.1.1 Merck KGaA (Sigma Aldrich)
- 12.2. Market Entropy
- 12.2.1 Company's Key Areas Served
- 12.2.2 Recent Developments
- 12.3. Company Market Share Analysis 2025
- 12.3.1 Top 5 Companies Market Share Analysis
- 12.3.2 Top 3 Companies Market Share Analysis
- 12.4. List of Potential Customers
- 13. Research Methodology
List of Figures
- Figure 1: Global Antivenin Industry Revenue Breakdown (billion, %) by Region 2025 & 2033
- Figure 2: North America Antivenin Industry Revenue (billion), by Species 2025 & 2033
- Figure 3: North America Antivenin Industry Revenue Share (%), by Species 2025 & 2033
- Figure 4: North America Antivenin Industry Revenue (billion), by Anti-venom Type 2025 & 2033
- Figure 5: North America Antivenin Industry Revenue Share (%), by Anti-venom Type 2025 & 2033
- Figure 6: North America Antivenin Industry Revenue (billion), by Country 2025 & 2033
- Figure 7: North America Antivenin Industry Revenue Share (%), by Country 2025 & 2033
- Figure 8: Europe Antivenin Industry Revenue (billion), by Species 2025 & 2033
- Figure 9: Europe Antivenin Industry Revenue Share (%), by Species 2025 & 2033
- Figure 10: Europe Antivenin Industry Revenue (billion), by Anti-venom Type 2025 & 2033
- Figure 11: Europe Antivenin Industry Revenue Share (%), by Anti-venom Type 2025 & 2033
- Figure 12: Europe Antivenin Industry Revenue (billion), by Country 2025 & 2033
- Figure 13: Europe Antivenin Industry Revenue Share (%), by Country 2025 & 2033
- Figure 14: Asia Pacific Antivenin Industry Revenue (billion), by Species 2025 & 2033
- Figure 15: Asia Pacific Antivenin Industry Revenue Share (%), by Species 2025 & 2033
- Figure 16: Asia Pacific Antivenin Industry Revenue (billion), by Anti-venom Type 2025 & 2033
- Figure 17: Asia Pacific Antivenin Industry Revenue Share (%), by Anti-venom Type 2025 & 2033
- Figure 18: Asia Pacific Antivenin Industry Revenue (billion), by Country 2025 & 2033
- Figure 19: Asia Pacific Antivenin Industry Revenue Share (%), by Country 2025 & 2033
- Figure 20: Middle East and Africa Antivenin Industry Revenue (billion), by Species 2025 & 2033
- Figure 21: Middle East and Africa Antivenin Industry Revenue Share (%), by Species 2025 & 2033
- Figure 22: Middle East and Africa Antivenin Industry Revenue (billion), by Anti-venom Type 2025 & 2033
- Figure 23: Middle East and Africa Antivenin Industry Revenue Share (%), by Anti-venom Type 2025 & 2033
- Figure 24: Middle East and Africa Antivenin Industry Revenue (billion), by Country 2025 & 2033
- Figure 25: Middle East and Africa Antivenin Industry Revenue Share (%), by Country 2025 & 2033
- Figure 26: South America Antivenin Industry Revenue (billion), by Species 2025 & 2033
- Figure 27: South America Antivenin Industry Revenue Share (%), by Species 2025 & 2033
- Figure 28: South America Antivenin Industry Revenue (billion), by Anti-venom Type 2025 & 2033
- Figure 29: South America Antivenin Industry Revenue Share (%), by Anti-venom Type 2025 & 2033
- Figure 30: South America Antivenin Industry Revenue (billion), by Country 2025 & 2033
- Figure 31: South America Antivenin Industry Revenue Share (%), by Country 2025 & 2033
List of Tables
- Table 1: Global Antivenin Industry Revenue billion Forecast, by Species 2020 & 2033
- Table 2: Global Antivenin Industry Revenue billion Forecast, by Anti-venom Type 2020 & 2033
- Table 3: Global Antivenin Industry Revenue billion Forecast, by Region 2020 & 2033
- Table 4: Global Antivenin Industry Revenue billion Forecast, by Species 2020 & 2033
- Table 5: Global Antivenin Industry Revenue billion Forecast, by Anti-venom Type 2020 & 2033
- Table 6: Global Antivenin Industry Revenue billion Forecast, by Country 2020 & 2033
- Table 7: United States Antivenin Industry Revenue (billion) Forecast, by Application 2020 & 2033
- Table 8: Canada Antivenin Industry Revenue (billion) Forecast, by Application 2020 & 2033
- Table 9: Mexico Antivenin Industry Revenue (billion) Forecast, by Application 2020 & 2033
- Table 10: Global Antivenin Industry Revenue billion Forecast, by Species 2020 & 2033
- Table 11: Global Antivenin Industry Revenue billion Forecast, by Anti-venom Type 2020 & 2033
- Table 12: Global Antivenin Industry Revenue billion Forecast, by Country 2020 & 2033
- Table 13: Germany Antivenin Industry Revenue (billion) Forecast, by Application 2020 & 2033
- Table 14: United Kingdom Antivenin Industry Revenue (billion) Forecast, by Application 2020 & 2033
- Table 15: France Antivenin Industry Revenue (billion) Forecast, by Application 2020 & 2033
- Table 16: Italy Antivenin Industry Revenue (billion) Forecast, by Application 2020 & 2033
- Table 17: Spain Antivenin Industry Revenue (billion) Forecast, by Application 2020 & 2033
- Table 18: Rest of Europe Antivenin Industry Revenue (billion) Forecast, by Application 2020 & 2033
- Table 19: Global Antivenin Industry Revenue billion Forecast, by Species 2020 & 2033
- Table 20: Global Antivenin Industry Revenue billion Forecast, by Anti-venom Type 2020 & 2033
- Table 21: Global Antivenin Industry Revenue billion Forecast, by Country 2020 & 2033
- Table 22: China Antivenin Industry Revenue (billion) Forecast, by Application 2020 & 2033
- Table 23: Japan Antivenin Industry Revenue (billion) Forecast, by Application 2020 & 2033
- Table 24: India Antivenin Industry Revenue (billion) Forecast, by Application 2020 & 2033
- Table 25: Australia Antivenin Industry Revenue (billion) Forecast, by Application 2020 & 2033
- Table 26: South Korea Antivenin Industry Revenue (billion) Forecast, by Application 2020 & 2033
- Table 27: Rest of Asia Pacific Antivenin Industry Revenue (billion) Forecast, by Application 2020 & 2033
- Table 28: Global Antivenin Industry Revenue billion Forecast, by Species 2020 & 2033
- Table 29: Global Antivenin Industry Revenue billion Forecast, by Anti-venom Type 2020 & 2033
- Table 30: Global Antivenin Industry Revenue billion Forecast, by Country 2020 & 2033
- Table 31: GCC Antivenin Industry Revenue (billion) Forecast, by Application 2020 & 2033
- Table 32: South Africa Antivenin Industry Revenue (billion) Forecast, by Application 2020 & 2033
- Table 33: Rest of Middle East and Africa Antivenin Industry Revenue (billion) Forecast, by Application 2020 & 2033
- Table 34: Global Antivenin Industry Revenue billion Forecast, by Species 2020 & 2033
- Table 35: Global Antivenin Industry Revenue billion Forecast, by Anti-venom Type 2020 & 2033
- Table 36: Global Antivenin Industry Revenue billion Forecast, by Country 2020 & 2033
- Table 37: Brazil Antivenin Industry Revenue (billion) Forecast, by Application 2020 & 2033
- Table 38: Argentina Antivenin Industry Revenue (billion) Forecast, by Application 2020 & 2033
- Table 39: Rest of South America Antivenin Industry Revenue (billion) Forecast, by Application 2020 & 2033
Frequently Asked Questions
1. What is the projected Compound Annual Growth Rate (CAGR) of the Antivenin Industry?
The projected CAGR is approximately 3.13%.
2. Which companies are prominent players in the Antivenin Industry?
Key companies in the market include Merck KGaA (Sigma Aldrich), Boehringer Ingelheim International GmbH, Merck & Co Inc, Rare Disease Therapeutics Inc, Flynn Pharma Ltd (Micropharm), South African Vaccine Producers (Pty) Ltd*List Not Exhaustive, Bharat Serums and Vaccines Ltd, CSL Limited, Boston Scientific Corporation, Pfizer Inc.
3. What are the main segments of the Antivenin Industry?
The market segments include Species, Anti-venom Type.
4. Can you provide details about the market size?
The market size is estimated to be USD 1.24 billion as of 2022.
5. What are some drivers contributing to market growth?
Increasing Awareness on Anti-venoms Available; Technological Advancements.
6. What are the notable trends driving market growth?
The Polyvalent Anti-venoms Segment is Expected to Hold Significant Share in the Market Over the Forecast Period.
7. Are there any restraints impacting market growth?
Complexities Involved in the Preparation of the Correct Immunogens; Lack of Regulatory Capacity for the Control of Anti-venoms in Countries.
8. Can you provide examples of recent developments in the market?
In July 2022, the foundation of the Antivenom Research and Development Centre (AVRDC) was laid at the Institute of Bioinformatics and Applied Biotechnology (IBAB), Bengaluru Helix Biotech Park, Electronics City, to boost the production activities for antivenom.
9. What pricing options are available for accessing the report?
Pricing options include single-user, multi-user, and enterprise licenses priced at USD 4750, USD 5250, and USD 8750 respectively.
10. Is the market size provided in terms of value or volume?
The market size is provided in terms of value, measured in billion.
11. Are there any specific market keywords associated with the report?
Yes, the market keyword associated with the report is "Antivenin Industry," which aids in identifying and referencing the specific market segment covered.
12. How do I determine which pricing option suits my needs best?
The pricing options vary based on user requirements and access needs. Individual users may opt for single-user licenses, while businesses requiring broader access may choose multi-user or enterprise licenses for cost-effective access to the report.
13. Are there any additional resources or data provided in the Antivenin Industry report?
While the report offers comprehensive insights, it's advisable to review the specific contents or supplementary materials provided to ascertain if additional resources or data are available.
14. How can I stay updated on further developments or reports in the Antivenin Industry?
To stay informed about further developments, trends, and reports in the Antivenin Industry, consider subscribing to industry newsletters, following relevant companies and organizations, or regularly checking reputable industry news sources and publications.
Methodology
Step 1 - Identification of Relevant Samples Size from Population Database


Step 2 - Approaches for Defining Global Market Size (Value, Volume* & Price*)

Note*: In applicable scenarios
Step 3 - Data Sources
Primary Research
- Web Analytics
- Survey Reports
- Research Institute
- Latest Research Reports
- Opinion Leaders
Secondary Research
- Annual Reports
- White Paper
- Latest Press Release
- Industry Association
- Paid Database
- Investor Presentations

Step 4 - Data Triangulation
Involves using different sources of information in order to increase the validity of a study
These sources are likely to be stakeholders in a program - participants, other researchers, program staff, other community members, and so on.
Then we put all data in single framework & apply various statistical tools to find out the dynamic on the market.
During the analysis stage, feedback from the stakeholder groups would be compared to determine areas of agreement as well as areas of divergence