
Key Insights
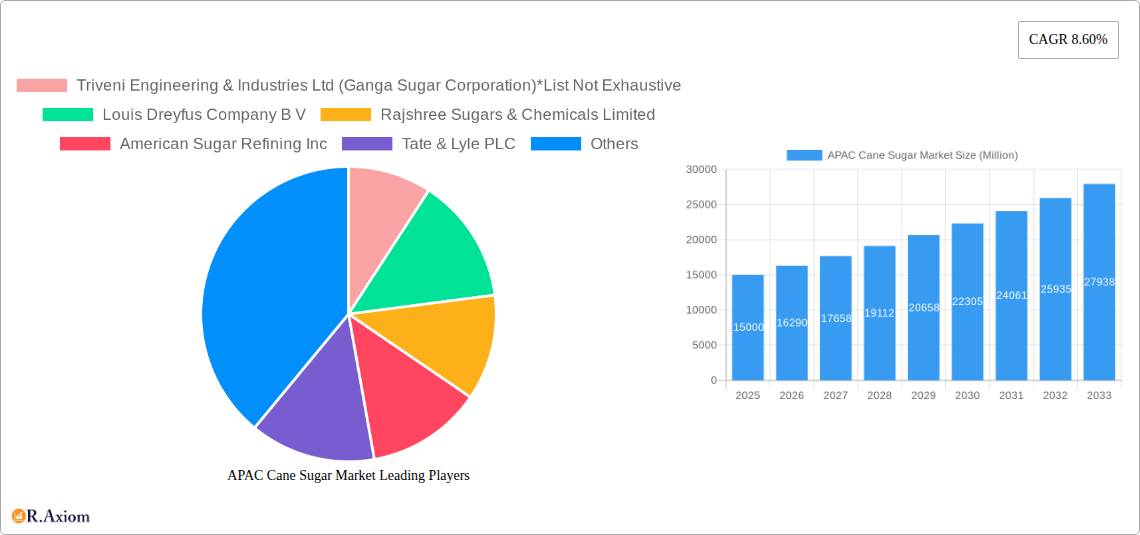
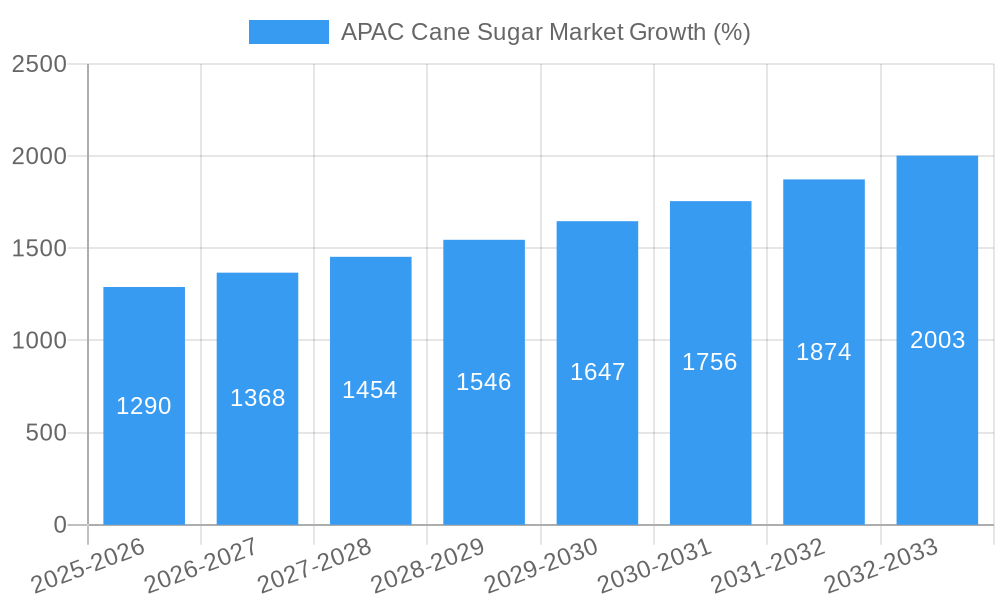
The Asia-Pacific (APAC) cane sugar market is experiencing robust growth, driven by rising populations, increasing disposable incomes, and a surge in demand from the food and beverage industry. The region's diverse culinary traditions and preference for sweet treats fuel significant consumption of cane sugar across various applications, including bakery and confectionery, dairy products, and beverages. India, China, and Southeast Asian nations are key contributors to this growth, with burgeoning middle classes increasingly adopting Westernized diets that incorporate higher levels of sugar. However, fluctuating raw material prices, government regulations on sugar production and consumption, and growing health consciousness regarding sugar intake pose challenges to market expansion. The increasing popularity of alternative sweeteners and the rising focus on healthier lifestyles represent significant restraints, pushing manufacturers to innovate and offer sugar alternatives or promote reduced sugar options. Despite these constraints, the overall market outlook remains positive, with a projected CAGR of 8.60% (consistent with the global figure) suggesting continued growth throughout the forecast period. The market segmentation within APAC will likely see a strong performance in crystallized sugar forms due to its wide usage in various applications. The growth in the Bakery and Confectionery segment will be significantly higher compared to other segments.
The strategic expansion of major players, such as Wilmar Sugar Australia Holdings Pty Ltd and Rajshree Sugars & Chemicals Limited, in the APAC region through increased production capacity and targeted marketing campaigns will shape the competitive landscape. Furthermore, the market will likely witness a considerable increase in the organic cane sugar segment, driven by a growing consumer preference for natural and healthier products. This shift will necessitate investments in sustainable farming practices and certification processes, influencing both production methods and pricing strategies. The market will also witness further consolidation through mergers and acquisitions, especially amongst smaller players, leading to greater efficiency and market share concentration. The growth of e-commerce and online retail channels will also impact distribution networks, offering new avenues for market penetration and increased consumer access.
This in-depth report provides a comprehensive analysis of the Asia-Pacific (APAC) cane sugar market, covering the period from 2019 to 2033. It offers valuable insights into market dynamics, competitive landscape, and future growth prospects, enabling stakeholders to make informed strategic decisions. The report leverages rigorous research methodology and incorporates real-world data to present actionable intelligence for businesses operating within or intending to enter the APAC cane sugar market. The study period spans 2019–2033, with 2025 as the base and estimated year. The forecast period is 2025–2033 and the historical period is 2019–2024.
APAC Cane Sugar Market Market Concentration & Innovation
This section analyzes the level of market concentration within the APAC cane sugar industry. We examine the market share held by key players such as Triveni Engineering & Industries Ltd (Ganga Sugar Corporation), Louis Dreyfus Company B V, Rajshree Sugars & Chemicals Limited, American Sugar Refining Inc, Tate & Lyle PLC, Wilmar Sugar Australia Holdings Pty Ltd, DCM Shriram Consolidated Limited, Global Organics Ltd, Rana Sugars Limited, and Nanning Sugar Industry Co Ltd. The analysis incorporates an assessment of innovation drivers, including technological advancements in sugar refining and production, as well as the influence of regulatory frameworks and the presence of substitute products. Furthermore, we delve into the dynamics of end-user trends, including shifts in consumer preferences towards organic sugar and changing consumption patterns across various applications. The report also covers mergers and acquisitions (M&A) activity, analyzing deal values and their impact on market consolidation. We provide a detailed review of the competitive dynamics and the influence of various factors shaping the industry structure. Specific metrics like market share percentages for major players and the aggregate value of M&A deals are quantified wherever possible. The analysis also examines the impact of government policies, trade agreements, and other regulatory changes on market concentration.
- Market Concentration: The APAC cane sugar market exhibits a [xx]% concentration ratio (CRx), indicating a [highly concentrated/moderately concentrated/fragmented] market structure.
- Innovation Drivers: Key innovation drivers include advancements in sugarcane varieties, improved refining technologies, and the development of sustainable sugar production methods.
- M&A Activity: The report analyzes significant M&A deals over the historical period, considering deal values and their implications for market share and competitive dynamics. For example, the xx Million USD deal between [Company A] and [Company B] resulted in a xx% increase in market share for the combined entity.
APAC Cane Sugar Market Industry Trends & Insights
This section offers a detailed exploration of the prevailing trends and insights within the APAC cane sugar market. We analyze the factors driving market growth, including increasing consumption of sugar in food and beverages, rising population, and expanding economies across the region. The report also assesses the impact of technological disruptions, such as automation in sugar production and supply chain optimization. A deep dive into consumer preferences is conducted, exploring the rising demand for organic sugar, the preference for specific sugar forms (crystallized vs. liquid), and regional variations in taste and consumption patterns. Furthermore, we analyze the competitive dynamics, including pricing strategies, product differentiation, and brand positioning employed by various players in the market. We quantify these dynamics using metrics such as the Compound Annual Growth Rate (CAGR) for the market and its various segments, along with penetration rates for specific sugar categories.
Dominant Markets & Segments in APAP Cane Sugar Market
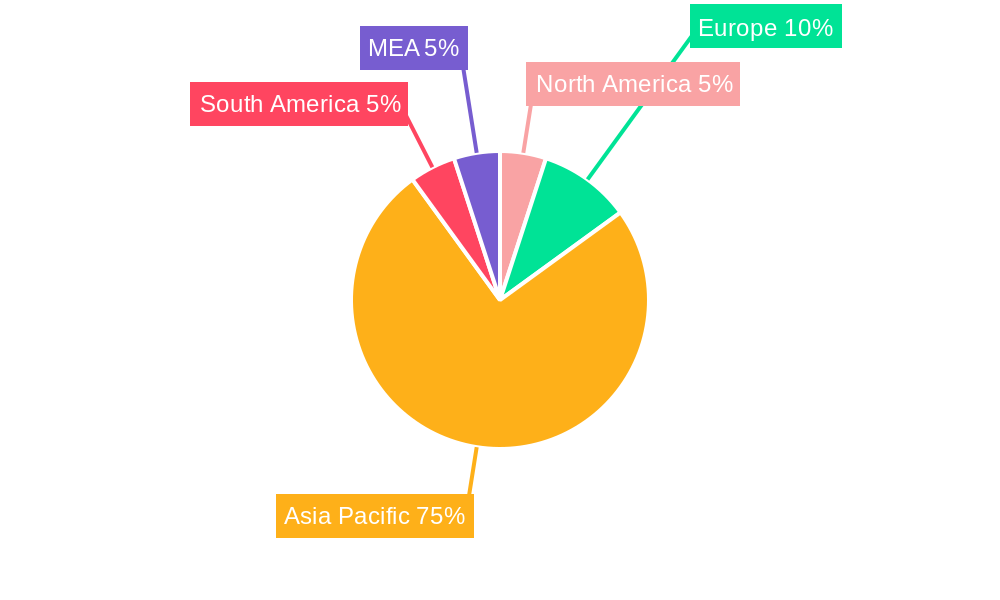
This section identifies the dominant regions, countries, and segments within the APAC cane sugar market. We analyze the key drivers of dominance for each, including economic policies, infrastructure development, and consumer behavior. The report segments the market by Category (Organic, Conventional), Form (Crystallized Sugar, Liquid Syrup), and Application (Bakery and Confectionery, Dairy, Beverages, Other Applications).
- Leading Region: [Region Name], driven by [Specific reasons, e.g., high population density, strong economic growth].
- Leading Country: [Country Name], due to [Specific reasons, e.g., favorable climatic conditions, robust agricultural infrastructure].
- Leading Category: [Category Name], fueled by [Specific reasons, e.g., health consciousness, premium pricing].
- Leading Form: [Form Name], owing to [Specific reasons, e.g., ease of use, versatility in applications].
- Leading Application: [Application Name], because of [Specific reasons, e.g., strong demand from the food processing industry].
Detailed dominance analysis is provided for each segment, including market size, growth rate, and key competitive players.
APAC Cane Sugar Market Product Developments
This section examines recent product innovations, applications, and competitive advantages in the APAP cane sugar market. The focus is on technological trends driving product diversification and market fit, such as the development of novel sugar formulations with enhanced functionalities and the improvement of processing techniques to enhance yield and efficiency. The evolution of functional sugars with added health benefits or improved processing qualities and the emergence of new packaging formats are also analyzed for their impact on market competition.
Report Scope & Segmentation Analysis
This report segments the APAC cane sugar market by Category (Organic, Conventional), Form (Crystallized Sugar, Liquid Syrup), and Application (Bakery and Confectionery, Dairy, Beverages, Other Applications). Each segment is analyzed in detail, including growth projections, market sizes, and competitive dynamics. Specific market sizes and growth rates (in Million) are provided for each segment for the forecast period.
- Organic Cane Sugar: Market size [xx Million] in 2025, projected to reach [xx Million] by 2033 with a CAGR of [xx%].
- Conventional Cane Sugar: Market size [xx Million] in 2025, projected to reach [xx Million] by 2033 with a CAGR of [xx%].
- Crystallized Sugar: Market size [xx Million] in 2025, projected to reach [xx Million] by 2033 with a CAGR of [xx%].
- Liquid Syrup: Market size [xx Million] in 2025, projected to reach [xx Million] by 2033 with a CAGR of [xx%].
- Bakery and Confectionery: Market size [xx Million] in 2025, projected to reach [xx Million] by 2033 with a CAGR of [xx%].
- Dairy: Market size [xx Million] in 2025, projected to reach [xx Million] by 2033 with a CAGR of [xx%].
- Beverages: Market size [xx Million] in 2025, projected to reach [xx Million] by 2033 with a CAGR of [xx%].
- Other Applications: Market size [xx Million] in 2025, projected to reach [xx Million] by 2033 with a CAGR of [xx%].
Key Drivers of APAC Cane Sugar Market Growth
The APAC cane sugar market is experiencing robust growth driven by several factors: the expanding population and rising disposable incomes, particularly in emerging economies; increasing demand for sweetened food and beverages; and ongoing advancements in sugarcane cultivation and sugar refining technologies. Government initiatives and supportive policies also contribute to market expansion.
Challenges in the APAC Cane Sugar Market Sector
The APAC cane sugar market faces challenges including fluctuations in sugarcane production due to weather patterns, price volatility driven by global supply and demand dynamics, increasing costs of production, and the rising competition from alternative sweeteners like high-fructose corn syrup. Regulatory hurdles and supply chain inefficiencies pose additional barriers to market growth.
Emerging Opportunities in APAC Cane Sugar Market
Significant opportunities exist in the APAC cane sugar market, including the increasing demand for organic and sustainably sourced sugar, the growing popularity of functional sugars with added health benefits, and the expansion of the food and beverage industry in developing economies. Innovation in sugar processing and packaging also presents promising avenues for growth.
Leading Players in the APAC Cane Sugar Market Market
- Triveni Engineering & Industries Ltd (Ganga Sugar Corporation)
- Louis Dreyfus Company B V
- Rajshree Sugars & Chemicals Limited
- American Sugar Refining Inc
- Tate & Lyle PLC
- Wilmar Sugar Australia Holdings Pty Ltd
- DCM Shriram Consolidated Limited
- Global Organics Ltd
- Rana Sugars Limited
- Nanning Sugar Industry Co Ltd
Key Developments in APAC Cane Sugar Market Industry
- November 2021: The Sugar Research Institute of Fiji released a new cane variety for commercial planting, boosting yields and grower income.
- November 2021: DCM Shriram Ltd invested over USD 4.22 Million to expand sugar mill capacity, enhancing refined sugar production.
- December 2021: MSM Malaysia Holdings Bhd and Wilmar Sugar Pty Ltd collaborated to build a sustainable sugar supply chain, focusing on traceability and sustainability performance.
Strategic Outlook for APAC Cane Sugar Market Market
The APAC cane sugar market is poised for continued growth, driven by factors such as increasing demand, technological advancements, and supportive government policies. Focusing on sustainability, product innovation, and efficient supply chain management will be crucial for success in this dynamic market. The market is expected to see significant expansion, particularly in segments catering to health-conscious consumers and those seeking premium, value-added products.
APAC Cane Sugar Market Segmentation
-
1. Category
- 1.1. Organic
- 1.2. Conventional
-
2. Form
- 2.1. Crystallized Sugar
- 2.2. Liquid Syrup
-
3. Application
- 3.1. Bakery and Confectionery
- 3.2. Dairy
- 3.3. Beverages
- 3.4. Other Applications
-
4. Geography
- 4.1. China
- 4.2. Japan
- 4.3. India
- 4.4. Australia
- 4.5. Rest of Asia-Pacific
APAC Cane Sugar Market Segmentation By Geography
- 1. China
- 2. Japan
- 3. India
- 4. Australia
- 5. Rest of Asia Pacific
APAC Cane Sugar Market REPORT HIGHLIGHTS
| Aspects | Details |
|---|---|
| Study Period | 2019-2033 |
| Base Year | 2024 |
| Estimated Year | 2025 |
| Forecast Period | 2025-2033 |
| Historical Period | 2019-2024 |
| Growth Rate | CAGR of 8.60% from 2019-2033 |
| Segmentation |
|
Table of Contents
- 1. Introduction
- 1.1. Research Scope
- 1.2. Market Segmentation
- 1.3. Research Methodology
- 1.4. Definitions and Assumptions
- 2. Executive Summary
- 2.1. Introduction
- 3. Market Dynamics
- 3.1. Introduction
- 3.2. Market Drivers
- 3.2.1. Growing Awareness About Insect & Other Alternative Proteins; Increasing Applications Surge Demand for Insect Protein
- 3.3. Market Restrains
- 3.3.1. Augmenting Market Penetration of Other Proteins
- 3.4. Market Trends
- 3.4.1. Increased Trade of Organic Cane Sugar
- 4. Market Factor Analysis
- 4.1. Porters Five Forces
- 4.2. Supply/Value Chain
- 4.3. PESTEL analysis
- 4.4. Market Entropy
- 4.5. Patent/Trademark Analysis
- 5. Global APAC Cane Sugar Market Analysis, Insights and Forecast, 2019-2031
- 5.1. Market Analysis, Insights and Forecast - by Category
- 5.1.1. Organic
- 5.1.2. Conventional
- 5.2. Market Analysis, Insights and Forecast - by Form
- 5.2.1. Crystallized Sugar
- 5.2.2. Liquid Syrup
- 5.3. Market Analysis, Insights and Forecast - by Application
- 5.3.1. Bakery and Confectionery
- 5.3.2. Dairy
- 5.3.3. Beverages
- 5.3.4. Other Applications
- 5.4. Market Analysis, Insights and Forecast - by Geography
- 5.4.1. China
- 5.4.2. Japan
- 5.4.3. India
- 5.4.4. Australia
- 5.4.5. Rest of Asia-Pacific
- 5.5. Market Analysis, Insights and Forecast - by Region
- 5.5.1. China
- 5.5.2. Japan
- 5.5.3. India
- 5.5.4. Australia
- 5.5.5. Rest of Asia Pacific
- 5.1. Market Analysis, Insights and Forecast - by Category
- 6. China APAC Cane Sugar Market Analysis, Insights and Forecast, 2019-2031
- 6.1. Market Analysis, Insights and Forecast - by Category
- 6.1.1. Organic
- 6.1.2. Conventional
- 6.2. Market Analysis, Insights and Forecast - by Form
- 6.2.1. Crystallized Sugar
- 6.2.2. Liquid Syrup
- 6.3. Market Analysis, Insights and Forecast - by Application
- 6.3.1. Bakery and Confectionery
- 6.3.2. Dairy
- 6.3.3. Beverages
- 6.3.4. Other Applications
- 6.4. Market Analysis, Insights and Forecast - by Geography
- 6.4.1. China
- 6.4.2. Japan
- 6.4.3. India
- 6.4.4. Australia
- 6.4.5. Rest of Asia-Pacific
- 6.1. Market Analysis, Insights and Forecast - by Category
- 7. Japan APAC Cane Sugar Market Analysis, Insights and Forecast, 2019-2031
- 7.1. Market Analysis, Insights and Forecast - by Category
- 7.1.1. Organic
- 7.1.2. Conventional
- 7.2. Market Analysis, Insights and Forecast - by Form
- 7.2.1. Crystallized Sugar
- 7.2.2. Liquid Syrup
- 7.3. Market Analysis, Insights and Forecast - by Application
- 7.3.1. Bakery and Confectionery
- 7.3.2. Dairy
- 7.3.3. Beverages
- 7.3.4. Other Applications
- 7.4. Market Analysis, Insights and Forecast - by Geography
- 7.4.1. China
- 7.4.2. Japan
- 7.4.3. India
- 7.4.4. Australia
- 7.4.5. Rest of Asia-Pacific
- 7.1. Market Analysis, Insights and Forecast - by Category
- 8. India APAC Cane Sugar Market Analysis, Insights and Forecast, 2019-2031
- 8.1. Market Analysis, Insights and Forecast - by Category
- 8.1.1. Organic
- 8.1.2. Conventional
- 8.2. Market Analysis, Insights and Forecast - by Form
- 8.2.1. Crystallized Sugar
- 8.2.2. Liquid Syrup
- 8.3. Market Analysis, Insights and Forecast - by Application
- 8.3.1. Bakery and Confectionery
- 8.3.2. Dairy
- 8.3.3. Beverages
- 8.3.4. Other Applications
- 8.4. Market Analysis, Insights and Forecast - by Geography
- 8.4.1. China
- 8.4.2. Japan
- 8.4.3. India
- 8.4.4. Australia
- 8.4.5. Rest of Asia-Pacific
- 8.1. Market Analysis, Insights and Forecast - by Category
- 9. Australia APAC Cane Sugar Market Analysis, Insights and Forecast, 2019-2031
- 9.1. Market Analysis, Insights and Forecast - by Category
- 9.1.1. Organic
- 9.1.2. Conventional
- 9.2. Market Analysis, Insights and Forecast - by Form
- 9.2.1. Crystallized Sugar
- 9.2.2. Liquid Syrup
- 9.3. Market Analysis, Insights and Forecast - by Application
- 9.3.1. Bakery and Confectionery
- 9.3.2. Dairy
- 9.3.3. Beverages
- 9.3.4. Other Applications
- 9.4. Market Analysis, Insights and Forecast - by Geography
- 9.4.1. China
- 9.4.2. Japan
- 9.4.3. India
- 9.4.4. Australia
- 9.4.5. Rest of Asia-Pacific
- 9.1. Market Analysis, Insights and Forecast - by Category
- 10. Rest of Asia Pacific APAC Cane Sugar Market Analysis, Insights and Forecast, 2019-2031
- 10.1. Market Analysis, Insights and Forecast - by Category
- 10.1.1. Organic
- 10.1.2. Conventional
- 10.2. Market Analysis, Insights and Forecast - by Form
- 10.2.1. Crystallized Sugar
- 10.2.2. Liquid Syrup
- 10.3. Market Analysis, Insights and Forecast - by Application
- 10.3.1. Bakery and Confectionery
- 10.3.2. Dairy
- 10.3.3. Beverages
- 10.3.4. Other Applications
- 10.4. Market Analysis, Insights and Forecast - by Geography
- 10.4.1. China
- 10.4.2. Japan
- 10.4.3. India
- 10.4.4. Australia
- 10.4.5. Rest of Asia-Pacific
- 10.1. Market Analysis, Insights and Forecast - by Category
- 11. North America APAC Cane Sugar Market Analysis, Insights and Forecast, 2019-2031
- 11.1. Market Analysis, Insights and Forecast - By Country/Sub-region
- 11.1.1 United States
- 11.1.2 Canada
- 11.1.3 Mexico
- 12. Europe APAC Cane Sugar Market Analysis, Insights and Forecast, 2019-2031
- 12.1. Market Analysis, Insights and Forecast - By Country/Sub-region
- 12.1.1 Germany
- 12.1.2 United Kingdom
- 12.1.3 France
- 12.1.4 Spain
- 12.1.5 Italy
- 12.1.6 Spain
- 12.1.7 Belgium
- 12.1.8 Netherland
- 12.1.9 Nordics
- 12.1.10 Rest of Europe
- 13. Asia Pacific APAC Cane Sugar Market Analysis, Insights and Forecast, 2019-2031
- 13.1. Market Analysis, Insights and Forecast - By Country/Sub-region
- 13.1.1 China
- 13.1.2 Japan
- 13.1.3 India
- 13.1.4 South Korea
- 13.1.5 Southeast Asia
- 13.1.6 Australia
- 13.1.7 Indonesia
- 13.1.8 Phillipes
- 13.1.9 Singapore
- 13.1.10 Thailandc
- 13.1.11 Rest of Asia Pacific
- 14. South America APAC Cane Sugar Market Analysis, Insights and Forecast, 2019-2031
- 14.1. Market Analysis, Insights and Forecast - By Country/Sub-region
- 14.1.1 Brazil
- 14.1.2 Argentina
- 14.1.3 Peru
- 14.1.4 Chile
- 14.1.5 Colombia
- 14.1.6 Ecuador
- 14.1.7 Venezuela
- 14.1.8 Rest of South America
- 15. MEA APAC Cane Sugar Market Analysis, Insights and Forecast, 2019-2031
- 15.1. Market Analysis, Insights and Forecast - By Country/Sub-region
- 15.1.1 United Arab Emirates
- 15.1.2 Saudi Arabia
- 15.1.3 South Africa
- 15.1.4 Rest of Middle East and Africa
- 16. Competitive Analysis
- 16.1. Global Market Share Analysis 2024
- 16.2. Company Profiles
- 16.2.1 Triveni Engineering & Industries Ltd (Ganga Sugar Corporation)*List Not Exhaustive
- 16.2.1.1. Overview
- 16.2.1.2. Products
- 16.2.1.3. SWOT Analysis
- 16.2.1.4. Recent Developments
- 16.2.1.5. Financials (Based on Availability)
- 16.2.2 Louis Dreyfus Company B V
- 16.2.2.1. Overview
- 16.2.2.2. Products
- 16.2.2.3. SWOT Analysis
- 16.2.2.4. Recent Developments
- 16.2.2.5. Financials (Based on Availability)
- 16.2.3 Rajshree Sugars & Chemicals Limited
- 16.2.3.1. Overview
- 16.2.3.2. Products
- 16.2.3.3. SWOT Analysis
- 16.2.3.4. Recent Developments
- 16.2.3.5. Financials (Based on Availability)
- 16.2.4 American Sugar Refining Inc
- 16.2.4.1. Overview
- 16.2.4.2. Products
- 16.2.4.3. SWOT Analysis
- 16.2.4.4. Recent Developments
- 16.2.4.5. Financials (Based on Availability)
- 16.2.5 Tate & Lyle PLC
- 16.2.5.1. Overview
- 16.2.5.2. Products
- 16.2.5.3. SWOT Analysis
- 16.2.5.4. Recent Developments
- 16.2.5.5. Financials (Based on Availability)
- 16.2.6 Wilmar Sugar Australia Holdings Pty Ltd
- 16.2.6.1. Overview
- 16.2.6.2. Products
- 16.2.6.3. SWOT Analysis
- 16.2.6.4. Recent Developments
- 16.2.6.5. Financials (Based on Availability)
- 16.2.7 DCM Shriram Consolidated Limited
- 16.2.7.1. Overview
- 16.2.7.2. Products
- 16.2.7.3. SWOT Analysis
- 16.2.7.4. Recent Developments
- 16.2.7.5. Financials (Based on Availability)
- 16.2.8 Global Organics Ltd
- 16.2.8.1. Overview
- 16.2.8.2. Products
- 16.2.8.3. SWOT Analysis
- 16.2.8.4. Recent Developments
- 16.2.8.5. Financials (Based on Availability)
- 16.2.9 Rana Sugars Limited
- 16.2.9.1. Overview
- 16.2.9.2. Products
- 16.2.9.3. SWOT Analysis
- 16.2.9.4. Recent Developments
- 16.2.9.5. Financials (Based on Availability)
- 16.2.10 Nanning Sugar Industry Co Ltd
- 16.2.10.1. Overview
- 16.2.10.2. Products
- 16.2.10.3. SWOT Analysis
- 16.2.10.4. Recent Developments
- 16.2.10.5. Financials (Based on Availability)
- 16.2.1 Triveni Engineering & Industries Ltd (Ganga Sugar Corporation)*List Not Exhaustive
List of Figures
- Figure 1: Global APAC Cane Sugar Market Revenue Breakdown (Million, %) by Region 2024 & 2032
- Figure 2: Global APAC Cane Sugar Market Volume Breakdown (k tons, %) by Region 2024 & 2032
- Figure 3: North America APAC Cane Sugar Market Revenue (Million), by Country 2024 & 2032
- Figure 4: North America APAC Cane Sugar Market Volume (k tons), by Country 2024 & 2032
- Figure 5: North America APAC Cane Sugar Market Revenue Share (%), by Country 2024 & 2032
- Figure 6: North America APAC Cane Sugar Market Volume Share (%), by Country 2024 & 2032
- Figure 7: Europe APAC Cane Sugar Market Revenue (Million), by Country 2024 & 2032
- Figure 8: Europe APAC Cane Sugar Market Volume (k tons), by Country 2024 & 2032
- Figure 9: Europe APAC Cane Sugar Market Revenue Share (%), by Country 2024 & 2032
- Figure 10: Europe APAC Cane Sugar Market Volume Share (%), by Country 2024 & 2032
- Figure 11: Asia Pacific APAC Cane Sugar Market Revenue (Million), by Country 2024 & 2032
- Figure 12: Asia Pacific APAC Cane Sugar Market Volume (k tons), by Country 2024 & 2032
- Figure 13: Asia Pacific APAC Cane Sugar Market Revenue Share (%), by Country 2024 & 2032
- Figure 14: Asia Pacific APAC Cane Sugar Market Volume Share (%), by Country 2024 & 2032
- Figure 15: South America APAC Cane Sugar Market Revenue (Million), by Country 2024 & 2032
- Figure 16: South America APAC Cane Sugar Market Volume (k tons), by Country 2024 & 2032
- Figure 17: South America APAC Cane Sugar Market Revenue Share (%), by Country 2024 & 2032
- Figure 18: South America APAC Cane Sugar Market Volume Share (%), by Country 2024 & 2032
- Figure 19: MEA APAC Cane Sugar Market Revenue (Million), by Country 2024 & 2032
- Figure 20: MEA APAC Cane Sugar Market Volume (k tons), by Country 2024 & 2032
- Figure 21: MEA APAC Cane Sugar Market Revenue Share (%), by Country 2024 & 2032
- Figure 22: MEA APAC Cane Sugar Market Volume Share (%), by Country 2024 & 2032
- Figure 23: China APAC Cane Sugar Market Revenue (Million), by Category 2024 & 2032
- Figure 24: China APAC Cane Sugar Market Volume (k tons), by Category 2024 & 2032
- Figure 25: China APAC Cane Sugar Market Revenue Share (%), by Category 2024 & 2032
- Figure 26: China APAC Cane Sugar Market Volume Share (%), by Category 2024 & 2032
- Figure 27: China APAC Cane Sugar Market Revenue (Million), by Form 2024 & 2032
- Figure 28: China APAC Cane Sugar Market Volume (k tons), by Form 2024 & 2032
- Figure 29: China APAC Cane Sugar Market Revenue Share (%), by Form 2024 & 2032
- Figure 30: China APAC Cane Sugar Market Volume Share (%), by Form 2024 & 2032
- Figure 31: China APAC Cane Sugar Market Revenue (Million), by Application 2024 & 2032
- Figure 32: China APAC Cane Sugar Market Volume (k tons), by Application 2024 & 2032
- Figure 33: China APAC Cane Sugar Market Revenue Share (%), by Application 2024 & 2032
- Figure 34: China APAC Cane Sugar Market Volume Share (%), by Application 2024 & 2032
- Figure 35: China APAC Cane Sugar Market Revenue (Million), by Geography 2024 & 2032
- Figure 36: China APAC Cane Sugar Market Volume (k tons), by Geography 2024 & 2032
- Figure 37: China APAC Cane Sugar Market Revenue Share (%), by Geography 2024 & 2032
- Figure 38: China APAC Cane Sugar Market Volume Share (%), by Geography 2024 & 2032
- Figure 39: China APAC Cane Sugar Market Revenue (Million), by Country 2024 & 2032
- Figure 40: China APAC Cane Sugar Market Volume (k tons), by Country 2024 & 2032
- Figure 41: China APAC Cane Sugar Market Revenue Share (%), by Country 2024 & 2032
- Figure 42: China APAC Cane Sugar Market Volume Share (%), by Country 2024 & 2032
- Figure 43: Japan APAC Cane Sugar Market Revenue (Million), by Category 2024 & 2032
- Figure 44: Japan APAC Cane Sugar Market Volume (k tons), by Category 2024 & 2032
- Figure 45: Japan APAC Cane Sugar Market Revenue Share (%), by Category 2024 & 2032
- Figure 46: Japan APAC Cane Sugar Market Volume Share (%), by Category 2024 & 2032
- Figure 47: Japan APAC Cane Sugar Market Revenue (Million), by Form 2024 & 2032
- Figure 48: Japan APAC Cane Sugar Market Volume (k tons), by Form 2024 & 2032
- Figure 49: Japan APAC Cane Sugar Market Revenue Share (%), by Form 2024 & 2032
- Figure 50: Japan APAC Cane Sugar Market Volume Share (%), by Form 2024 & 2032
- Figure 51: Japan APAC Cane Sugar Market Revenue (Million), by Application 2024 & 2032
- Figure 52: Japan APAC Cane Sugar Market Volume (k tons), by Application 2024 & 2032
- Figure 53: Japan APAC Cane Sugar Market Revenue Share (%), by Application 2024 & 2032
- Figure 54: Japan APAC Cane Sugar Market Volume Share (%), by Application 2024 & 2032
- Figure 55: Japan APAC Cane Sugar Market Revenue (Million), by Geography 2024 & 2032
- Figure 56: Japan APAC Cane Sugar Market Volume (k tons), by Geography 2024 & 2032
- Figure 57: Japan APAC Cane Sugar Market Revenue Share (%), by Geography 2024 & 2032
- Figure 58: Japan APAC Cane Sugar Market Volume Share (%), by Geography 2024 & 2032
- Figure 59: Japan APAC Cane Sugar Market Revenue (Million), by Country 2024 & 2032
- Figure 60: Japan APAC Cane Sugar Market Volume (k tons), by Country 2024 & 2032
- Figure 61: Japan APAC Cane Sugar Market Revenue Share (%), by Country 2024 & 2032
- Figure 62: Japan APAC Cane Sugar Market Volume Share (%), by Country 2024 & 2032
- Figure 63: India APAC Cane Sugar Market Revenue (Million), by Category 2024 & 2032
- Figure 64: India APAC Cane Sugar Market Volume (k tons), by Category 2024 & 2032
- Figure 65: India APAC Cane Sugar Market Revenue Share (%), by Category 2024 & 2032
- Figure 66: India APAC Cane Sugar Market Volume Share (%), by Category 2024 & 2032
- Figure 67: India APAC Cane Sugar Market Revenue (Million), by Form 2024 & 2032
- Figure 68: India APAC Cane Sugar Market Volume (k tons), by Form 2024 & 2032
- Figure 69: India APAC Cane Sugar Market Revenue Share (%), by Form 2024 & 2032
- Figure 70: India APAC Cane Sugar Market Volume Share (%), by Form 2024 & 2032
- Figure 71: India APAC Cane Sugar Market Revenue (Million), by Application 2024 & 2032
- Figure 72: India APAC Cane Sugar Market Volume (k tons), by Application 2024 & 2032
- Figure 73: India APAC Cane Sugar Market Revenue Share (%), by Application 2024 & 2032
- Figure 74: India APAC Cane Sugar Market Volume Share (%), by Application 2024 & 2032
- Figure 75: India APAC Cane Sugar Market Revenue (Million), by Geography 2024 & 2032
- Figure 76: India APAC Cane Sugar Market Volume (k tons), by Geography 2024 & 2032
- Figure 77: India APAC Cane Sugar Market Revenue Share (%), by Geography 2024 & 2032
- Figure 78: India APAC Cane Sugar Market Volume Share (%), by Geography 2024 & 2032
- Figure 79: India APAC Cane Sugar Market Revenue (Million), by Country 2024 & 2032
- Figure 80: India APAC Cane Sugar Market Volume (k tons), by Country 2024 & 2032
- Figure 81: India APAC Cane Sugar Market Revenue Share (%), by Country 2024 & 2032
- Figure 82: India APAC Cane Sugar Market Volume Share (%), by Country 2024 & 2032
- Figure 83: Australia APAC Cane Sugar Market Revenue (Million), by Category 2024 & 2032
- Figure 84: Australia APAC Cane Sugar Market Volume (k tons), by Category 2024 & 2032
- Figure 85: Australia APAC Cane Sugar Market Revenue Share (%), by Category 2024 & 2032
- Figure 86: Australia APAC Cane Sugar Market Volume Share (%), by Category 2024 & 2032
- Figure 87: Australia APAC Cane Sugar Market Revenue (Million), by Form 2024 & 2032
- Figure 88: Australia APAC Cane Sugar Market Volume (k tons), by Form 2024 & 2032
- Figure 89: Australia APAC Cane Sugar Market Revenue Share (%), by Form 2024 & 2032
- Figure 90: Australia APAC Cane Sugar Market Volume Share (%), by Form 2024 & 2032
- Figure 91: Australia APAC Cane Sugar Market Revenue (Million), by Application 2024 & 2032
- Figure 92: Australia APAC Cane Sugar Market Volume (k tons), by Application 2024 & 2032
- Figure 93: Australia APAC Cane Sugar Market Revenue Share (%), by Application 2024 & 2032
- Figure 94: Australia APAC Cane Sugar Market Volume Share (%), by Application 2024 & 2032
- Figure 95: Australia APAC Cane Sugar Market Revenue (Million), by Geography 2024 & 2032
- Figure 96: Australia APAC Cane Sugar Market Volume (k tons), by Geography 2024 & 2032
- Figure 97: Australia APAC Cane Sugar Market Revenue Share (%), by Geography 2024 & 2032
- Figure 98: Australia APAC Cane Sugar Market Volume Share (%), by Geography 2024 & 2032
- Figure 99: Australia APAC Cane Sugar Market Revenue (Million), by Country 2024 & 2032
- Figure 100: Australia APAC Cane Sugar Market Volume (k tons), by Country 2024 & 2032
- Figure 101: Australia APAC Cane Sugar Market Revenue Share (%), by Country 2024 & 2032
- Figure 102: Australia APAC Cane Sugar Market Volume Share (%), by Country 2024 & 2032
- Figure 103: Rest of Asia Pacific APAC Cane Sugar Market Revenue (Million), by Category 2024 & 2032
- Figure 104: Rest of Asia Pacific APAC Cane Sugar Market Volume (k tons), by Category 2024 & 2032
- Figure 105: Rest of Asia Pacific APAC Cane Sugar Market Revenue Share (%), by Category 2024 & 2032
- Figure 106: Rest of Asia Pacific APAC Cane Sugar Market Volume Share (%), by Category 2024 & 2032
- Figure 107: Rest of Asia Pacific APAC Cane Sugar Market Revenue (Million), by Form 2024 & 2032
- Figure 108: Rest of Asia Pacific APAC Cane Sugar Market Volume (k tons), by Form 2024 & 2032
- Figure 109: Rest of Asia Pacific APAC Cane Sugar Market Revenue Share (%), by Form 2024 & 2032
- Figure 110: Rest of Asia Pacific APAC Cane Sugar Market Volume Share (%), by Form 2024 & 2032
- Figure 111: Rest of Asia Pacific APAC Cane Sugar Market Revenue (Million), by Application 2024 & 2032
- Figure 112: Rest of Asia Pacific APAC Cane Sugar Market Volume (k tons), by Application 2024 & 2032
- Figure 113: Rest of Asia Pacific APAC Cane Sugar Market Revenue Share (%), by Application 2024 & 2032
- Figure 114: Rest of Asia Pacific APAC Cane Sugar Market Volume Share (%), by Application 2024 & 2032
- Figure 115: Rest of Asia Pacific APAC Cane Sugar Market Revenue (Million), by Geography 2024 & 2032
- Figure 116: Rest of Asia Pacific APAC Cane Sugar Market Volume (k tons), by Geography 2024 & 2032
- Figure 117: Rest of Asia Pacific APAC Cane Sugar Market Revenue Share (%), by Geography 2024 & 2032
- Figure 118: Rest of Asia Pacific APAC Cane Sugar Market Volume Share (%), by Geography 2024 & 2032
- Figure 119: Rest of Asia Pacific APAC Cane Sugar Market Revenue (Million), by Country 2024 & 2032
- Figure 120: Rest of Asia Pacific APAC Cane Sugar Market Volume (k tons), by Country 2024 & 2032
- Figure 121: Rest of Asia Pacific APAC Cane Sugar Market Revenue Share (%), by Country 2024 & 2032
- Figure 122: Rest of Asia Pacific APAC Cane Sugar Market Volume Share (%), by Country 2024 & 2032
List of Tables
- Table 1: Global APAC Cane Sugar Market Revenue Million Forecast, by Region 2019 & 2032
- Table 2: Global APAC Cane Sugar Market Volume k tons Forecast, by Region 2019 & 2032
- Table 3: Global APAC Cane Sugar Market Revenue Million Forecast, by Category 2019 & 2032
- Table 4: Global APAC Cane Sugar Market Volume k tons Forecast, by Category 2019 & 2032
- Table 5: Global APAC Cane Sugar Market Revenue Million Forecast, by Form 2019 & 2032
- Table 6: Global APAC Cane Sugar Market Volume k tons Forecast, by Form 2019 & 2032
- Table 7: Global APAC Cane Sugar Market Revenue Million Forecast, by Application 2019 & 2032
- Table 8: Global APAC Cane Sugar Market Volume k tons Forecast, by Application 2019 & 2032
- Table 9: Global APAC Cane Sugar Market Revenue Million Forecast, by Geography 2019 & 2032
- Table 10: Global APAC Cane Sugar Market Volume k tons Forecast, by Geography 2019 & 2032
- Table 11: Global APAC Cane Sugar Market Revenue Million Forecast, by Region 2019 & 2032
- Table 12: Global APAC Cane Sugar Market Volume k tons Forecast, by Region 2019 & 2032
- Table 13: Global APAC Cane Sugar Market Revenue Million Forecast, by Country 2019 & 2032
- Table 14: Global APAC Cane Sugar Market Volume k tons Forecast, by Country 2019 & 2032
- Table 15: United States APAC Cane Sugar Market Revenue (Million) Forecast, by Application 2019 & 2032
- Table 16: United States APAC Cane Sugar Market Volume (k tons) Forecast, by Application 2019 & 2032
- Table 17: Canada APAC Cane Sugar Market Revenue (Million) Forecast, by Application 2019 & 2032
- Table 18: Canada APAC Cane Sugar Market Volume (k tons) Forecast, by Application 2019 & 2032
- Table 19: Mexico APAC Cane Sugar Market Revenue (Million) Forecast, by Application 2019 & 2032
- Table 20: Mexico APAC Cane Sugar Market Volume (k tons) Forecast, by Application 2019 & 2032
- Table 21: Global APAC Cane Sugar Market Revenue Million Forecast, by Country 2019 & 2032
- Table 22: Global APAC Cane Sugar Market Volume k tons Forecast, by Country 2019 & 2032
- Table 23: Germany APAC Cane Sugar Market Revenue (Million) Forecast, by Application 2019 & 2032
- Table 24: Germany APAC Cane Sugar Market Volume (k tons) Forecast, by Application 2019 & 2032
- Table 25: United Kingdom APAC Cane Sugar Market Revenue (Million) Forecast, by Application 2019 & 2032
- Table 26: United Kingdom APAC Cane Sugar Market Volume (k tons) Forecast, by Application 2019 & 2032
- Table 27: France APAC Cane Sugar Market Revenue (Million) Forecast, by Application 2019 & 2032
- Table 28: France APAC Cane Sugar Market Volume (k tons) Forecast, by Application 2019 & 2032
- Table 29: Spain APAC Cane Sugar Market Revenue (Million) Forecast, by Application 2019 & 2032
- Table 30: Spain APAC Cane Sugar Market Volume (k tons) Forecast, by Application 2019 & 2032
- Table 31: Italy APAC Cane Sugar Market Revenue (Million) Forecast, by Application 2019 & 2032
- Table 32: Italy APAC Cane Sugar Market Volume (k tons) Forecast, by Application 2019 & 2032
- Table 33: Spain APAC Cane Sugar Market Revenue (Million) Forecast, by Application 2019 & 2032
- Table 34: Spain APAC Cane Sugar Market Volume (k tons) Forecast, by Application 2019 & 2032
- Table 35: Belgium APAC Cane Sugar Market Revenue (Million) Forecast, by Application 2019 & 2032
- Table 36: Belgium APAC Cane Sugar Market Volume (k tons) Forecast, by Application 2019 & 2032
- Table 37: Netherland APAC Cane Sugar Market Revenue (Million) Forecast, by Application 2019 & 2032
- Table 38: Netherland APAC Cane Sugar Market Volume (k tons) Forecast, by Application 2019 & 2032
- Table 39: Nordics APAC Cane Sugar Market Revenue (Million) Forecast, by Application 2019 & 2032
- Table 40: Nordics APAC Cane Sugar Market Volume (k tons) Forecast, by Application 2019 & 2032
- Table 41: Rest of Europe APAC Cane Sugar Market Revenue (Million) Forecast, by Application 2019 & 2032
- Table 42: Rest of Europe APAC Cane Sugar Market Volume (k tons) Forecast, by Application 2019 & 2032
- Table 43: Global APAC Cane Sugar Market Revenue Million Forecast, by Country 2019 & 2032
- Table 44: Global APAC Cane Sugar Market Volume k tons Forecast, by Country 2019 & 2032
- Table 45: China APAC Cane Sugar Market Revenue (Million) Forecast, by Application 2019 & 2032
- Table 46: China APAC Cane Sugar Market Volume (k tons) Forecast, by Application 2019 & 2032
- Table 47: Japan APAC Cane Sugar Market Revenue (Million) Forecast, by Application 2019 & 2032
- Table 48: Japan APAC Cane Sugar Market Volume (k tons) Forecast, by Application 2019 & 2032
- Table 49: India APAC Cane Sugar Market Revenue (Million) Forecast, by Application 2019 & 2032
- Table 50: India APAC Cane Sugar Market Volume (k tons) Forecast, by Application 2019 & 2032
- Table 51: South Korea APAC Cane Sugar Market Revenue (Million) Forecast, by Application 2019 & 2032
- Table 52: South Korea APAC Cane Sugar Market Volume (k tons) Forecast, by Application 2019 & 2032
- Table 53: Southeast Asia APAC Cane Sugar Market Revenue (Million) Forecast, by Application 2019 & 2032
- Table 54: Southeast Asia APAC Cane Sugar Market Volume (k tons) Forecast, by Application 2019 & 2032
- Table 55: Australia APAC Cane Sugar Market Revenue (Million) Forecast, by Application 2019 & 2032
- Table 56: Australia APAC Cane Sugar Market Volume (k tons) Forecast, by Application 2019 & 2032
- Table 57: Indonesia APAC Cane Sugar Market Revenue (Million) Forecast, by Application 2019 & 2032
- Table 58: Indonesia APAC Cane Sugar Market Volume (k tons) Forecast, by Application 2019 & 2032
- Table 59: Phillipes APAC Cane Sugar Market Revenue (Million) Forecast, by Application 2019 & 2032
- Table 60: Phillipes APAC Cane Sugar Market Volume (k tons) Forecast, by Application 2019 & 2032
- Table 61: Singapore APAC Cane Sugar Market Revenue (Million) Forecast, by Application 2019 & 2032
- Table 62: Singapore APAC Cane Sugar Market Volume (k tons) Forecast, by Application 2019 & 2032
- Table 63: Thailandc APAC Cane Sugar Market Revenue (Million) Forecast, by Application 2019 & 2032
- Table 64: Thailandc APAC Cane Sugar Market Volume (k tons) Forecast, by Application 2019 & 2032
- Table 65: Rest of Asia Pacific APAC Cane Sugar Market Revenue (Million) Forecast, by Application 2019 & 2032
- Table 66: Rest of Asia Pacific APAC Cane Sugar Market Volume (k tons) Forecast, by Application 2019 & 2032
- Table 67: Global APAC Cane Sugar Market Revenue Million Forecast, by Country 2019 & 2032
- Table 68: Global APAC Cane Sugar Market Volume k tons Forecast, by Country 2019 & 2032
- Table 69: Brazil APAC Cane Sugar Market Revenue (Million) Forecast, by Application 2019 & 2032
- Table 70: Brazil APAC Cane Sugar Market Volume (k tons) Forecast, by Application 2019 & 2032
- Table 71: Argentina APAC Cane Sugar Market Revenue (Million) Forecast, by Application 2019 & 2032
- Table 72: Argentina APAC Cane Sugar Market Volume (k tons) Forecast, by Application 2019 & 2032
- Table 73: Peru APAC Cane Sugar Market Revenue (Million) Forecast, by Application 2019 & 2032
- Table 74: Peru APAC Cane Sugar Market Volume (k tons) Forecast, by Application 2019 & 2032
- Table 75: Chile APAC Cane Sugar Market Revenue (Million) Forecast, by Application 2019 & 2032
- Table 76: Chile APAC Cane Sugar Market Volume (k tons) Forecast, by Application 2019 & 2032
- Table 77: Colombia APAC Cane Sugar Market Revenue (Million) Forecast, by Application 2019 & 2032
- Table 78: Colombia APAC Cane Sugar Market Volume (k tons) Forecast, by Application 2019 & 2032
- Table 79: Ecuador APAC Cane Sugar Market Revenue (Million) Forecast, by Application 2019 & 2032
- Table 80: Ecuador APAC Cane Sugar Market Volume (k tons) Forecast, by Application 2019 & 2032
- Table 81: Venezuela APAC Cane Sugar Market Revenue (Million) Forecast, by Application 2019 & 2032
- Table 82: Venezuela APAC Cane Sugar Market Volume (k tons) Forecast, by Application 2019 & 2032
- Table 83: Rest of South America APAC Cane Sugar Market Revenue (Million) Forecast, by Application 2019 & 2032
- Table 84: Rest of South America APAC Cane Sugar Market Volume (k tons) Forecast, by Application 2019 & 2032
- Table 85: Global APAC Cane Sugar Market Revenue Million Forecast, by Country 2019 & 2032
- Table 86: Global APAC Cane Sugar Market Volume k tons Forecast, by Country 2019 & 2032
- Table 87: United Arab Emirates APAC Cane Sugar Market Revenue (Million) Forecast, by Application 2019 & 2032
- Table 88: United Arab Emirates APAC Cane Sugar Market Volume (k tons) Forecast, by Application 2019 & 2032
- Table 89: Saudi Arabia APAC Cane Sugar Market Revenue (Million) Forecast, by Application 2019 & 2032
- Table 90: Saudi Arabia APAC Cane Sugar Market Volume (k tons) Forecast, by Application 2019 & 2032
- Table 91: South Africa APAC Cane Sugar Market Revenue (Million) Forecast, by Application 2019 & 2032
- Table 92: South Africa APAC Cane Sugar Market Volume (k tons) Forecast, by Application 2019 & 2032
- Table 93: Rest of Middle East and Africa APAC Cane Sugar Market Revenue (Million) Forecast, by Application 2019 & 2032
- Table 94: Rest of Middle East and Africa APAC Cane Sugar Market Volume (k tons) Forecast, by Application 2019 & 2032
- Table 95: Global APAC Cane Sugar Market Revenue Million Forecast, by Category 2019 & 2032
- Table 96: Global APAC Cane Sugar Market Volume k tons Forecast, by Category 2019 & 2032
- Table 97: Global APAC Cane Sugar Market Revenue Million Forecast, by Form 2019 & 2032
- Table 98: Global APAC Cane Sugar Market Volume k tons Forecast, by Form 2019 & 2032
- Table 99: Global APAC Cane Sugar Market Revenue Million Forecast, by Application 2019 & 2032
- Table 100: Global APAC Cane Sugar Market Volume k tons Forecast, by Application 2019 & 2032
- Table 101: Global APAC Cane Sugar Market Revenue Million Forecast, by Geography 2019 & 2032
- Table 102: Global APAC Cane Sugar Market Volume k tons Forecast, by Geography 2019 & 2032
- Table 103: Global APAC Cane Sugar Market Revenue Million Forecast, by Country 2019 & 2032
- Table 104: Global APAC Cane Sugar Market Volume k tons Forecast, by Country 2019 & 2032
- Table 105: Global APAC Cane Sugar Market Revenue Million Forecast, by Category 2019 & 2032
- Table 106: Global APAC Cane Sugar Market Volume k tons Forecast, by Category 2019 & 2032
- Table 107: Global APAC Cane Sugar Market Revenue Million Forecast, by Form 2019 & 2032
- Table 108: Global APAC Cane Sugar Market Volume k tons Forecast, by Form 2019 & 2032
- Table 109: Global APAC Cane Sugar Market Revenue Million Forecast, by Application 2019 & 2032
- Table 110: Global APAC Cane Sugar Market Volume k tons Forecast, by Application 2019 & 2032
- Table 111: Global APAC Cane Sugar Market Revenue Million Forecast, by Geography 2019 & 2032
- Table 112: Global APAC Cane Sugar Market Volume k tons Forecast, by Geography 2019 & 2032
- Table 113: Global APAC Cane Sugar Market Revenue Million Forecast, by Country 2019 & 2032
- Table 114: Global APAC Cane Sugar Market Volume k tons Forecast, by Country 2019 & 2032
- Table 115: Global APAC Cane Sugar Market Revenue Million Forecast, by Category 2019 & 2032
- Table 116: Global APAC Cane Sugar Market Volume k tons Forecast, by Category 2019 & 2032
- Table 117: Global APAC Cane Sugar Market Revenue Million Forecast, by Form 2019 & 2032
- Table 118: Global APAC Cane Sugar Market Volume k tons Forecast, by Form 2019 & 2032
- Table 119: Global APAC Cane Sugar Market Revenue Million Forecast, by Application 2019 & 2032
- Table 120: Global APAC Cane Sugar Market Volume k tons Forecast, by Application 2019 & 2032
- Table 121: Global APAC Cane Sugar Market Revenue Million Forecast, by Geography 2019 & 2032
- Table 122: Global APAC Cane Sugar Market Volume k tons Forecast, by Geography 2019 & 2032
- Table 123: Global APAC Cane Sugar Market Revenue Million Forecast, by Country 2019 & 2032
- Table 124: Global APAC Cane Sugar Market Volume k tons Forecast, by Country 2019 & 2032
- Table 125: Global APAC Cane Sugar Market Revenue Million Forecast, by Category 2019 & 2032
- Table 126: Global APAC Cane Sugar Market Volume k tons Forecast, by Category 2019 & 2032
- Table 127: Global APAC Cane Sugar Market Revenue Million Forecast, by Form 2019 & 2032
- Table 128: Global APAC Cane Sugar Market Volume k tons Forecast, by Form 2019 & 2032
- Table 129: Global APAC Cane Sugar Market Revenue Million Forecast, by Application 2019 & 2032
- Table 130: Global APAC Cane Sugar Market Volume k tons Forecast, by Application 2019 & 2032
- Table 131: Global APAC Cane Sugar Market Revenue Million Forecast, by Geography 2019 & 2032
- Table 132: Global APAC Cane Sugar Market Volume k tons Forecast, by Geography 2019 & 2032
- Table 133: Global APAC Cane Sugar Market Revenue Million Forecast, by Country 2019 & 2032
- Table 134: Global APAC Cane Sugar Market Volume k tons Forecast, by Country 2019 & 2032
- Table 135: Global APAC Cane Sugar Market Revenue Million Forecast, by Category 2019 & 2032
- Table 136: Global APAC Cane Sugar Market Volume k tons Forecast, by Category 2019 & 2032
- Table 137: Global APAC Cane Sugar Market Revenue Million Forecast, by Form 2019 & 2032
- Table 138: Global APAC Cane Sugar Market Volume k tons Forecast, by Form 2019 & 2032
- Table 139: Global APAC Cane Sugar Market Revenue Million Forecast, by Application 2019 & 2032
- Table 140: Global APAC Cane Sugar Market Volume k tons Forecast, by Application 2019 & 2032
- Table 141: Global APAC Cane Sugar Market Revenue Million Forecast, by Geography 2019 & 2032
- Table 142: Global APAC Cane Sugar Market Volume k tons Forecast, by Geography 2019 & 2032
- Table 143: Global APAC Cane Sugar Market Revenue Million Forecast, by Country 2019 & 2032
- Table 144: Global APAC Cane Sugar Market Volume k tons Forecast, by Country 2019 & 2032
Frequently Asked Questions
1. What is the projected Compound Annual Growth Rate (CAGR) of the APAC Cane Sugar Market?
The projected CAGR is approximately 8.60%.
2. Which companies are prominent players in the APAC Cane Sugar Market?
Key companies in the market include Triveni Engineering & Industries Ltd (Ganga Sugar Corporation)*List Not Exhaustive, Louis Dreyfus Company B V, Rajshree Sugars & Chemicals Limited, American Sugar Refining Inc, Tate & Lyle PLC, Wilmar Sugar Australia Holdings Pty Ltd, DCM Shriram Consolidated Limited, Global Organics Ltd, Rana Sugars Limited, Nanning Sugar Industry Co Ltd.
3. What are the main segments of the APAC Cane Sugar Market?
The market segments include Category, Form, Application, Geography.
4. Can you provide details about the market size?
The market size is estimated to be USD XX Million as of 2022.
5. What are some drivers contributing to market growth?
Growing Awareness About Insect & Other Alternative Proteins; Increasing Applications Surge Demand for Insect Protein.
6. What are the notable trends driving market growth?
Increased Trade of Organic Cane Sugar.
7. Are there any restraints impacting market growth?
Augmenting Market Penetration of Other Proteins.
8. Can you provide examples of recent developments in the market?
December 2021: MSM Malaysia Holdings Bhd (MSM Malaysia) and Wilmar Sugar Pty Ltd (Wilmar Sugar) inked a collaboration agreement to build a sustainable sugar supply chain. MSM Malaysia and Wilmar Sugar will embark on joint efforts to assist and support each other to pilot an approach to enable sustainable raw sugar sourcing within both companies' joint supply chains by focusing on traceability reporting of sugar supplies and monitoring sustainability performance based on the NDPE Sugar Policy.
9. What pricing options are available for accessing the report?
Pricing options include single-user, multi-user, and enterprise licenses priced at USD 4750, USD 5250, and USD 8750 respectively.
10. Is the market size provided in terms of value or volume?
The market size is provided in terms of value, measured in Million and volume, measured in k tons.
11. Are there any specific market keywords associated with the report?
Yes, the market keyword associated with the report is "APAC Cane Sugar Market," which aids in identifying and referencing the specific market segment covered.
12. How do I determine which pricing option suits my needs best?
The pricing options vary based on user requirements and access needs. Individual users may opt for single-user licenses, while businesses requiring broader access may choose multi-user or enterprise licenses for cost-effective access to the report.
13. Are there any additional resources or data provided in the APAC Cane Sugar Market report?
While the report offers comprehensive insights, it's advisable to review the specific contents or supplementary materials provided to ascertain if additional resources or data are available.
14. How can I stay updated on further developments or reports in the APAC Cane Sugar Market?
To stay informed about further developments, trends, and reports in the APAC Cane Sugar Market, consider subscribing to industry newsletters, following relevant companies and organizations, or regularly checking reputable industry news sources and publications.
Methodology
Step 1 - Identification of Relevant Samples Size from Population Database


Step 2 - Approaches for Defining Global Market Size (Value, Volume* & Price*)

Note*: In applicable scenarios
Step 3 - Data Sources
Primary Research
- Web Analytics
- Survey Reports
- Research Institute
- Latest Research Reports
- Opinion Leaders
Secondary Research
- Annual Reports
- White Paper
- Latest Press Release
- Industry Association
- Paid Database
- Investor Presentations

Step 4 - Data Triangulation
Involves using different sources of information in order to increase the validity of a study
These sources are likely to be stakeholders in a program - participants, other researchers, program staff, other community members, and so on.
Then we put all data in single framework & apply various statistical tools to find out the dynamic on the market.
During the analysis stage, feedback from the stakeholder groups would be compared to determine areas of agreement as well as areas of divergence


