APAC Cashew Industry Trends and Forecast 2025-2033

APAC Cashew Industry by Production Analysis, by Consumption Analysis, by Import Market Analysis (Value & Volume), by Export Market Analysis (Value & Volume), by Price Trend Analysis, by China, by Vietnam, by India, by Indonesia, by Sri Lanka, by Japan, by Philippines Forecast 2025-2033

Jul 10 2025
Base Year: 2024

180 Pages
Main Logo

APAC Cashew Industry Trends and Forecast 2025-2033


Home
Industries
Agriculture
sponsor image

Tailored for you

  • In-depth Analysis Tailored to Specified Regions or Segments
  • Company Profiles Customized to User Preferences
  • Comprehensive Insights Focused on Specific Segments or Regions
  • Customized Evaluation of Competitive Landscape to Meet Your Needs
  • Tailored Customization to Address Other Specific Requirements
Ask for customization


Key Insights

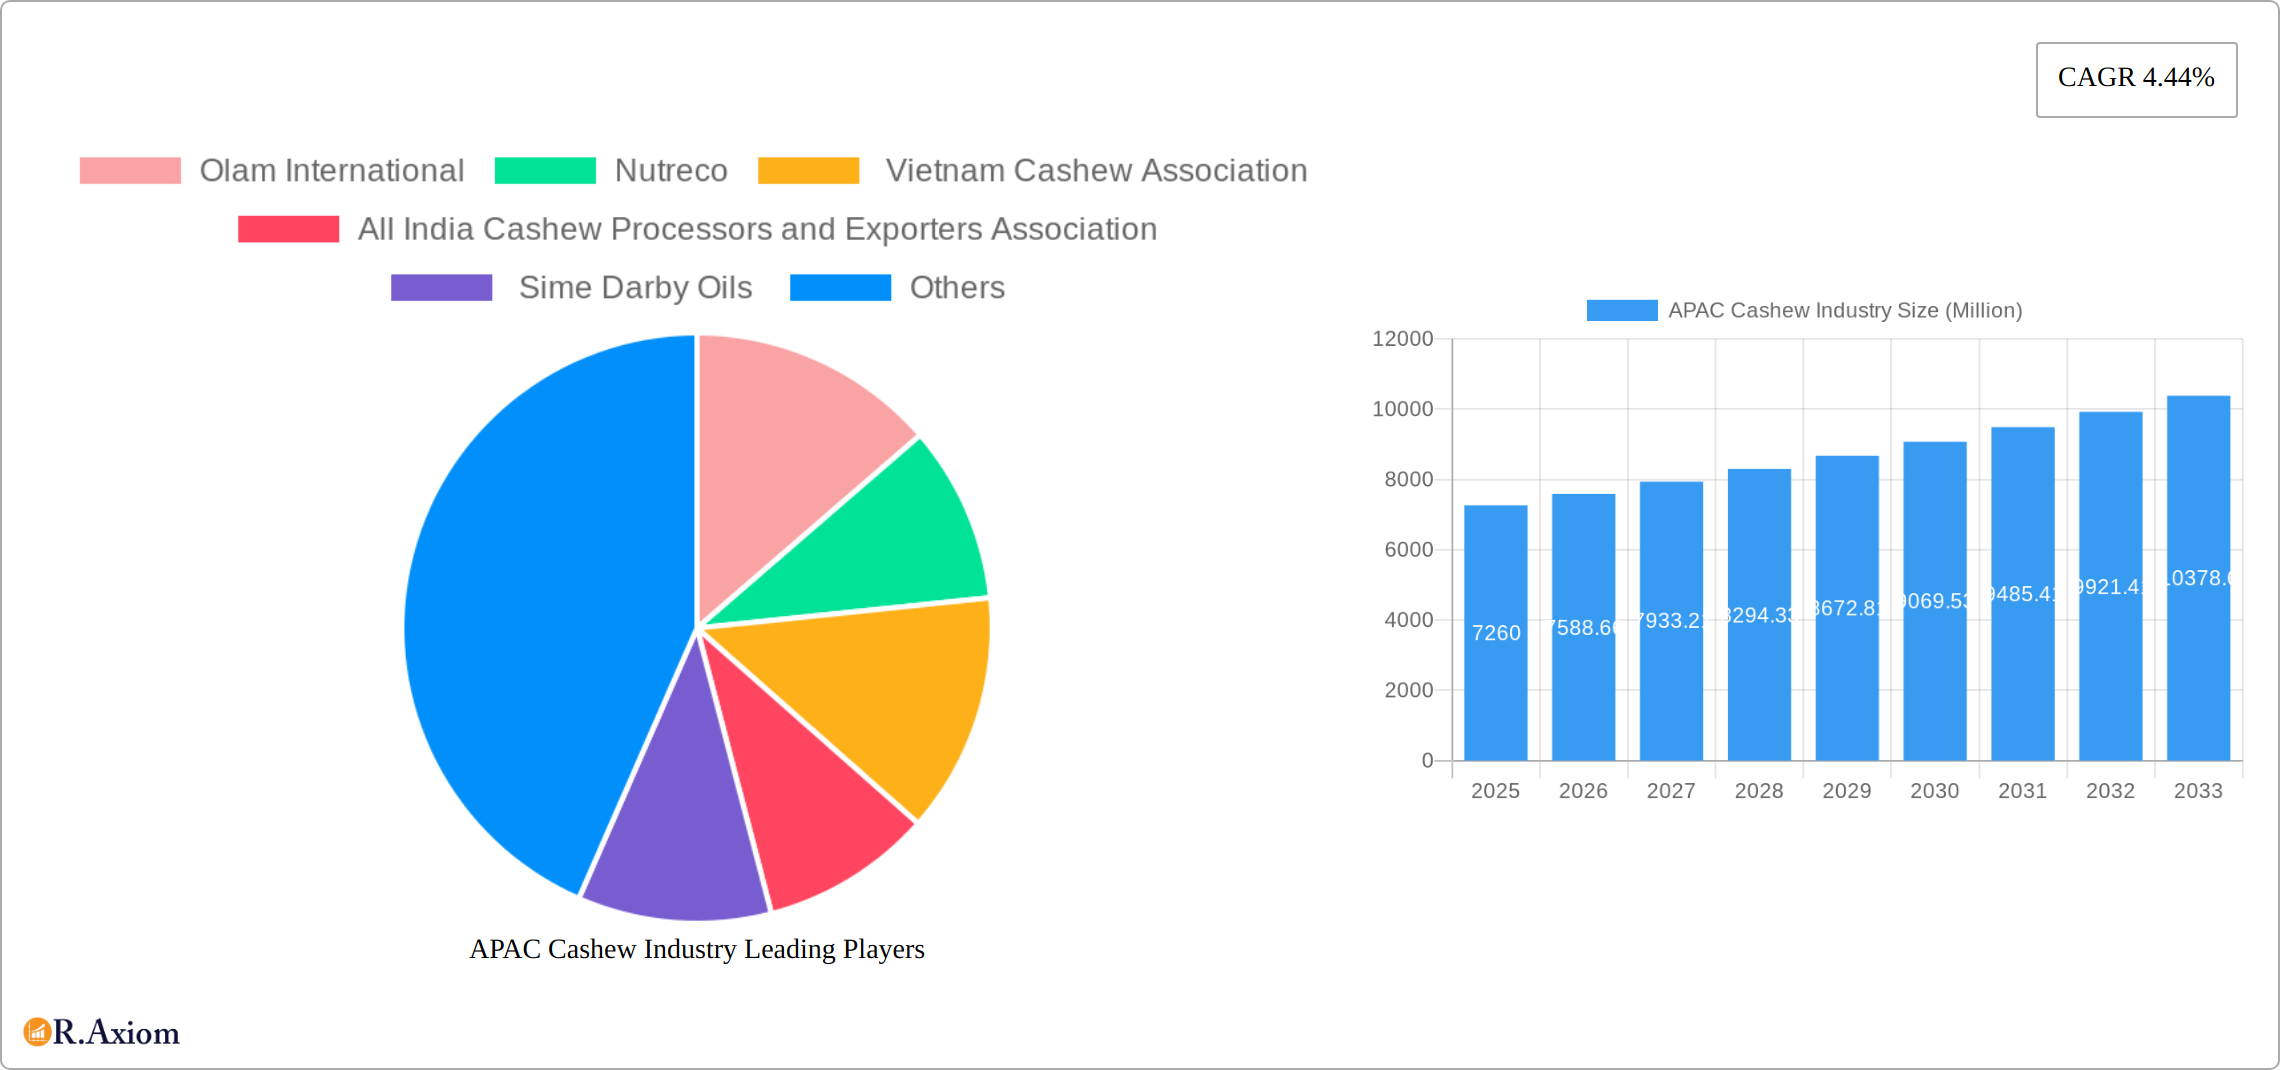
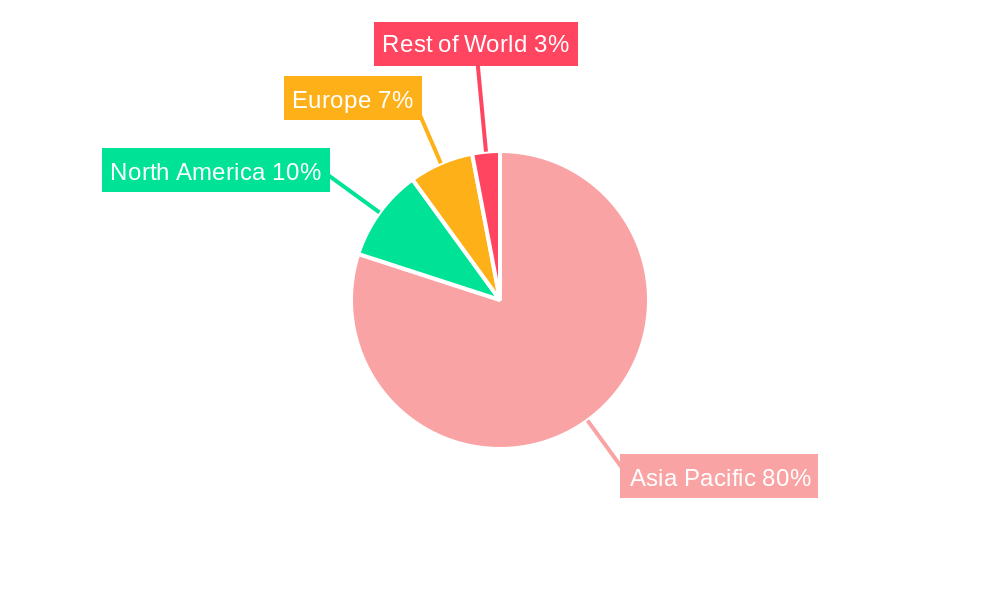
The Asia-Pacific (APAC) cashew industry, valued at $7.26 billion in 2025, is projected to experience robust growth, driven by increasing consumer demand for healthy snacks and the rising popularity of cashew-based products in the food, confectionery, and nutraceutical sectors. The region's diverse culinary traditions and growing middle class contribute significantly to this demand. Key growth drivers include the increasing awareness of cashews' nutritional benefits, such as high protein and healthy fats content, fueling the expansion of the nutraceutical segment. Furthermore, the burgeoning e-commerce sector and the expansion of organized retail channels are providing new avenues for distribution, boosting market accessibility. While challenges exist, such as price volatility due to weather patterns affecting cashew harvests and potential supply chain disruptions, the overall outlook for the APAC cashew market remains positive. India and Vietnam, known for significant cashew production and processing, are major players in this market, while other countries like China, Japan, and South Korea represent substantial consumption markets. The processed cashew segment is likely to outperform the raw cashew segment due to increased consumer preference for ready-to-eat and convenient products.

The projected Compound Annual Growth Rate (CAGR) of 4.44% from 2025 to 2033 indicates a steady expansion of the market. This growth will be further fueled by product innovation, with manufacturers focusing on developing new cashew-based products like cashew milk, cashew butter, and various confectionery items. Strategic partnerships between producers, processors, and retailers are expected to improve efficiency and streamline the supply chain. However, potential restraints include stringent regulations regarding food safety and quality standards, along with concerns about sustainability and ethical sourcing practices. Addressing these challenges will be crucial to ensuring the long-term sustainable growth of the APAC cashew industry. The strong growth projections suggest significant investment opportunities for businesses operating within the sector, particularly those focusing on value-added processed cashew products and innovative distribution strategies.

APAC Cashew Industry Research Report - Market Size, Growth & Forecast

APAC Cashew Industry: A Comprehensive Market Report (2019-2033)

This comprehensive report provides an in-depth analysis of the Asia-Pacific (APAC) cashew industry, covering the period from 2019 to 2033. It offers valuable insights into market trends, segmentation, key players, and future growth opportunities for industry stakeholders, investors, and researchers. With a focus on actionable intelligence, this report helps navigate the complexities of this dynamic market. The base year for this analysis is 2025, with forecasts extending to 2033, utilizing data from the historical period (2019-2024). The report leverages extensive data analysis to provide a detailed overview, including market sizing and growth projections for various segments.

APAC Cashew Industry Market Concentration & Innovation

This section analyzes the competitive landscape of the APAC cashew industry, exploring market concentration, innovation drivers, regulatory frameworks, product substitutes, end-user trends, and mergers and acquisitions (M&A) activities. The APAC cashew market exhibits a moderately concentrated structure, with a few dominant players like Olam International and Sime Darby Oils holding significant market share. However, smaller regional players and emerging businesses contribute significantly to overall production and distribution.

  • Market Share: Olam International holds an estimated xx% market share, followed by Sime Darby Oils with xx%. The remaining share is distributed among numerous regional processors and exporters.
  • Innovation Drivers: Innovation is driven by consumer demand for value-added products like roasted, salted, and flavored cashews, as well as the development of nutraceutical products utilizing cashew-derived ingredients. Technological advancements in processing and packaging are also key drivers.
  • Regulatory Frameworks: Varying regulations across APAC nations impact production, processing, and trade. Compliance requirements and import/export duties contribute to the complexity of the market.
  • Product Substitutes: Other nuts (almonds, walnuts, pistachios) and alternative snacks compete with cashews.
  • End-User Trends: Growing health consciousness is boosting demand for cashews, while rising disposable incomes and changing dietary preferences further drive market growth.
  • M&A Activities: The APAC cashew industry has witnessed several M&A activities in recent years, primarily driven by consolidation efforts and expansion strategies. Total M&A deal value for the period 2019-2024 is estimated at USD xx Million.

APAC Cashew Industry Industry Trends & Insights

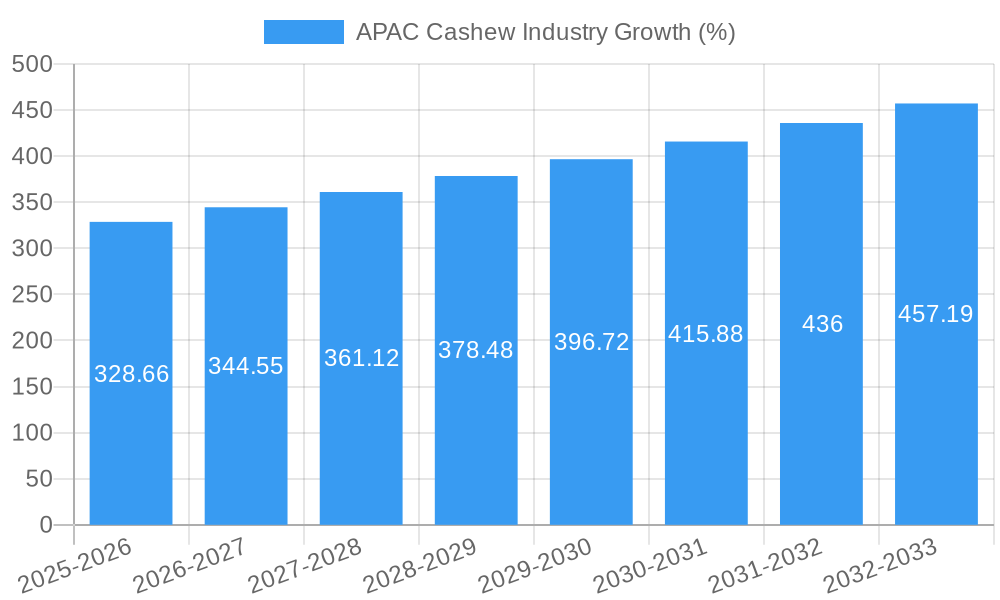
The APAC cashew industry is experiencing robust growth, fueled by several key factors. The compound annual growth rate (CAGR) during the forecast period (2025-2033) is projected at xx%, driven primarily by the rising demand for healthy snacks, increasing awareness of cashew's nutritional benefits, and the expanding food processing sector across the region.

Market penetration of cashew products within various food segments is steadily increasing, reflecting a shift toward healthier, convenient snack options. Technological advancements in processing and packaging technology are enhancing the quality, shelf-life, and appeal of cashew products. Consumer preference for convenient packaging formats and innovative flavors also fuels this growth. However, fluctuations in raw material prices and supply chain complexities remain significant challenges. Competitive dynamics are characterized by both established international players and numerous regional processors. The market is witnessing increasing competition, especially in the processed cashew segment.

APAC Cashew Industry Growth

Dominant Markets & Segments in APAC Cashew Industry

Dominant Region: India and Vietnam are the leading producers and exporters of cashew nuts in the APAC region, significantly impacting overall market dynamics.

Dominant Segments:

  • Type: Processed cashew nuts dominate the market, with a significantly higher value compared to raw cashew nuts. This is driven by consumer preference for convenience and ready-to-eat options.
  • Application: The food industry accounts for the largest share of cashew consumption, closely followed by the confectionery industry. The nutraceutical industry is experiencing moderate growth as cashew's health benefits are recognized.
  • Distribution Channel: Retail channels dominate, although food service and online sales channels are showing significant growth potential.

Key Drivers:

  • India: Strong government support through initiatives like MIDH and RKVY, coupled with a large domestic market, and established processing infrastructure.
  • Vietnam: Favorable climate conditions for cashew cultivation, expanding export markets, and government policies supporting agricultural development.

APAC Cashew Industry Product Developments

The APAC cashew industry is experiencing significant growth fueled by innovative product development. This includes a surge in value-added products such as roasted, salted, flavored, organic, and even plant-based cashew alternatives. Convenient packaging formats, including resealable pouches and single-serve packs, cater to modern consumer lifestyles. Furthermore, improvements in processing technologies lead to enhanced product quality, reduced waste, and increased efficiency. This focus on diverse flavors and health-conscious options ensures the market caters to a wide range of consumer preferences and dietary needs. The rise of e-commerce and direct-to-consumer channels is also impacting product development and distribution strategies.

Report Scope & Segmentation Analysis

This report segments the APAC cashew market by:

  • Type: Raw Cashew Nuts (Market size in 2025: USD xx Million; projected CAGR: xx%); Processed Cashew Nuts (Market size in 2025: USD xx Million; projected CAGR: xx%). Competitive dynamics in processed cashews are intense due to high demand and numerous players.

  • Application: Food Industry (Market size in 2025: USD xx Million; projected CAGR: xx%); Confectionery Industry (Market size in 2025: USD xx Million; projected CAGR: xx%); Nutraceutical Industry (Market size in 2025: USD xx Million; projected CAGR: xx%). The nutraceutical segment is showing high growth potential.

  • Distribution Channel: Retail (Market size in 2025: USD xx Million; projected CAGR: xx%); Food Service (Market size in 2025: USD xx Million; projected CAGR: xx%); Online (Market size in 2025: USD xx Million; projected CAGR: xx%). Online channels show high growth potential.

Key Drivers of APAC Cashew Industry Growth

Several key factors are driving the robust growth of the APAC cashew industry. A significant contributor is the rising disposable incomes across the region, leading to increased spending on premium snacks and food items. This is coupled with a growing health consciousness among consumers, boosting demand for nutritious and healthy snack alternatives. Supportive government policies in key cashew-producing countries, such as initiatives promoting agricultural development and improved farming practices, further stimulate industry expansion. Technological advancements in processing and packaging continue to enhance efficiency, product quality, and shelf life. Finally, the expanding food processing and confectionery industries in APAC create a substantial demand for both raw and processed cashews as a key ingredient.

Challenges in the APAC Cashew Industry Sector

The APAC cashew industry faces challenges such as fluctuating raw material prices, supply chain disruptions, and intense competition. Regulatory hurdles related to international trade and varying quality standards across different nations pose challenges. Seasonal variations in cashew production and the impact of climate change on yields also pose significant threats. The industry faces potential labor shortages and increased operational costs.

Emerging Opportunities in APAP Cashew Industry

Opportunities lie in expanding into new markets, developing innovative products (e.g., cashew-based protein bars, cashew milk alternatives), and adopting sustainable agricultural practices. The rising demand for organic and ethically sourced cashews presents an opportunity for companies to cater to a growing niche market. The nutraceutical segment presents a promising avenue for further growth. Strategic collaborations and investments in advanced processing technologies will also drive growth.

Leading Players in the APAC Cashew Industry Market

  • Olam International
  • Nutreco
  • Vietnam Cashew Association
  • All India Cashew Processors and Exporters Association
  • Sime Darby Oils
  • Other significant regional players and emerging brands (further research needed to specify)

Key Developments in APAC Cashew Industry Industry

  • January 2023: CRISIL reported that the Indian cashew processing industry's revenue exceeded USD 300,000 Million in 2022, a 15% year-on-year increase, indicating strong market demand.
  • July 2022: The Indian government's MIDH and RKVY initiatives increased domestic cashew production, with plans to expand cultivation by 1.20 lakh hectares.
  • February 2021: The Bangladeshi government launched a project aimed at expanding cashew cultivation and processing capabilities.

Strategic Outlook for APAC Cashew Industry Market

The future of the APAC cashew industry appears exceptionally promising. Sustained growth is anticipated, driven by several factors. The expanding middle class in many APAC nations, coupled with rising health consciousness, will fuel increased demand for cashew products. Government support and investment in key production regions will continue to play a vital role. Furthermore, the development of innovative products, sustainable farming practices, and ethical sourcing initiatives will be key differentiators for success. Companies that prioritize technological innovation, efficient supply chains, and the creation of value-added products are best positioned to capture the significant market opportunities in this dynamic sector. The emergence of new distribution channels, including e-commerce and direct-to-consumer platforms, will also significantly shape the market landscape.

APAC Cashew Industry Segmentation

  • 1. Production Analysis
  • 2. Consumption Analysis
  • 3. Import Market Analysis (Value & Volume)
  • 4. Export Market Analysis (Value & Volume)
  • 5. Price Trend Analysis

APAC Cashew Industry Segmentation By Geography

  • 1. China
  • 2. Vietnam
  • 3. India
  • 4. Indonesia
  • 5. Sri Lanka
  • 6. Japan
  • 7. Philippines
APAC Cashew Industry Regional Share


APAC Cashew Industry REPORT HIGHLIGHTS

AspectsDetails
Study Period 2019-2033
Base Year 2024
Estimated Year 2025
Forecast Period2025-2033
Historical Period2019-2024
Growth RateCAGR of 4.44% from 2019-2033
Segmentation
    • By Production Analysis
    • By Consumption Analysis
    • By Import Market Analysis (Value & Volume)
    • By Export Market Analysis (Value & Volume)
    • By Price Trend Analysis
  • By Geography
    • China
    • Vietnam
    • India
    • Indonesia
    • Sri Lanka
    • Japan
    • Philippines


Table of Contents

  1. 1. Introduction
    • 1.1. Research Scope
    • 1.2. Market Segmentation
    • 1.3. Research Methodology
    • 1.4. Definitions and Assumptions
  2. 2. Executive Summary
    • 2.1. Introduction
  3. 3. Market Dynamics
    • 3.1. Introduction
      • 3.2. Market Drivers
        • 3.2.1. Rising Consumption of Cashew Nuts as a Healthy Snack; Increasing Government initiatives; Growing Cashew Nut Imports in The United States
      • 3.3. Market Restrains
        • 3.3.1. Hazardous Climatic Condition Hinders Cashew Production; Stringent Regulations Related To Food Quality Standards
      • 3.4. Market Trends
        • 3.4.1. Increased Cashew Application in Food Industry to boost the Market
  4. 4. Market Factor Analysis
    • 4.1. Porters Five Forces
    • 4.2. Supply/Value Chain
    • 4.3. PESTEL analysis
    • 4.4. Market Entropy
    • 4.5. Patent/Trademark Analysis
  5. 5. Global APAC Cashew Industry Analysis, Insights and Forecast, 2019-2031
    • 5.1. Market Analysis, Insights and Forecast - by Production Analysis
      • 5.2. Market Analysis, Insights and Forecast - by Consumption Analysis
        • 5.3. Market Analysis, Insights and Forecast - by Import Market Analysis (Value & Volume)
          • 5.4. Market Analysis, Insights and Forecast - by Export Market Analysis (Value & Volume)
            • 5.5. Market Analysis, Insights and Forecast - by Price Trend Analysis
              • 5.6. Market Analysis, Insights and Forecast - by Region
                • 5.6.1. China
                • 5.6.2. Vietnam
                • 5.6.3. India
                • 5.6.4. Indonesia
                • 5.6.5. Sri Lanka
                • 5.6.6. Japan
                • 5.6.7. Philippines
            • 6. China APAC Cashew Industry Analysis, Insights and Forecast, 2019-2031
              • 6.1. Market Analysis, Insights and Forecast - by Production Analysis
                • 6.2. Market Analysis, Insights and Forecast - by Consumption Analysis
                  • 6.3. Market Analysis, Insights and Forecast - by Import Market Analysis (Value & Volume)
                    • 6.4. Market Analysis, Insights and Forecast - by Export Market Analysis (Value & Volume)
                      • 6.5. Market Analysis, Insights and Forecast - by Price Trend Analysis
                      • 7. Vietnam APAC Cashew Industry Analysis, Insights and Forecast, 2019-2031
                        • 7.1. Market Analysis, Insights and Forecast - by Production Analysis
                          • 7.2. Market Analysis, Insights and Forecast - by Consumption Analysis
                            • 7.3. Market Analysis, Insights and Forecast - by Import Market Analysis (Value & Volume)
                              • 7.4. Market Analysis, Insights and Forecast - by Export Market Analysis (Value & Volume)
                                • 7.5. Market Analysis, Insights and Forecast - by Price Trend Analysis
                                • 8. India APAC Cashew Industry Analysis, Insights and Forecast, 2019-2031
                                  • 8.1. Market Analysis, Insights and Forecast - by Production Analysis
                                    • 8.2. Market Analysis, Insights and Forecast - by Consumption Analysis
                                      • 8.3. Market Analysis, Insights and Forecast - by Import Market Analysis (Value & Volume)
                                        • 8.4. Market Analysis, Insights and Forecast - by Export Market Analysis (Value & Volume)
                                          • 8.5. Market Analysis, Insights and Forecast - by Price Trend Analysis
                                          • 9. Indonesia APAC Cashew Industry Analysis, Insights and Forecast, 2019-2031
                                            • 9.1. Market Analysis, Insights and Forecast - by Production Analysis
                                              • 9.2. Market Analysis, Insights and Forecast - by Consumption Analysis
                                                • 9.3. Market Analysis, Insights and Forecast - by Import Market Analysis (Value & Volume)
                                                  • 9.4. Market Analysis, Insights and Forecast - by Export Market Analysis (Value & Volume)
                                                    • 9.5. Market Analysis, Insights and Forecast - by Price Trend Analysis
                                                    • 10. Sri Lanka APAC Cashew Industry Analysis, Insights and Forecast, 2019-2031
                                                      • 10.1. Market Analysis, Insights and Forecast - by Production Analysis
                                                        • 10.2. Market Analysis, Insights and Forecast - by Consumption Analysis
                                                          • 10.3. Market Analysis, Insights and Forecast - by Import Market Analysis (Value & Volume)
                                                            • 10.4. Market Analysis, Insights and Forecast - by Export Market Analysis (Value & Volume)
                                                              • 10.5. Market Analysis, Insights and Forecast - by Price Trend Analysis
                                                              • 11. Japan APAC Cashew Industry Analysis, Insights and Forecast, 2019-2031
                                                                • 11.1. Market Analysis, Insights and Forecast - by Production Analysis
                                                                  • 11.2. Market Analysis, Insights and Forecast - by Consumption Analysis
                                                                    • 11.3. Market Analysis, Insights and Forecast - by Import Market Analysis (Value & Volume)
                                                                      • 11.4. Market Analysis, Insights and Forecast - by Export Market Analysis (Value & Volume)
                                                                        • 11.5. Market Analysis, Insights and Forecast - by Price Trend Analysis
                                                                        • 12. Philippines APAC Cashew Industry Analysis, Insights and Forecast, 2019-2031
                                                                          • 12.1. Market Analysis, Insights and Forecast - by Production Analysis
                                                                            • 12.2. Market Analysis, Insights and Forecast - by Consumption Analysis
                                                                              • 12.3. Market Analysis, Insights and Forecast - by Import Market Analysis (Value & Volume)
                                                                                • 12.4. Market Analysis, Insights and Forecast - by Export Market Analysis (Value & Volume)
                                                                                  • 12.5. Market Analysis, Insights and Forecast - by Price Trend Analysis
                                                                                  • 13. China APAC Cashew Industry Analysis, Insights and Forecast, 2019-2031
                                                                                    • 14. Japan APAC Cashew Industry Analysis, Insights and Forecast, 2019-2031
                                                                                      • 15. India APAC Cashew Industry Analysis, Insights and Forecast, 2019-2031
                                                                                        • 16. South Korea APAC Cashew Industry Analysis, Insights and Forecast, 2019-2031
                                                                                          • 17. Taiwan APAC Cashew Industry Analysis, Insights and Forecast, 2019-2031
                                                                                            • 18. Australia APAC Cashew Industry Analysis, Insights and Forecast, 2019-2031
                                                                                              • 19. Rest of Asia-Pacific APAC Cashew Industry Analysis, Insights and Forecast, 2019-2031
                                                                                                • 20. Competitive Analysis
                                                                                                  • 20.1. Global Market Share Analysis 2024
                                                                                                    • 20.2. Company Profiles
                                                                                                      • 20.2.1 Olam International
                                                                                                        • 20.2.1.1. Overview
                                                                                                        • 20.2.1.2. Products
                                                                                                        • 20.2.1.3. SWOT Analysis
                                                                                                        • 20.2.1.4. Recent Developments
                                                                                                        • 20.2.1.5. Financials (Based on Availability)
                                                                                                      • 20.2.2 Nutreco
                                                                                                        • 20.2.2.1. Overview
                                                                                                        • 20.2.2.2. Products
                                                                                                        • 20.2.2.3. SWOT Analysis
                                                                                                        • 20.2.2.4. Recent Developments
                                                                                                        • 20.2.2.5. Financials (Based on Availability)
                                                                                                      • 20.2.3 Vietnam Cashew Association
                                                                                                        • 20.2.3.1. Overview
                                                                                                        • 20.2.3.2. Products
                                                                                                        • 20.2.3.3. SWOT Analysis
                                                                                                        • 20.2.3.4. Recent Developments
                                                                                                        • 20.2.3.5. Financials (Based on Availability)
                                                                                                      • 20.2.4 All India Cashew Processors and Exporters Association
                                                                                                        • 20.2.4.1. Overview
                                                                                                        • 20.2.4.2. Products
                                                                                                        • 20.2.4.3. SWOT Analysis
                                                                                                        • 20.2.4.4. Recent Developments
                                                                                                        • 20.2.4.5. Financials (Based on Availability)
                                                                                                      • 20.2.5 Sime Darby Oils
                                                                                                        • 20.2.5.1. Overview
                                                                                                        • 20.2.5.2. Products
                                                                                                        • 20.2.5.3. SWOT Analysis
                                                                                                        • 20.2.5.4. Recent Developments
                                                                                                        • 20.2.5.5. Financials (Based on Availability)

                                                                                                List of Figures

                                                                                                1. Figure 1: Global APAC Cashew Industry Revenue Breakdown (Million, %) by Region 2024 & 2032
                                                                                                2. Figure 2: Global APAC Cashew Industry Volume Breakdown (Kiloton, %) by Region 2024 & 2032
                                                                                                3. Figure 3: Asia Pacific APAC Cashew Industry Revenue (Million), by Country 2024 & 2032
                                                                                                4. Figure 4: Asia Pacific APAC Cashew Industry Volume (Kiloton), by Country 2024 & 2032
                                                                                                5. Figure 5: Asia Pacific APAC Cashew Industry Revenue Share (%), by Country 2024 & 2032
                                                                                                6. Figure 6: Asia Pacific APAC Cashew Industry Volume Share (%), by Country 2024 & 2032
                                                                                                7. Figure 7: China APAC Cashew Industry Revenue (Million), by Production Analysis 2024 & 2032
                                                                                                8. Figure 8: China APAC Cashew Industry Volume (Kiloton), by Production Analysis 2024 & 2032
                                                                                                9. Figure 9: China APAC Cashew Industry Revenue Share (%), by Production Analysis 2024 & 2032
                                                                                                10. Figure 10: China APAC Cashew Industry Volume Share (%), by Production Analysis 2024 & 2032
                                                                                                11. Figure 11: China APAC Cashew Industry Revenue (Million), by Consumption Analysis 2024 & 2032
                                                                                                12. Figure 12: China APAC Cashew Industry Volume (Kiloton), by Consumption Analysis 2024 & 2032
                                                                                                13. Figure 13: China APAC Cashew Industry Revenue Share (%), by Consumption Analysis 2024 & 2032
                                                                                                14. Figure 14: China APAC Cashew Industry Volume Share (%), by Consumption Analysis 2024 & 2032
                                                                                                15. Figure 15: China APAC Cashew Industry Revenue (Million), by Import Market Analysis (Value & Volume) 2024 & 2032
                                                                                                16. Figure 16: China APAC Cashew Industry Volume (Kiloton), by Import Market Analysis (Value & Volume) 2024 & 2032
                                                                                                17. Figure 17: China APAC Cashew Industry Revenue Share (%), by Import Market Analysis (Value & Volume) 2024 & 2032
                                                                                                18. Figure 18: China APAC Cashew Industry Volume Share (%), by Import Market Analysis (Value & Volume) 2024 & 2032
                                                                                                19. Figure 19: China APAC Cashew Industry Revenue (Million), by Export Market Analysis (Value & Volume) 2024 & 2032
                                                                                                20. Figure 20: China APAC Cashew Industry Volume (Kiloton), by Export Market Analysis (Value & Volume) 2024 & 2032
                                                                                                21. Figure 21: China APAC Cashew Industry Revenue Share (%), by Export Market Analysis (Value & Volume) 2024 & 2032
                                                                                                22. Figure 22: China APAC Cashew Industry Volume Share (%), by Export Market Analysis (Value & Volume) 2024 & 2032
                                                                                                23. Figure 23: China APAC Cashew Industry Revenue (Million), by Price Trend Analysis 2024 & 2032
                                                                                                24. Figure 24: China APAC Cashew Industry Volume (Kiloton), by Price Trend Analysis 2024 & 2032
                                                                                                25. Figure 25: China APAC Cashew Industry Revenue Share (%), by Price Trend Analysis 2024 & 2032
                                                                                                26. Figure 26: China APAC Cashew Industry Volume Share (%), by Price Trend Analysis 2024 & 2032
                                                                                                27. Figure 27: China APAC Cashew Industry Revenue (Million), by Country 2024 & 2032
                                                                                                28. Figure 28: China APAC Cashew Industry Volume (Kiloton), by Country 2024 & 2032
                                                                                                29. Figure 29: China APAC Cashew Industry Revenue Share (%), by Country 2024 & 2032
                                                                                                30. Figure 30: China APAC Cashew Industry Volume Share (%), by Country 2024 & 2032
                                                                                                31. Figure 31: Vietnam APAC Cashew Industry Revenue (Million), by Production Analysis 2024 & 2032
                                                                                                32. Figure 32: Vietnam APAC Cashew Industry Volume (Kiloton), by Production Analysis 2024 & 2032
                                                                                                33. Figure 33: Vietnam APAC Cashew Industry Revenue Share (%), by Production Analysis 2024 & 2032
                                                                                                34. Figure 34: Vietnam APAC Cashew Industry Volume Share (%), by Production Analysis 2024 & 2032
                                                                                                35. Figure 35: Vietnam APAC Cashew Industry Revenue (Million), by Consumption Analysis 2024 & 2032
                                                                                                36. Figure 36: Vietnam APAC Cashew Industry Volume (Kiloton), by Consumption Analysis 2024 & 2032
                                                                                                37. Figure 37: Vietnam APAC Cashew Industry Revenue Share (%), by Consumption Analysis 2024 & 2032
                                                                                                38. Figure 38: Vietnam APAC Cashew Industry Volume Share (%), by Consumption Analysis 2024 & 2032
                                                                                                39. Figure 39: Vietnam APAC Cashew Industry Revenue (Million), by Import Market Analysis (Value & Volume) 2024 & 2032
                                                                                                40. Figure 40: Vietnam APAC Cashew Industry Volume (Kiloton), by Import Market Analysis (Value & Volume) 2024 & 2032
                                                                                                41. Figure 41: Vietnam APAC Cashew Industry Revenue Share (%), by Import Market Analysis (Value & Volume) 2024 & 2032
                                                                                                42. Figure 42: Vietnam APAC Cashew Industry Volume Share (%), by Import Market Analysis (Value & Volume) 2024 & 2032
                                                                                                43. Figure 43: Vietnam APAC Cashew Industry Revenue (Million), by Export Market Analysis (Value & Volume) 2024 & 2032
                                                                                                44. Figure 44: Vietnam APAC Cashew Industry Volume (Kiloton), by Export Market Analysis (Value & Volume) 2024 & 2032
                                                                                                45. Figure 45: Vietnam APAC Cashew Industry Revenue Share (%), by Export Market Analysis (Value & Volume) 2024 & 2032
                                                                                                46. Figure 46: Vietnam APAC Cashew Industry Volume Share (%), by Export Market Analysis (Value & Volume) 2024 & 2032
                                                                                                47. Figure 47: Vietnam APAC Cashew Industry Revenue (Million), by Price Trend Analysis 2024 & 2032
                                                                                                48. Figure 48: Vietnam APAC Cashew Industry Volume (Kiloton), by Price Trend Analysis 2024 & 2032
                                                                                                49. Figure 49: Vietnam APAC Cashew Industry Revenue Share (%), by Price Trend Analysis 2024 & 2032
                                                                                                50. Figure 50: Vietnam APAC Cashew Industry Volume Share (%), by Price Trend Analysis 2024 & 2032
                                                                                                51. Figure 51: Vietnam APAC Cashew Industry Revenue (Million), by Country 2024 & 2032
                                                                                                52. Figure 52: Vietnam APAC Cashew Industry Volume (Kiloton), by Country 2024 & 2032
                                                                                                53. Figure 53: Vietnam APAC Cashew Industry Revenue Share (%), by Country 2024 & 2032
                                                                                                54. Figure 54: Vietnam APAC Cashew Industry Volume Share (%), by Country 2024 & 2032
                                                                                                55. Figure 55: India APAC Cashew Industry Revenue (Million), by Production Analysis 2024 & 2032
                                                                                                56. Figure 56: India APAC Cashew Industry Volume (Kiloton), by Production Analysis 2024 & 2032
                                                                                                57. Figure 57: India APAC Cashew Industry Revenue Share (%), by Production Analysis 2024 & 2032
                                                                                                58. Figure 58: India APAC Cashew Industry Volume Share (%), by Production Analysis 2024 & 2032
                                                                                                59. Figure 59: India APAC Cashew Industry Revenue (Million), by Consumption Analysis 2024 & 2032
                                                                                                60. Figure 60: India APAC Cashew Industry Volume (Kiloton), by Consumption Analysis 2024 & 2032
                                                                                                61. Figure 61: India APAC Cashew Industry Revenue Share (%), by Consumption Analysis 2024 & 2032
                                                                                                62. Figure 62: India APAC Cashew Industry Volume Share (%), by Consumption Analysis 2024 & 2032
                                                                                                63. Figure 63: India APAC Cashew Industry Revenue (Million), by Import Market Analysis (Value & Volume) 2024 & 2032
                                                                                                64. Figure 64: India APAC Cashew Industry Volume (Kiloton), by Import Market Analysis (Value & Volume) 2024 & 2032
                                                                                                65. Figure 65: India APAC Cashew Industry Revenue Share (%), by Import Market Analysis (Value & Volume) 2024 & 2032
                                                                                                66. Figure 66: India APAC Cashew Industry Volume Share (%), by Import Market Analysis (Value & Volume) 2024 & 2032
                                                                                                67. Figure 67: India APAC Cashew Industry Revenue (Million), by Export Market Analysis (Value & Volume) 2024 & 2032
                                                                                                68. Figure 68: India APAC Cashew Industry Volume (Kiloton), by Export Market Analysis (Value & Volume) 2024 & 2032
                                                                                                69. Figure 69: India APAC Cashew Industry Revenue Share (%), by Export Market Analysis (Value & Volume) 2024 & 2032
                                                                                                70. Figure 70: India APAC Cashew Industry Volume Share (%), by Export Market Analysis (Value & Volume) 2024 & 2032
                                                                                                71. Figure 71: India APAC Cashew Industry Revenue (Million), by Price Trend Analysis 2024 & 2032
                                                                                                72. Figure 72: India APAC Cashew Industry Volume (Kiloton), by Price Trend Analysis 2024 & 2032
                                                                                                73. Figure 73: India APAC Cashew Industry Revenue Share (%), by Price Trend Analysis 2024 & 2032
                                                                                                74. Figure 74: India APAC Cashew Industry Volume Share (%), by Price Trend Analysis 2024 & 2032
                                                                                                75. Figure 75: India APAC Cashew Industry Revenue (Million), by Country 2024 & 2032
                                                                                                76. Figure 76: India APAC Cashew Industry Volume (Kiloton), by Country 2024 & 2032
                                                                                                77. Figure 77: India APAC Cashew Industry Revenue Share (%), by Country 2024 & 2032
                                                                                                78. Figure 78: India APAC Cashew Industry Volume Share (%), by Country 2024 & 2032
                                                                                                79. Figure 79: Indonesia APAC Cashew Industry Revenue (Million), by Production Analysis 2024 & 2032
                                                                                                80. Figure 80: Indonesia APAC Cashew Industry Volume (Kiloton), by Production Analysis 2024 & 2032
                                                                                                81. Figure 81: Indonesia APAC Cashew Industry Revenue Share (%), by Production Analysis 2024 & 2032
                                                                                                82. Figure 82: Indonesia APAC Cashew Industry Volume Share (%), by Production Analysis 2024 & 2032
                                                                                                83. Figure 83: Indonesia APAC Cashew Industry Revenue (Million), by Consumption Analysis 2024 & 2032
                                                                                                84. Figure 84: Indonesia APAC Cashew Industry Volume (Kiloton), by Consumption Analysis 2024 & 2032
                                                                                                85. Figure 85: Indonesia APAC Cashew Industry Revenue Share (%), by Consumption Analysis 2024 & 2032
                                                                                                86. Figure 86: Indonesia APAC Cashew Industry Volume Share (%), by Consumption Analysis 2024 & 2032
                                                                                                87. Figure 87: Indonesia APAC Cashew Industry Revenue (Million), by Import Market Analysis (Value & Volume) 2024 & 2032
                                                                                                88. Figure 88: Indonesia APAC Cashew Industry Volume (Kiloton), by Import Market Analysis (Value & Volume) 2024 & 2032
                                                                                                89. Figure 89: Indonesia APAC Cashew Industry Revenue Share (%), by Import Market Analysis (Value & Volume) 2024 & 2032
                                                                                                90. Figure 90: Indonesia APAC Cashew Industry Volume Share (%), by Import Market Analysis (Value & Volume) 2024 & 2032
                                                                                                91. Figure 91: Indonesia APAC Cashew Industry Revenue (Million), by Export Market Analysis (Value & Volume) 2024 & 2032
                                                                                                92. Figure 92: Indonesia APAC Cashew Industry Volume (Kiloton), by Export Market Analysis (Value & Volume) 2024 & 2032
                                                                                                93. Figure 93: Indonesia APAC Cashew Industry Revenue Share (%), by Export Market Analysis (Value & Volume) 2024 & 2032
                                                                                                94. Figure 94: Indonesia APAC Cashew Industry Volume Share (%), by Export Market Analysis (Value & Volume) 2024 & 2032
                                                                                                95. Figure 95: Indonesia APAC Cashew Industry Revenue (Million), by Price Trend Analysis 2024 & 2032
                                                                                                96. Figure 96: Indonesia APAC Cashew Industry Volume (Kiloton), by Price Trend Analysis 2024 & 2032
                                                                                                97. Figure 97: Indonesia APAC Cashew Industry Revenue Share (%), by Price Trend Analysis 2024 & 2032
                                                                                                98. Figure 98: Indonesia APAC Cashew Industry Volume Share (%), by Price Trend Analysis 2024 & 2032
                                                                                                99. Figure 99: Indonesia APAC Cashew Industry Revenue (Million), by Country 2024 & 2032
                                                                                                100. Figure 100: Indonesia APAC Cashew Industry Volume (Kiloton), by Country 2024 & 2032
                                                                                                101. Figure 101: Indonesia APAC Cashew Industry Revenue Share (%), by Country 2024 & 2032
                                                                                                102. Figure 102: Indonesia APAC Cashew Industry Volume Share (%), by Country 2024 & 2032
                                                                                                103. Figure 103: Sri Lanka APAC Cashew Industry Revenue (Million), by Production Analysis 2024 & 2032
                                                                                                104. Figure 104: Sri Lanka APAC Cashew Industry Volume (Kiloton), by Production Analysis 2024 & 2032
                                                                                                105. Figure 105: Sri Lanka APAC Cashew Industry Revenue Share (%), by Production Analysis 2024 & 2032
                                                                                                106. Figure 106: Sri Lanka APAC Cashew Industry Volume Share (%), by Production Analysis 2024 & 2032
                                                                                                107. Figure 107: Sri Lanka APAC Cashew Industry Revenue (Million), by Consumption Analysis 2024 & 2032
                                                                                                108. Figure 108: Sri Lanka APAC Cashew Industry Volume (Kiloton), by Consumption Analysis 2024 & 2032
                                                                                                109. Figure 109: Sri Lanka APAC Cashew Industry Revenue Share (%), by Consumption Analysis 2024 & 2032
                                                                                                110. Figure 110: Sri Lanka APAC Cashew Industry Volume Share (%), by Consumption Analysis 2024 & 2032
                                                                                                111. Figure 111: Sri Lanka APAC Cashew Industry Revenue (Million), by Import Market Analysis (Value & Volume) 2024 & 2032
                                                                                                112. Figure 112: Sri Lanka APAC Cashew Industry Volume (Kiloton), by Import Market Analysis (Value & Volume) 2024 & 2032
                                                                                                113. Figure 113: Sri Lanka APAC Cashew Industry Revenue Share (%), by Import Market Analysis (Value & Volume) 2024 & 2032
                                                                                                114. Figure 114: Sri Lanka APAC Cashew Industry Volume Share (%), by Import Market Analysis (Value & Volume) 2024 & 2032
                                                                                                115. Figure 115: Sri Lanka APAC Cashew Industry Revenue (Million), by Export Market Analysis (Value & Volume) 2024 & 2032
                                                                                                116. Figure 116: Sri Lanka APAC Cashew Industry Volume (Kiloton), by Export Market Analysis (Value & Volume) 2024 & 2032
                                                                                                117. Figure 117: Sri Lanka APAC Cashew Industry Revenue Share (%), by Export Market Analysis (Value & Volume) 2024 & 2032
                                                                                                118. Figure 118: Sri Lanka APAC Cashew Industry Volume Share (%), by Export Market Analysis (Value & Volume) 2024 & 2032
                                                                                                119. Figure 119: Sri Lanka APAC Cashew Industry Revenue (Million), by Price Trend Analysis 2024 & 2032
                                                                                                120. Figure 120: Sri Lanka APAC Cashew Industry Volume (Kiloton), by Price Trend Analysis 2024 & 2032
                                                                                                121. Figure 121: Sri Lanka APAC Cashew Industry Revenue Share (%), by Price Trend Analysis 2024 & 2032
                                                                                                122. Figure 122: Sri Lanka APAC Cashew Industry Volume Share (%), by Price Trend Analysis 2024 & 2032
                                                                                                123. Figure 123: Sri Lanka APAC Cashew Industry Revenue (Million), by Country 2024 & 2032
                                                                                                124. Figure 124: Sri Lanka APAC Cashew Industry Volume (Kiloton), by Country 2024 & 2032
                                                                                                125. Figure 125: Sri Lanka APAC Cashew Industry Revenue Share (%), by Country 2024 & 2032
                                                                                                126. Figure 126: Sri Lanka APAC Cashew Industry Volume Share (%), by Country 2024 & 2032
                                                                                                127. Figure 127: Japan APAC Cashew Industry Revenue (Million), by Production Analysis 2024 & 2032
                                                                                                128. Figure 128: Japan APAC Cashew Industry Volume (Kiloton), by Production Analysis 2024 & 2032
                                                                                                129. Figure 129: Japan APAC Cashew Industry Revenue Share (%), by Production Analysis 2024 & 2032
                                                                                                130. Figure 130: Japan APAC Cashew Industry Volume Share (%), by Production Analysis 2024 & 2032
                                                                                                131. Figure 131: Japan APAC Cashew Industry Revenue (Million), by Consumption Analysis 2024 & 2032
                                                                                                132. Figure 132: Japan APAC Cashew Industry Volume (Kiloton), by Consumption Analysis 2024 & 2032
                                                                                                133. Figure 133: Japan APAC Cashew Industry Revenue Share (%), by Consumption Analysis 2024 & 2032
                                                                                                134. Figure 134: Japan APAC Cashew Industry Volume Share (%), by Consumption Analysis 2024 & 2032
                                                                                                135. Figure 135: Japan APAC Cashew Industry Revenue (Million), by Import Market Analysis (Value & Volume) 2024 & 2032
                                                                                                136. Figure 136: Japan APAC Cashew Industry Volume (Kiloton), by Import Market Analysis (Value & Volume) 2024 & 2032
                                                                                                137. Figure 137: Japan APAC Cashew Industry Revenue Share (%), by Import Market Analysis (Value & Volume) 2024 & 2032
                                                                                                138. Figure 138: Japan APAC Cashew Industry Volume Share (%), by Import Market Analysis (Value & Volume) 2024 & 2032
                                                                                                139. Figure 139: Japan APAC Cashew Industry Revenue (Million), by Export Market Analysis (Value & Volume) 2024 & 2032
                                                                                                140. Figure 140: Japan APAC Cashew Industry Volume (Kiloton), by Export Market Analysis (Value & Volume) 2024 & 2032
                                                                                                141. Figure 141: Japan APAC Cashew Industry Revenue Share (%), by Export Market Analysis (Value & Volume) 2024 & 2032
                                                                                                142. Figure 142: Japan APAC Cashew Industry Volume Share (%), by Export Market Analysis (Value & Volume) 2024 & 2032
                                                                                                143. Figure 143: Japan APAC Cashew Industry Revenue (Million), by Price Trend Analysis 2024 & 2032
                                                                                                144. Figure 144: Japan APAC Cashew Industry Volume (Kiloton), by Price Trend Analysis 2024 & 2032
                                                                                                145. Figure 145: Japan APAC Cashew Industry Revenue Share (%), by Price Trend Analysis 2024 & 2032
                                                                                                146. Figure 146: Japan APAC Cashew Industry Volume Share (%), by Price Trend Analysis 2024 & 2032
                                                                                                147. Figure 147: Japan APAC Cashew Industry Revenue (Million), by Country 2024 & 2032
                                                                                                148. Figure 148: Japan APAC Cashew Industry Volume (Kiloton), by Country 2024 & 2032
                                                                                                149. Figure 149: Japan APAC Cashew Industry Revenue Share (%), by Country 2024 & 2032
                                                                                                150. Figure 150: Japan APAC Cashew Industry Volume Share (%), by Country 2024 & 2032
                                                                                                151. Figure 151: Philippines APAC Cashew Industry Revenue (Million), by Production Analysis 2024 & 2032
                                                                                                152. Figure 152: Philippines APAC Cashew Industry Volume (Kiloton), by Production Analysis 2024 & 2032
                                                                                                153. Figure 153: Philippines APAC Cashew Industry Revenue Share (%), by Production Analysis 2024 & 2032
                                                                                                154. Figure 154: Philippines APAC Cashew Industry Volume Share (%), by Production Analysis 2024 & 2032
                                                                                                155. Figure 155: Philippines APAC Cashew Industry Revenue (Million), by Consumption Analysis 2024 & 2032
                                                                                                156. Figure 156: Philippines APAC Cashew Industry Volume (Kiloton), by Consumption Analysis 2024 & 2032
                                                                                                157. Figure 157: Philippines APAC Cashew Industry Revenue Share (%), by Consumption Analysis 2024 & 2032
                                                                                                158. Figure 158: Philippines APAC Cashew Industry Volume Share (%), by Consumption Analysis 2024 & 2032
                                                                                                159. Figure 159: Philippines APAC Cashew Industry Revenue (Million), by Import Market Analysis (Value & Volume) 2024 & 2032
                                                                                                160. Figure 160: Philippines APAC Cashew Industry Volume (Kiloton), by Import Market Analysis (Value & Volume) 2024 & 2032
                                                                                                161. Figure 161: Philippines APAC Cashew Industry Revenue Share (%), by Import Market Analysis (Value & Volume) 2024 & 2032
                                                                                                162. Figure 162: Philippines APAC Cashew Industry Volume Share (%), by Import Market Analysis (Value & Volume) 2024 & 2032
                                                                                                163. Figure 163: Philippines APAC Cashew Industry Revenue (Million), by Export Market Analysis (Value & Volume) 2024 & 2032
                                                                                                164. Figure 164: Philippines APAC Cashew Industry Volume (Kiloton), by Export Market Analysis (Value & Volume) 2024 & 2032
                                                                                                165. Figure 165: Philippines APAC Cashew Industry Revenue Share (%), by Export Market Analysis (Value & Volume) 2024 & 2032
                                                                                                166. Figure 166: Philippines APAC Cashew Industry Volume Share (%), by Export Market Analysis (Value & Volume) 2024 & 2032
                                                                                                167. Figure 167: Philippines APAC Cashew Industry Revenue (Million), by Price Trend Analysis 2024 & 2032
                                                                                                168. Figure 168: Philippines APAC Cashew Industry Volume (Kiloton), by Price Trend Analysis 2024 & 2032
                                                                                                169. Figure 169: Philippines APAC Cashew Industry Revenue Share (%), by Price Trend Analysis 2024 & 2032
                                                                                                170. Figure 170: Philippines APAC Cashew Industry Volume Share (%), by Price Trend Analysis 2024 & 2032
                                                                                                171. Figure 171: Philippines APAC Cashew Industry Revenue (Million), by Country 2024 & 2032
                                                                                                172. Figure 172: Philippines APAC Cashew Industry Volume (Kiloton), by Country 2024 & 2032
                                                                                                173. Figure 173: Philippines APAC Cashew Industry Revenue Share (%), by Country 2024 & 2032
                                                                                                174. Figure 174: Philippines APAC Cashew Industry Volume Share (%), by Country 2024 & 2032

                                                                                                List of Tables

                                                                                                1. Table 1: Global APAC Cashew Industry Revenue Million Forecast, by Region 2019 & 2032
                                                                                                2. Table 2: Global APAC Cashew Industry Volume Kiloton Forecast, by Region 2019 & 2032
                                                                                                3. Table 3: Global APAC Cashew Industry Revenue Million Forecast, by Production Analysis 2019 & 2032
                                                                                                4. Table 4: Global APAC Cashew Industry Volume Kiloton Forecast, by Production Analysis 2019 & 2032
                                                                                                5. Table 5: Global APAC Cashew Industry Revenue Million Forecast, by Consumption Analysis 2019 & 2032
                                                                                                6. Table 6: Global APAC Cashew Industry Volume Kiloton Forecast, by Consumption Analysis 2019 & 2032
                                                                                                7. Table 7: Global APAC Cashew Industry Revenue Million Forecast, by Import Market Analysis (Value & Volume) 2019 & 2032
                                                                                                8. Table 8: Global APAC Cashew Industry Volume Kiloton Forecast, by Import Market Analysis (Value & Volume) 2019 & 2032
                                                                                                9. Table 9: Global APAC Cashew Industry Revenue Million Forecast, by Export Market Analysis (Value & Volume) 2019 & 2032
                                                                                                10. Table 10: Global APAC Cashew Industry Volume Kiloton Forecast, by Export Market Analysis (Value & Volume) 2019 & 2032
                                                                                                11. Table 11: Global APAC Cashew Industry Revenue Million Forecast, by Price Trend Analysis 2019 & 2032
                                                                                                12. Table 12: Global APAC Cashew Industry Volume Kiloton Forecast, by Price Trend Analysis 2019 & 2032
                                                                                                13. Table 13: Global APAC Cashew Industry Revenue Million Forecast, by Region 2019 & 2032
                                                                                                14. Table 14: Global APAC Cashew Industry Volume Kiloton Forecast, by Region 2019 & 2032
                                                                                                15. Table 15: Global APAC Cashew Industry Revenue Million Forecast, by Country 2019 & 2032
                                                                                                16. Table 16: Global APAC Cashew Industry Volume Kiloton Forecast, by Country 2019 & 2032
                                                                                                17. Table 17: China APAC Cashew Industry Revenue (Million) Forecast, by Application 2019 & 2032
                                                                                                18. Table 18: China APAC Cashew Industry Volume (Kiloton) Forecast, by Application 2019 & 2032
                                                                                                19. Table 19: Japan APAC Cashew Industry Revenue (Million) Forecast, by Application 2019 & 2032
                                                                                                20. Table 20: Japan APAC Cashew Industry Volume (Kiloton) Forecast, by Application 2019 & 2032
                                                                                                21. Table 21: India APAC Cashew Industry Revenue (Million) Forecast, by Application 2019 & 2032
                                                                                                22. Table 22: India APAC Cashew Industry Volume (Kiloton) Forecast, by Application 2019 & 2032
                                                                                                23. Table 23: South Korea APAC Cashew Industry Revenue (Million) Forecast, by Application 2019 & 2032
                                                                                                24. Table 24: South Korea APAC Cashew Industry Volume (Kiloton) Forecast, by Application 2019 & 2032
                                                                                                25. Table 25: Taiwan APAC Cashew Industry Revenue (Million) Forecast, by Application 2019 & 2032
                                                                                                26. Table 26: Taiwan APAC Cashew Industry Volume (Kiloton) Forecast, by Application 2019 & 2032
                                                                                                27. Table 27: Australia APAC Cashew Industry Revenue (Million) Forecast, by Application 2019 & 2032
                                                                                                28. Table 28: Australia APAC Cashew Industry Volume (Kiloton) Forecast, by Application 2019 & 2032
                                                                                                29. Table 29: Rest of Asia-Pacific APAC Cashew Industry Revenue (Million) Forecast, by Application 2019 & 2032
                                                                                                30. Table 30: Rest of Asia-Pacific APAC Cashew Industry Volume (Kiloton) Forecast, by Application 2019 & 2032
                                                                                                31. Table 31: Global APAC Cashew Industry Revenue Million Forecast, by Production Analysis 2019 & 2032
                                                                                                32. Table 32: Global APAC Cashew Industry Volume Kiloton Forecast, by Production Analysis 2019 & 2032
                                                                                                33. Table 33: Global APAC Cashew Industry Revenue Million Forecast, by Consumption Analysis 2019 & 2032
                                                                                                34. Table 34: Global APAC Cashew Industry Volume Kiloton Forecast, by Consumption Analysis 2019 & 2032
                                                                                                35. Table 35: Global APAC Cashew Industry Revenue Million Forecast, by Import Market Analysis (Value & Volume) 2019 & 2032
                                                                                                36. Table 36: Global APAC Cashew Industry Volume Kiloton Forecast, by Import Market Analysis (Value & Volume) 2019 & 2032
                                                                                                37. Table 37: Global APAC Cashew Industry Revenue Million Forecast, by Export Market Analysis (Value & Volume) 2019 & 2032
                                                                                                38. Table 38: Global APAC Cashew Industry Volume Kiloton Forecast, by Export Market Analysis (Value & Volume) 2019 & 2032
                                                                                                39. Table 39: Global APAC Cashew Industry Revenue Million Forecast, by Price Trend Analysis 2019 & 2032
                                                                                                40. Table 40: Global APAC Cashew Industry Volume Kiloton Forecast, by Price Trend Analysis 2019 & 2032
                                                                                                41. Table 41: Global APAC Cashew Industry Revenue Million Forecast, by Country 2019 & 2032
                                                                                                42. Table 42: Global APAC Cashew Industry Volume Kiloton Forecast, by Country 2019 & 2032
                                                                                                43. Table 43: Global APAC Cashew Industry Revenue Million Forecast, by Production Analysis 2019 & 2032
                                                                                                44. Table 44: Global APAC Cashew Industry Volume Kiloton Forecast, by Production Analysis 2019 & 2032
                                                                                                45. Table 45: Global APAC Cashew Industry Revenue Million Forecast, by Consumption Analysis 2019 & 2032
                                                                                                46. Table 46: Global APAC Cashew Industry Volume Kiloton Forecast, by Consumption Analysis 2019 & 2032
                                                                                                47. Table 47: Global APAC Cashew Industry Revenue Million Forecast, by Import Market Analysis (Value & Volume) 2019 & 2032
                                                                                                48. Table 48: Global APAC Cashew Industry Volume Kiloton Forecast, by Import Market Analysis (Value & Volume) 2019 & 2032
                                                                                                49. Table 49: Global APAC Cashew Industry Revenue Million Forecast, by Export Market Analysis (Value & Volume) 2019 & 2032
                                                                                                50. Table 50: Global APAC Cashew Industry Volume Kiloton Forecast, by Export Market Analysis (Value & Volume) 2019 & 2032
                                                                                                51. Table 51: Global APAC Cashew Industry Revenue Million Forecast, by Price Trend Analysis 2019 & 2032
                                                                                                52. Table 52: Global APAC Cashew Industry Volume Kiloton Forecast, by Price Trend Analysis 2019 & 2032
                                                                                                53. Table 53: Global APAC Cashew Industry Revenue Million Forecast, by Country 2019 & 2032
                                                                                                54. Table 54: Global APAC Cashew Industry Volume Kiloton Forecast, by Country 2019 & 2032
                                                                                                55. Table 55: Global APAC Cashew Industry Revenue Million Forecast, by Production Analysis 2019 & 2032
                                                                                                56. Table 56: Global APAC Cashew Industry Volume Kiloton Forecast, by Production Analysis 2019 & 2032
                                                                                                57. Table 57: Global APAC Cashew Industry Revenue Million Forecast, by Consumption Analysis 2019 & 2032
                                                                                                58. Table 58: Global APAC Cashew Industry Volume Kiloton Forecast, by Consumption Analysis 2019 & 2032
                                                                                                59. Table 59: Global APAC Cashew Industry Revenue Million Forecast, by Import Market Analysis (Value & Volume) 2019 & 2032
                                                                                                60. Table 60: Global APAC Cashew Industry Volume Kiloton Forecast, by Import Market Analysis (Value & Volume) 2019 & 2032
                                                                                                61. Table 61: Global APAC Cashew Industry Revenue Million Forecast, by Export Market Analysis (Value & Volume) 2019 & 2032
                                                                                                62. Table 62: Global APAC Cashew Industry Volume Kiloton Forecast, by Export Market Analysis (Value & Volume) 2019 & 2032
                                                                                                63. Table 63: Global APAC Cashew Industry Revenue Million Forecast, by Price Trend Analysis 2019 & 2032
                                                                                                64. Table 64: Global APAC Cashew Industry Volume Kiloton Forecast, by Price Trend Analysis 2019 & 2032
                                                                                                65. Table 65: Global APAC Cashew Industry Revenue Million Forecast, by Country 2019 & 2032
                                                                                                66. Table 66: Global APAC Cashew Industry Volume Kiloton Forecast, by Country 2019 & 2032
                                                                                                67. Table 67: Global APAC Cashew Industry Revenue Million Forecast, by Production Analysis 2019 & 2032
                                                                                                68. Table 68: Global APAC Cashew Industry Volume Kiloton Forecast, by Production Analysis 2019 & 2032
                                                                                                69. Table 69: Global APAC Cashew Industry Revenue Million Forecast, by Consumption Analysis 2019 & 2032
                                                                                                70. Table 70: Global APAC Cashew Industry Volume Kiloton Forecast, by Consumption Analysis 2019 & 2032
                                                                                                71. Table 71: Global APAC Cashew Industry Revenue Million Forecast, by Import Market Analysis (Value & Volume) 2019 & 2032
                                                                                                72. Table 72: Global APAC Cashew Industry Volume Kiloton Forecast, by Import Market Analysis (Value & Volume) 2019 & 2032
                                                                                                73. Table 73: Global APAC Cashew Industry Revenue Million Forecast, by Export Market Analysis (Value & Volume) 2019 & 2032
                                                                                                74. Table 74: Global APAC Cashew Industry Volume Kiloton Forecast, by Export Market Analysis (Value & Volume) 2019 & 2032
                                                                                                75. Table 75: Global APAC Cashew Industry Revenue Million Forecast, by Price Trend Analysis 2019 & 2032
                                                                                                76. Table 76: Global APAC Cashew Industry Volume Kiloton Forecast, by Price Trend Analysis 2019 & 2032
                                                                                                77. Table 77: Global APAC Cashew Industry Revenue Million Forecast, by Country 2019 & 2032
                                                                                                78. Table 78: Global APAC Cashew Industry Volume Kiloton Forecast, by Country 2019 & 2032
                                                                                                79. Table 79: Global APAC Cashew Industry Revenue Million Forecast, by Production Analysis 2019 & 2032
                                                                                                80. Table 80: Global APAC Cashew Industry Volume Kiloton Forecast, by Production Analysis 2019 & 2032
                                                                                                81. Table 81: Global APAC Cashew Industry Revenue Million Forecast, by Consumption Analysis 2019 & 2032
                                                                                                82. Table 82: Global APAC Cashew Industry Volume Kiloton Forecast, by Consumption Analysis 2019 & 2032
                                                                                                83. Table 83: Global APAC Cashew Industry Revenue Million Forecast, by Import Market Analysis (Value & Volume) 2019 & 2032
                                                                                                84. Table 84: Global APAC Cashew Industry Volume Kiloton Forecast, by Import Market Analysis (Value & Volume) 2019 & 2032
                                                                                                85. Table 85: Global APAC Cashew Industry Revenue Million Forecast, by Export Market Analysis (Value & Volume) 2019 & 2032
                                                                                                86. Table 86: Global APAC Cashew Industry Volume Kiloton Forecast, by Export Market Analysis (Value & Volume) 2019 & 2032
                                                                                                87. Table 87: Global APAC Cashew Industry Revenue Million Forecast, by Price Trend Analysis 2019 & 2032
                                                                                                88. Table 88: Global APAC Cashew Industry Volume Kiloton Forecast, by Price Trend Analysis 2019 & 2032
                                                                                                89. Table 89: Global APAC Cashew Industry Revenue Million Forecast, by Country 2019 & 2032
                                                                                                90. Table 90: Global APAC Cashew Industry Volume Kiloton Forecast, by Country 2019 & 2032
                                                                                                91. Table 91: Global APAC Cashew Industry Revenue Million Forecast, by Production Analysis 2019 & 2032
                                                                                                92. Table 92: Global APAC Cashew Industry Volume Kiloton Forecast, by Production Analysis 2019 & 2032
                                                                                                93. Table 93: Global APAC Cashew Industry Revenue Million Forecast, by Consumption Analysis 2019 & 2032
                                                                                                94. Table 94: Global APAC Cashew Industry Volume Kiloton Forecast, by Consumption Analysis 2019 & 2032
                                                                                                95. Table 95: Global APAC Cashew Industry Revenue Million Forecast, by Import Market Analysis (Value & Volume) 2019 & 2032
                                                                                                96. Table 96: Global APAC Cashew Industry Volume Kiloton Forecast, by Import Market Analysis (Value & Volume) 2019 & 2032
                                                                                                97. Table 97: Global APAC Cashew Industry Revenue Million Forecast, by Export Market Analysis (Value & Volume) 2019 & 2032
                                                                                                98. Table 98: Global APAC Cashew Industry Volume Kiloton Forecast, by Export Market Analysis (Value & Volume) 2019 & 2032
                                                                                                99. Table 99: Global APAC Cashew Industry Revenue Million Forecast, by Price Trend Analysis 2019 & 2032
                                                                                                100. Table 100: Global APAC Cashew Industry Volume Kiloton Forecast, by Price Trend Analysis 2019 & 2032
                                                                                                101. Table 101: Global APAC Cashew Industry Revenue Million Forecast, by Country 2019 & 2032
                                                                                                102. Table 102: Global APAC Cashew Industry Volume Kiloton Forecast, by Country 2019 & 2032
                                                                                                103. Table 103: Global APAC Cashew Industry Revenue Million Forecast, by Production Analysis 2019 & 2032
                                                                                                104. Table 104: Global APAC Cashew Industry Volume Kiloton Forecast, by Production Analysis 2019 & 2032
                                                                                                105. Table 105: Global APAC Cashew Industry Revenue Million Forecast, by Consumption Analysis 2019 & 2032
                                                                                                106. Table 106: Global APAC Cashew Industry Volume Kiloton Forecast, by Consumption Analysis 2019 & 2032
                                                                                                107. Table 107: Global APAC Cashew Industry Revenue Million Forecast, by Import Market Analysis (Value & Volume) 2019 & 2032
                                                                                                108. Table 108: Global APAC Cashew Industry Volume Kiloton Forecast, by Import Market Analysis (Value & Volume) 2019 & 2032
                                                                                                109. Table 109: Global APAC Cashew Industry Revenue Million Forecast, by Export Market Analysis (Value & Volume) 2019 & 2032
                                                                                                110. Table 110: Global APAC Cashew Industry Volume Kiloton Forecast, by Export Market Analysis (Value & Volume) 2019 & 2032
                                                                                                111. Table 111: Global APAC Cashew Industry Revenue Million Forecast, by Price Trend Analysis 2019 & 2032
                                                                                                112. Table 112: Global APAC Cashew Industry Volume Kiloton Forecast, by Price Trend Analysis 2019 & 2032
                                                                                                113. Table 113: Global APAC Cashew Industry Revenue Million Forecast, by Country 2019 & 2032
                                                                                                114. Table 114: Global APAC Cashew Industry Volume Kiloton Forecast, by Country 2019 & 2032


                                                                                                Frequently Asked Questions

                                                                                                1. What is the projected Compound Annual Growth Rate (CAGR) of the APAC Cashew Industry?

                                                                                                The projected CAGR is approximately 4.44%.

                                                                                                2. Which companies are prominent players in the APAC Cashew Industry?

                                                                                                Key companies in the market include Olam International, Nutreco, Vietnam Cashew Association , All India Cashew Processors and Exporters Association, Sime Darby Oils .

                                                                                                3. What are the main segments of the APAC Cashew Industry?

                                                                                                The market segments include Production Analysis, Consumption Analysis, Import Market Analysis (Value & Volume), Export Market Analysis (Value & Volume), Price Trend Analysis.

                                                                                                4. Can you provide details about the market size?

                                                                                                The market size is estimated to be USD 7.26 Million as of 2022.

                                                                                                5. What are some drivers contributing to market growth?

                                                                                                Rising Consumption of Cashew Nuts as a Healthy Snack; Increasing Government initiatives; Growing Cashew Nut Imports in The United States.

                                                                                                6. What are the notable trends driving market growth?

                                                                                                Increased Cashew Application in Food Industry to boost the Market.

                                                                                                7. Are there any restraints impacting market growth?

                                                                                                Hazardous Climatic Condition Hinders Cashew Production; Stringent Regulations Related To Food Quality Standards.

                                                                                                8. Can you provide examples of recent developments in the market?

                                                                                                January 2023: According to CRISIL (an Indian consulting firm offering ratings, analysis, risk, and policy advice) and a branch of S&P Global, the Indian cashew processing industry is driving demand for cashews, which extended beyond USD 300,000 million in 2022, an increase of 15% year-on-year growth in revenue.

                                                                                                9. What pricing options are available for accessing the report?

                                                                                                Pricing options include single-user, multi-user, and enterprise licenses priced at USD 4750, USD 5250, and USD 8750 respectively.

                                                                                                10. Is the market size provided in terms of value or volume?

                                                                                                The market size is provided in terms of value, measured in Million and volume, measured in Kiloton.

                                                                                                11. Are there any specific market keywords associated with the report?

                                                                                                Yes, the market keyword associated with the report is "APAC Cashew Industry," which aids in identifying and referencing the specific market segment covered.

                                                                                                12. How do I determine which pricing option suits my needs best?

                                                                                                The pricing options vary based on user requirements and access needs. Individual users may opt for single-user licenses, while businesses requiring broader access may choose multi-user or enterprise licenses for cost-effective access to the report.

                                                                                                13. Are there any additional resources or data provided in the APAC Cashew Industry report?

                                                                                                While the report offers comprehensive insights, it's advisable to review the specific contents or supplementary materials provided to ascertain if additional resources or data are available.

                                                                                                14. How can I stay updated on further developments or reports in the APAC Cashew Industry?

                                                                                                To stay informed about further developments, trends, and reports in the APAC Cashew Industry, consider subscribing to industry newsletters, following relevant companies and organizations, or regularly checking reputable industry news sources and publications.


                                                                                                Methodology

                                                                                                Step 1 - Identification of Relevant Samples Size from Population Database

                                                                                                Step Chart
                                                                                                Bar Chart
                                                                                                Method Chart

                                                                                                Step 2 - Approaches for Defining Global Market Size (Value, Volume* & Price*)

                                                                                                Approach Chart
                                                                                                Top-down and bottom-up approaches are used to validate the global market size and estimate the market size for manufactures, regional segments, product, and application.

                                                                                                Note*: In applicable scenarios

                                                                                                Step 3 - Data Sources

                                                                                                Primary Research

                                                                                                • Web Analytics
                                                                                                • Survey Reports
                                                                                                • Research Institute
                                                                                                • Latest Research Reports
                                                                                                • Opinion Leaders

                                                                                                Secondary Research

                                                                                                • Annual Reports
                                                                                                • White Paper
                                                                                                • Latest Press Release
                                                                                                • Industry Association
                                                                                                • Paid Database
                                                                                                • Investor Presentations
                                                                                                Analyst Chart

                                                                                                Step 4 - Data Triangulation

                                                                                                Involves using different sources of information in order to increase the validity of a study

                                                                                                These sources are likely to be stakeholders in a program - participants, other researchers, program staff, other community members, and so on.

                                                                                                Then we put all data in single framework & apply various statistical tools to find out the dynamic on the market.

                                                                                                During the analysis stage, feedback from the stakeholder groups would be compared to determine areas of agreement as well as areas of divergence

                                                                                                Additionally, after gathering mixed and scattered data from a wide range of sources, data is triangulated and correlated to come up with estimated figures which are further validated through primary mediums or industry experts, opinion leaders.

                                                                                                About Research Axiom

                                                                                                Research Axiom delivers in-depth market research, industry analysis, and consulting for pharmaceuticals, automotive, IT, and consumer goods. Our reports provide the clarity you need to make informed decisions and drive innovation.

                                                                                                Our team combines primary research, advanced analytics, and sector expertise to deliver actionable intelligence. We offer syndicated reports, custom research, and consulting services tailored to your business needs.

                                                                                                At Research Axiom, we are committed to quality, transparency, and client satisfaction. Every report is rigorously validated to ensure accuracy and relevance. Our global perspective and local expertise help you understand both the big picture and the finer details of your market.

                                                                                                Stay informed with Research Axiom. Subscribe to our newsletter for the latest updates and research highlights, and follow us on social media for real-time insights. Research Axiom – Turning Data into Business Advantage.

                                                                                                artwork spiralartwork spiralRelated Reports
                                                                                                artwork underline

                                                                                                Bio Organic Fertilizer Market Insightful Market Analysis: Trends and Opportunities 2025-2033

                                                                                                The global bio organic fertilizer market is booming, projected to reach [estimated 2033 value] by 2033 with a CAGR of 5.90%. Discover key market trends, drivers, restraints, and leading companies shaping this sustainable agriculture sector. Learn more about organic fertilizer types, applications, and regional market analysis.

                                                                                                July 2025
                                                                                                Base Year: 2024
                                                                                                No Of Pages: 150
                                                                                                Price: $4750

                                                                                                Exploring Saudi Arabia Agriculture Market’s Market Size Dynamics 2025-2033

                                                                                                Discover the booming Saudi Arabia agriculture market! Projected to reach \$28.3 billion by 2033 with a 5.2% CAGR, this report analyzes market size, key players (Carrefour, Lulu Group), regional trends, and growth drivers. Learn about opportunities and challenges in this dynamic sector.

                                                                                                July 2025
                                                                                                Base Year: 2024
                                                                                                No Of Pages: 197
                                                                                                Price: $3800

                                                                                                Lentil Industry Charting Growth Trajectories 2025-2033: Strategic Insights and Forecasts

                                                                                                Discover the booming lentil market! Explore key trends, regional insights, and leading companies driving growth in this $X billion industry (2025 estimate) projected to reach $X billion by 2033. Learn about the rising demand for whole, split, and dehulled lentils in dry, canned, and frozen forms. Get the complete market analysis now!

                                                                                                July 2025
                                                                                                Base Year: 2024
                                                                                                No Of Pages: 234
                                                                                                Price: $4750

                                                                                                USA Agricultural Irrigation Machinery Market Soars to XXX Million, witnessing a CAGR of XX during the forecast period 2025-2033

                                                                                                Discover the booming US agricultural irrigation machinery market! This in-depth analysis reveals key trends, growth drivers, and leading companies from 2025-2033. Learn about the impact of precision agriculture, water scarcity, and government initiatives on the market's future. Explore segments like drip, sprinkler, and pivot irrigation systems.

                                                                                                July 2025
                                                                                                Base Year: 2024
                                                                                                No Of Pages: 150
                                                                                                Price: $3800

                                                                                                South America Biological Organic Fertilizers Industry 2025 to Grow at XX CAGR with XXX Million Market Size: Analysis and Forecasts 2033

                                                                                                Discover the booming South American biological organic fertilizer market! Projected to reach [estimated 2033 value based on CAGR] by 2033, this market is driven by sustainable agriculture trends and growing demand for eco-friendly farming. Learn about key players, market segments (cereals, legumes, fruits & vegetables), and growth opportunities in Brazil, Argentina, and beyond.

                                                                                                July 2025
                                                                                                Base Year: 2024
                                                                                                No Of Pages: 150
                                                                                                Price: $4750

                                                                                                Exploring Barriers in North American Olives Market Market: Trends and Analysis 2025-2033

                                                                                                Discover the booming North American olives market! This comprehensive analysis reveals a $6.9B market with a 5.74% CAGR (2025-2033), driven by health trends & Mediterranean diet popularity. Explore market segmentation, key players (Napa Valley Olive Oil, Musco Family Olive Co., etc.), and future growth projections for olive oil, table olives, and more.

                                                                                                July 2025
                                                                                                Base Year: 2024
                                                                                                No Of Pages: 180
                                                                                                Price: $4750

                                                                                                Analyzing Competitor Moves: Iran Agricultural Sector Analysis Growth Outlook 2025-2033

                                                                                                Discover the growth opportunities and challenges within Iran's agricultural sector. This comprehensive analysis covers market size, CAGR, key drivers, trends, and regional variations across food crops, cash crops, fruits, vegetables, dairy, and fishery from 2019-2033. Gain valuable insights into this dynamic market.

                                                                                                July 2025
                                                                                                Base Year: 2024
                                                                                                No Of Pages: 150
                                                                                                Price: $3800

                                                                                                South America Agricultual Films Market Market’s Drivers and Challenges: Strategic Overview 2025-2033

                                                                                                Discover the booming South American agricultural films market! This in-depth analysis reveals a CAGR of 6.10% to 2033, driven by growing demand for modern farming techniques and food security. Explore key trends, leading companies (Dow, Agroflex, etc.), and regional insights for Brazil, Argentina, and beyond. Learn how this expanding market presents lucrative opportunities.

                                                                                                July 2025
                                                                                                Base Year: 2024
                                                                                                No Of Pages: 150
                                                                                                Price: $4750

                                                                                                Analyzing Coffee Trade Analysis Industry: Opportunities and Growth Patterns 2025-2033

                                                                                                Discover the latest insights into the booming global coffee trade market. This comprehensive analysis reveals key trends, growth drivers, and market segmentation for Arabica, Robusta, and various coffee processing methods. Explore regional market shares and leading companies like Starbucks & Nestlé. Project your business strategy with our 2025-2033 forecast.

                                                                                                July 2025
                                                                                                Base Year: 2024
                                                                                                No Of Pages: 150
                                                                                                Price: $4750

                                                                                                Kiwi Fruit Market Insightful Market Analysis: Trends and Opportunities 2025-2033

                                                                                                Discover the booming kiwi fruit market! This comprehensive analysis reveals a $1.89B market in 2025, projected to reach significant heights by 2033 with a 5.02% CAGR. Explore key drivers, regional trends, and leading companies shaping this dynamic industry.

                                                                                                July 2025
                                                                                                Base Year: 2024
                                                                                                No Of Pages: 180
                                                                                                Price: $4750

                                                                                                Africa Chia Seeds Industry: Growth Opportunities and Competitive Landscape Overview 2025-2033

                                                                                                Discover the booming Africa chia seeds market! Explore its $13.87M valuation (2025), 2.10% CAGR, key segments (organic, food & beverage, supplements), and leading companies. Learn about growth drivers, trends, and regional insights (South Africa, UAE) in this comprehensive market analysis.

                                                                                                July 2025
                                                                                                Base Year: 2024
                                                                                                No Of Pages: 180
                                                                                                Price: $4750

                                                                                                China Pesticide Industry Market Report: Strategic Insights

                                                                                                Discover the booming China pesticide market, projected to reach $XX million by 2025 and grow at a CAGR of 6.60% until 2033. Analyze key trends, leading companies (Bayer, Syngenta, UPL), and market segmentation (fungicides, herbicides, insecticides, etc.) impacting this dynamic sector.

                                                                                                July 2025
                                                                                                Base Year: 2024
                                                                                                No Of Pages: 197
                                                                                                Price: $3800

                                                                                                Global Metal Chelates Market Future-proof Strategies: Trends, Competitor Dynamics, and Opportunities 2025-2033

                                                                                                Discover the booming global metal chelates market! This comprehensive analysis reveals a CAGR of 10.20%, driven by surging demand for efficient micronutrient delivery in agriculture. Explore market size, segmentation (crop type, product type, application), key players, and regional trends for 2025-2033.

                                                                                                July 2025
                                                                                                Base Year: 2024
                                                                                                No Of Pages: 197
                                                                                                Price: $3800

                                                                                                Fresh Cherries Industry CAGR Trends: Growth Outlook 2025-2033

                                                                                                Discover the booming fresh cherries market! This in-depth analysis reveals key trends, drivers, and restraints, along with regional market share data and projections to 2033. Learn about leading companies and explore growth opportunities in this lucrative sector.

                                                                                                July 2025
                                                                                                Base Year: 2024
                                                                                                No Of Pages: 180
                                                                                                Price: $4750

                                                                                                North American Wheat Seed Treatment 2025 Market Trends and 2033 Forecasts: Exploring Growth Potential

                                                                                                Discover the booming North American wheat seed treatment market! Learn about key growth drivers, emerging trends, major players like Bayer and Syngenta, and the projected CAGR of 7.30% through 2033. Explore market segmentation by product type, application, and crop type in this comprehensive analysis.

                                                                                                July 2025
                                                                                                Base Year: 2024
                                                                                                No Of Pages: 197
                                                                                                Price: $3800

                                                                                                Fresh Peaches Market Market Analysis and Forecasts

                                                                                                Discover the thriving fresh peaches market! This in-depth analysis reveals a projected CAGR of 3.20% to 2033, driven by health trends and culinary innovation. Explore market segmentation, key players like Del Monte and Dole, and regional growth projections for North America, Europe, and Asia Pacific. Learn more about the opportunities and challenges shaping this dynamic industry.

                                                                                                July 2025
                                                                                                Base Year: 2024
                                                                                                No Of Pages: 234
                                                                                                Price: $4750

                                                                                                Thailand Vegetable Seed Market’s Role in Shaping Industry Trends 2025-2033

                                                                                                Discover the booming Thailand vegetable seed market! This comprehensive analysis reveals a CAGR of 5.20% through 2033, driven by rising demand, technological advancements, and government initiatives. Explore market segmentation, key players, and future trends in this lucrative sector.

                                                                                                July 2025
                                                                                                Base Year: 2024
                                                                                                No Of Pages: 150
                                                                                                Price: $3800

                                                                                                Strategic Growth Drivers for Asia-Pacific Irrigation Machinery Market Market

                                                                                                Discover the booming Asia-Pacific irrigation machinery market! This in-depth analysis reveals a CAGR of 6.20%, driven by water scarcity and rising agricultural demands. Explore market trends, key players (Rain Bird, Netafim, Jain Irrigation), and regional insights. Learn how precision irrigation, drip irrigation, and sprinkler systems are shaping the future of farming.

                                                                                                July 2025
                                                                                                Base Year: 2024
                                                                                                No Of Pages: 150
                                                                                                Price: $3800

                                                                                                Analyzing the Future of United States Forage Seed Market: Key Trends to 2033

                                                                                                Discover the booming US forage seed market! This in-depth analysis reveals key trends, growth drivers, and market size projections (2025-2033), impacting livestock feed, sustainable agriculture, and leading companies like DLF International Seeds and Allied Seed LLC. Explore regional market shares and future opportunities.

                                                                                                July 2025
                                                                                                Base Year: 2024
                                                                                                No Of Pages: 197
                                                                                                Price: $3800

                                                                                                Cameroon Grains Industry Charting Growth Trajectories: Analysis and Forecasts 2025-2033

                                                                                                Discover the booming Cameroon grains industry: a comprehensive market analysis revealing a 4.80% CAGR, key players like Sodecoton and CDC, and future growth opportunities. Explore market size, trends, and challenges in this vital sector.

                                                                                                July 2025
                                                                                                Base Year: 2024
                                                                                                No Of Pages: 180
                                                                                                Price: $3800

                                                                                                Business Address

                                                                                                Head Office

                                                                                                Office no. A 5010, fifth floor, Solitaire Business Hub, Near Phoenix mall, Pune, Maharashtra 411014

                                                                                                Contact Information

                                                                                                Craig Francis

                                                                                                Business Development Head

                                                                                                +17162654855

                                                                                                [email protected]

                                                                                                Connect With Us

                                                                                                Secure Payment Partners

                                                                                                payment image
                                                                                                RetailLogisticsPackagingAutomotiveHealthcareAgricultureEnergy & PowerFood & BeverageAerospace & DefenseChemicals & MaterialsHospitality and TourismAnimal Nutrition & WellnessConsumer Goods and ServicesReal Estate and ConstructionHome and Property ImprovementTechnology, Media and TelecomManufacturing Products and ServicesFinancial Services and Investment Intelligence

                                                                                                © 2025 All rights reserved


                                                                                                Privacy Policy
                                                                                                Terms and Conditions
                                                                                                FAQ
                                                                                                • Home
                                                                                                • About Us
                                                                                                • Industries
                                                                                                  • Aerospace & Defense
                                                                                                  • Agriculture
                                                                                                  • Animal Nutrition & Wellness
                                                                                                  • Automotive
                                                                                                  • Chemicals & Materials
                                                                                                  • Consumer Goods and Services
                                                                                                  • Energy & Power
                                                                                                  • Financial Services and Investment Intelligence
                                                                                                  • Food & Beverage
                                                                                                  • Home and Property Improvement
                                                                                                  • Hospitality and Tourism
                                                                                                  • Logistics
                                                                                                  • Manufacturing Products and Services
                                                                                                  • Packaging
                                                                                                  • Professional and Commercial Services
                                                                                                  • Real Estate and Construction
                                                                                                  • Retail
                                                                                                  • Technology, Media and Telecom
                                                                                                  • Healthcare
                                                                                                • Services
                                                                                                • Contact
                                                                                                Main Logo
                                                                                                • Home
                                                                                                • About Us
                                                                                                • Industries
                                                                                                  • Aerospace & Defense
                                                                                                  • Agriculture
                                                                                                  • Animal Nutrition & Wellness
                                                                                                  • Automotive
                                                                                                  • Chemicals & Materials
                                                                                                  • Consumer Goods and Services
                                                                                                  • Energy & Power
                                                                                                  • Financial Services and Investment Intelligence
                                                                                                  • Food & Beverage
                                                                                                  • Home and Property Improvement
                                                                                                  • Hospitality and Tourism
                                                                                                  • Logistics
                                                                                                  • Manufacturing Products and Services
                                                                                                  • Packaging
                                                                                                  • Professional and Commercial Services
                                                                                                  • Real Estate and Construction
                                                                                                  • Retail
                                                                                                  • Technology, Media and Telecom
                                                                                                  • Healthcare
                                                                                                • Services
                                                                                                • Contact
                                                                                                +17162654855
                                                                                                [email protected]

                                                                                                +17162654855

                                                                                                [email protected]