
Key Insights
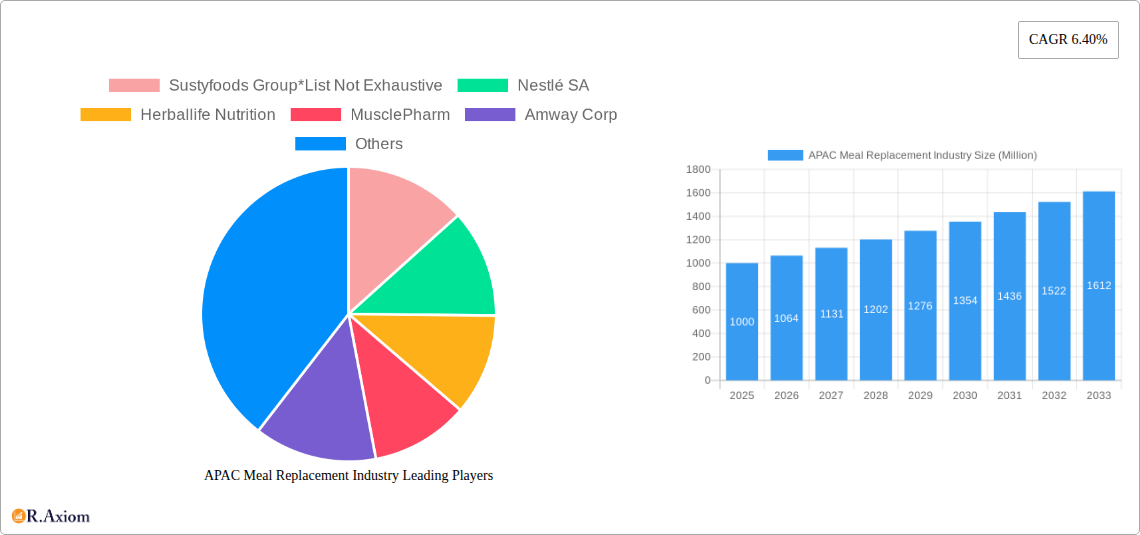
The Asia-Pacific (APAC) meal replacement market, valued at approximately $1,000 million in 2025 (estimated based on global market size and regional distribution), is projected to experience robust growth driven by several key factors. Rising health consciousness, increasing prevalence of busy lifestyles leading to less time for meal preparation, and a growing awareness of the convenience and nutritional benefits of meal replacements are all contributing to market expansion. The segment is further fueled by the increasing adoption of online retail channels, offering wider product accessibility and convenience to consumers. Ready-to-drink products and nutritional bars are expected to dominate the product type segment, capitalizing on consumer demand for portability and ease of consumption. However, challenges remain, including concerns about the long-term health effects of relying solely on meal replacements and the potential for misleading marketing claims. Addressing these concerns through transparent labeling and educational campaigns will be crucial for sustainable market growth.
Specific regional dynamics within APAC are noteworthy. Countries like China, India, and Japan, with their large and increasingly health-conscious populations, represent significant growth opportunities. However, variations in consumer preferences, purchasing power, and regulatory landscapes across the region necessitate tailored marketing and distribution strategies. The dominance of specific product types (e.g., ready-to-drink) might vary across these countries depending on cultural nuances and existing food habits. Furthermore, the competitive landscape is dynamic, with both international and regional players vying for market share. This necessitates strategic partnerships and product innovation to maintain a competitive edge. The ongoing expansion of e-commerce platforms in the region presents significant opportunities for businesses to reach broader consumer bases, yet necessitates robust logistics and customer service capabilities to overcome potential infrastructural limitations.
APAC Meal Replacement Industry: A Comprehensive Market Report (2019-2033)
This comprehensive report provides a detailed analysis of the Asia-Pacific (APAC) meal replacement industry, covering the period from 2019 to 2033. It offers in-depth insights into market dynamics, growth drivers, challenges, and opportunities, equipping stakeholders with actionable intelligence for strategic decision-making. The report segments the market by product type (Ready-to-Drink Products, Nutritional Bars, Powdered Supplements, Other Product Types) and distribution channel (Supermarkets/Hypermarkets, Convenience Stores, Specialty Stores, Online Retail Stores, Other Distribution Channels), offering granular analysis and projections for each segment. The base year for this report is 2025, with estimations for 2025 and forecasts extending to 2033. The historical period covered is 2019-2024. Key players analyzed include Sustyfoods Group, Nestlé SA, Herbalife Nutrition, MusclePharm, Amway Corp, Abbott Laboratories, Glanbia PLC, Danone SA, Formulite Pty Ltd, Bulk Nutrients, Sun Pharmaceutical Industries Limited, and WonderLab.
APAC Meal Replacement Industry Market Concentration & Innovation
The APAC meal replacement market exhibits a moderately concentrated structure, with a few multinational corporations holding significant market share. However, the presence of numerous smaller players and regional brands indicates a dynamic competitive landscape. Market concentration is further influenced by the varying degrees of regulatory frameworks across different APAC countries. Innovation is primarily driven by advancements in product formulation, incorporating functional ingredients, improved taste and texture profiles, and sustainable packaging solutions. The increasing demand for convenient and healthy food options fuels the development of innovative product formats, such as ready-to-drink meal replacements and functional bars. Mergers and acquisitions (M&A) activities play a crucial role in shaping market dynamics, with larger companies acquiring smaller players to expand their product portfolios and market reach. For example, while specific M&A deal values are unavailable for this report (xx Million), the trend indicates a growing number of acquisitions in the sector, particularly in the xx-xx Million range. Substitutes such as traditional meals or individual food components still pose a competitive threat, but the convenience factor and health-conscious appeal of meal replacements continue to drive market growth. End-user trends towards health and wellness, particularly among millennials and Gen Z, significantly shape demand.
APAC Meal Replacement Industry Industry Trends & Insights
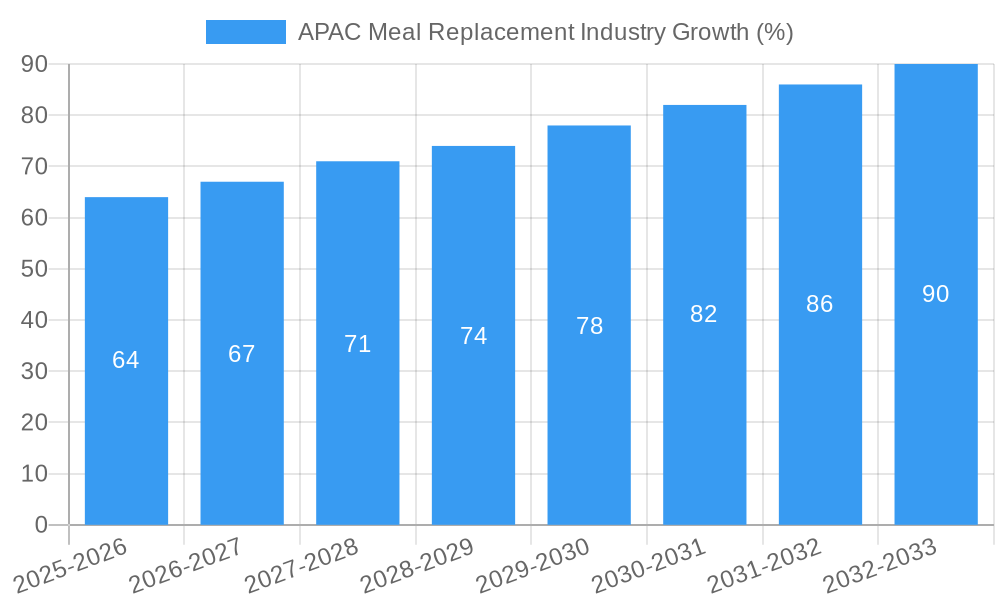
The APAC meal replacement market is experiencing robust growth, driven by factors such as increasing health consciousness, rising disposable incomes, and changing lifestyles. The market's Compound Annual Growth Rate (CAGR) during the forecast period (2025-2033) is estimated at xx%. This growth is particularly evident in urban areas, where a greater awareness of health and fitness exists. Technological disruptions, including the use of AI-powered personalized nutrition plans and advanced product formulation techniques, are revolutionizing the industry. Consumer preferences are shifting towards natural, organic, and plant-based meal replacements. Competitive dynamics are characterized by intense rivalry between established multinational companies and emerging local brands. Market penetration varies considerably across APAC countries, with developed economies like Australia and Japan showing higher penetration rates than less developed regions. The market is expected to reach approximately xx Million by 2033, a significant increase from the xx Million estimated for 2025.
Dominant Markets & Segments in APAC Meal Replacement Industry
Dominant Region: China is expected to be the leading market within the APAC region, driven by its large and rapidly growing consumer base, increasing health awareness, and expanding e-commerce sector.
Dominant Country: China's dominance in terms of market size is further strengthened by its substantial population and increasing urbanization, leading to greater consumer demand for convenience and health-focused products.
Dominant Product Type: Ready-to-drink products hold a significant market share due to their convenience and portability. Powdered supplements maintain a strong position due to affordability and variety of options.
Dominant Distribution Channel: Online retail stores are witnessing rapid growth, driven by increasing internet penetration and consumer preference for online shopping. Supermarkets/Hypermarkets remain a key distribution channel, particularly for established brands.
The growth in China is fueled by factors such as rising disposable incomes, expanding middle class, and increased awareness about healthy lifestyles. Strong economic growth and improvements in infrastructure have also significantly contributed to market expansion. India also presents a significant opportunity for growth due to its large population and increasing health consciousness.
APAC Meal Replacement Industry Product Developments
The APAC meal replacement market witnesses continuous product innovation, with manufacturers focusing on enhancing taste, texture, and nutritional value. Technological advancements, such as the use of advanced protein sources and functional ingredients, are driving the development of products with enhanced health benefits. Many companies are also introducing customized meal replacement plans tailored to specific dietary requirements and fitness goals. This focus on personalization and meeting diverse consumer needs is critical for achieving sustained growth in the competitive market. The emphasis on natural and organic ingredients is also gaining traction, further responding to the shifting consumer preferences.
Report Scope & Segmentation Analysis
This report provides a comprehensive segmentation analysis of the APAC meal replacement market.
Product Type: The market is segmented by Ready-to-Drink Products (xx Million, xx% CAGR), Nutritional Bars (xx Million, xx% CAGR), Powdered Supplements (xx Million, xx% CAGR), and Other Product Types (xx Million, xx% CAGR). Each segment's competitive landscape is unique, with differing degrees of brand concentration and innovation levels.
Distribution Channel: The market is segmented by Supermarkets/Hypermarkets (xx Million, xx% CAGR), Convenience Stores (xx Million, xx% CAGR), Specialty Stores (xx Million, xx% CAGR), Online Retail Stores (xx Million, xx% CAGR), and Other Distribution Channels (xx Million, xx% CAGR). Online channels are showing the most rapid growth, challenging traditional retail outlets.
Key Drivers of APAC Meal Replacement Industry Growth
The growth of the APAC meal replacement industry is fueled by several key factors: the increasing prevalence of health-conscious lifestyles, coupled with rising disposable incomes and busy schedules, is driving demand for convenient, nutritious alternatives to traditional meals. Technological advancements in product formulation and personalization contribute to enhanced consumer appeal. Furthermore, supportive government policies promoting healthy eating and active lifestyles create a favorable environment for market expansion.
Challenges in the APAP Meal Replacement Industry Sector
The APAC meal replacement industry faces various challenges, including stringent regulatory requirements across different countries, leading to compliance complexities and higher production costs. Supply chain disruptions and fluctuating raw material prices impact profitability and product availability. Furthermore, intense competition among established players and the emergence of new entrants create significant pressure on pricing and market share. These combined factors contribute to lower profit margins and necessitate continuous innovation for market differentiation.
Emerging Opportunities in APAP Meal Replacement Industry
Significant opportunities exist within the APAC meal replacement market. Expansion into underserved rural markets with increasing access to information and rising health awareness presents a considerable potential. The development of personalized nutrition plans using AI and big data offers opportunities for targeted marketing and product customization. Moreover, sustainable and eco-friendly packaging solutions will attract environmentally conscious consumers and enhance brand appeal. Growth is also projected in specialized meal replacement products designed for specific health conditions.
Leading Players in the APAC Meal Replacement Industry Market
- Sustyfoods Group
- Nestlé SA
- Herbalife Nutrition
- MusclePharm
- Amway Corp
- Abbott Laboratories
- Glanbia PLC
- Danone SA
- Formulite Pty Ltd
- Bulk Nutrients
- Sun Pharmaceutical Industries Limited
- WonderLab
Key Developments in APAC Meal Replacement Industry Industry
- May 2022: Holland & Barrett partnered with Huelto to launch a range of vegan meal replacement shakes (Nu26), highlighting the growing demand for plant-based options.
- May 2022: WonderLab launched a collagen healthy meal replacement milkshake in China via WeChat, showcasing the potential of digital channels in this market.
- January 2023: Herbalife Nutrition India's sponsorship of cricketer Smriti Mandhana demonstrates the effectiveness of celebrity endorsements in driving brand awareness and sales. Their 100+ sponsorship agreements further strengthen their market positioning.
Strategic Outlook for APAC Meal Replacement Industry Market
The APAC meal replacement market is poised for significant growth, driven by favorable demographic trends, increased health awareness, and technological advancements. Future opportunities lie in personalized nutrition, sustainable products, and expansion into newer markets. Companies that successfully innovate and adapt to changing consumer preferences will be well-positioned to capture significant market share in the years to come. The continued rise in health-conscious consumers across diverse demographics will provide sustained growth potential.
APAC Meal Replacement Industry Segmentation
-
1. Product Type
- 1.1. Ready-to-Drink Products
- 1.2. Nutritional Bars
- 1.3. Powdered Supplements
- 1.4. Other Product Types
-
2. Distribution Channel
- 2.1. Supermarkets/Hypermarkets
- 2.2. Convenience Stores
- 2.3. Specialty Stores
- 2.4. Online Retail Stores
- 2.5. Other Distribution Channels
-
3. Geography
- 3.1. China
- 3.2. Japan
- 3.3. India
- 3.4. Australia
- 3.5. Rest of Asia-Pacific
APAC Meal Replacement Industry Segmentation By Geography
- 1. China
- 2. Japan
- 3. India
- 4. Australia
- 5. Rest of Asia Pacific
APAC Meal Replacement Industry REPORT HIGHLIGHTS
| Aspects | Details |
|---|---|
| Study Period | 2019-2033 |
| Base Year | 2024 |
| Estimated Year | 2025 |
| Forecast Period | 2025-2033 |
| Historical Period | 2019-2024 |
| Growth Rate | CAGR of 6.40% from 2019-2033 |
| Segmentation |
|
Table of Contents
- 1. Introduction
- 1.1. Research Scope
- 1.2. Market Segmentation
- 1.3. Research Methodology
- 1.4. Definitions and Assumptions
- 2. Executive Summary
- 2.1. Introduction
- 3. Market Dynamics
- 3.1. Introduction
- 3.2. Market Drivers
- 3.2.1. Consumers Managing Special Diets Strive on Meal Replacements; Rising Demand for Convenient and Small-Portion Meal
- 3.3. Market Restrains
- 3.3.1. Highly Priced Meal Replacement Products to Hamper Market Growth
- 3.4. Market Trends
- 3.4.1. Consumers Managing Special Diets Strive on Meal Replacements
- 4. Market Factor Analysis
- 4.1. Porters Five Forces
- 4.2. Supply/Value Chain
- 4.3. PESTEL analysis
- 4.4. Market Entropy
- 4.5. Patent/Trademark Analysis
- 5. Global APAC Meal Replacement Industry Analysis, Insights and Forecast, 2019-2031
- 5.1. Market Analysis, Insights and Forecast - by Product Type
- 5.1.1. Ready-to-Drink Products
- 5.1.2. Nutritional Bars
- 5.1.3. Powdered Supplements
- 5.1.4. Other Product Types
- 5.2. Market Analysis, Insights and Forecast - by Distribution Channel
- 5.2.1. Supermarkets/Hypermarkets
- 5.2.2. Convenience Stores
- 5.2.3. Specialty Stores
- 5.2.4. Online Retail Stores
- 5.2.5. Other Distribution Channels
- 5.3. Market Analysis, Insights and Forecast - by Geography
- 5.3.1. China
- 5.3.2. Japan
- 5.3.3. India
- 5.3.4. Australia
- 5.3.5. Rest of Asia-Pacific
- 5.4. Market Analysis, Insights and Forecast - by Region
- 5.4.1. China
- 5.4.2. Japan
- 5.4.3. India
- 5.4.4. Australia
- 5.4.5. Rest of Asia Pacific
- 5.1. Market Analysis, Insights and Forecast - by Product Type
- 6. China APAC Meal Replacement Industry Analysis, Insights and Forecast, 2019-2031
- 6.1. Market Analysis, Insights and Forecast - by Product Type
- 6.1.1. Ready-to-Drink Products
- 6.1.2. Nutritional Bars
- 6.1.3. Powdered Supplements
- 6.1.4. Other Product Types
- 6.2. Market Analysis, Insights and Forecast - by Distribution Channel
- 6.2.1. Supermarkets/Hypermarkets
- 6.2.2. Convenience Stores
- 6.2.3. Specialty Stores
- 6.2.4. Online Retail Stores
- 6.2.5. Other Distribution Channels
- 6.3. Market Analysis, Insights and Forecast - by Geography
- 6.3.1. China
- 6.3.2. Japan
- 6.3.3. India
- 6.3.4. Australia
- 6.3.5. Rest of Asia-Pacific
- 6.1. Market Analysis, Insights and Forecast - by Product Type
- 7. Japan APAC Meal Replacement Industry Analysis, Insights and Forecast, 2019-2031
- 7.1. Market Analysis, Insights and Forecast - by Product Type
- 7.1.1. Ready-to-Drink Products
- 7.1.2. Nutritional Bars
- 7.1.3. Powdered Supplements
- 7.1.4. Other Product Types
- 7.2. Market Analysis, Insights and Forecast - by Distribution Channel
- 7.2.1. Supermarkets/Hypermarkets
- 7.2.2. Convenience Stores
- 7.2.3. Specialty Stores
- 7.2.4. Online Retail Stores
- 7.2.5. Other Distribution Channels
- 7.3. Market Analysis, Insights and Forecast - by Geography
- 7.3.1. China
- 7.3.2. Japan
- 7.3.3. India
- 7.3.4. Australia
- 7.3.5. Rest of Asia-Pacific
- 7.1. Market Analysis, Insights and Forecast - by Product Type
- 8. India APAC Meal Replacement Industry Analysis, Insights and Forecast, 2019-2031
- 8.1. Market Analysis, Insights and Forecast - by Product Type
- 8.1.1. Ready-to-Drink Products
- 8.1.2. Nutritional Bars
- 8.1.3. Powdered Supplements
- 8.1.4. Other Product Types
- 8.2. Market Analysis, Insights and Forecast - by Distribution Channel
- 8.2.1. Supermarkets/Hypermarkets
- 8.2.2. Convenience Stores
- 8.2.3. Specialty Stores
- 8.2.4. Online Retail Stores
- 8.2.5. Other Distribution Channels
- 8.3. Market Analysis, Insights and Forecast - by Geography
- 8.3.1. China
- 8.3.2. Japan
- 8.3.3. India
- 8.3.4. Australia
- 8.3.5. Rest of Asia-Pacific
- 8.1. Market Analysis, Insights and Forecast - by Product Type
- 9. Australia APAC Meal Replacement Industry Analysis, Insights and Forecast, 2019-2031
- 9.1. Market Analysis, Insights and Forecast - by Product Type
- 9.1.1. Ready-to-Drink Products
- 9.1.2. Nutritional Bars
- 9.1.3. Powdered Supplements
- 9.1.4. Other Product Types
- 9.2. Market Analysis, Insights and Forecast - by Distribution Channel
- 9.2.1. Supermarkets/Hypermarkets
- 9.2.2. Convenience Stores
- 9.2.3. Specialty Stores
- 9.2.4. Online Retail Stores
- 9.2.5. Other Distribution Channels
- 9.3. Market Analysis, Insights and Forecast - by Geography
- 9.3.1. China
- 9.3.2. Japan
- 9.3.3. India
- 9.3.4. Australia
- 9.3.5. Rest of Asia-Pacific
- 9.1. Market Analysis, Insights and Forecast - by Product Type
- 10. Rest of Asia Pacific APAC Meal Replacement Industry Analysis, Insights and Forecast, 2019-2031
- 10.1. Market Analysis, Insights and Forecast - by Product Type
- 10.1.1. Ready-to-Drink Products
- 10.1.2. Nutritional Bars
- 10.1.3. Powdered Supplements
- 10.1.4. Other Product Types
- 10.2. Market Analysis, Insights and Forecast - by Distribution Channel
- 10.2.1. Supermarkets/Hypermarkets
- 10.2.2. Convenience Stores
- 10.2.3. Specialty Stores
- 10.2.4. Online Retail Stores
- 10.2.5. Other Distribution Channels
- 10.3. Market Analysis, Insights and Forecast - by Geography
- 10.3.1. China
- 10.3.2. Japan
- 10.3.3. India
- 10.3.4. Australia
- 10.3.5. Rest of Asia-Pacific
- 10.1. Market Analysis, Insights and Forecast - by Product Type
- 11. North America APAC Meal Replacement Industry Analysis, Insights and Forecast, 2019-2031
- 11.1. Market Analysis, Insights and Forecast - By Country/Sub-region
- 11.1.1 United States
- 11.1.2 Canada
- 11.1.3 Mexico
- 12. Europe APAC Meal Replacement Industry Analysis, Insights and Forecast, 2019-2031
- 12.1. Market Analysis, Insights and Forecast - By Country/Sub-region
- 12.1.1 Germany
- 12.1.2 United Kingdom
- 12.1.3 France
- 12.1.4 Spain
- 12.1.5 Italy
- 12.1.6 Spain
- 12.1.7 Belgium
- 12.1.8 Netherland
- 12.1.9 Nordics
- 12.1.10 Rest of Europe
- 13. Asia Pacific APAC Meal Replacement Industry Analysis, Insights and Forecast, 2019-2031
- 13.1. Market Analysis, Insights and Forecast - By Country/Sub-region
- 13.1.1 China
- 13.1.2 Japan
- 13.1.3 India
- 13.1.4 South Korea
- 13.1.5 Southeast Asia
- 13.1.6 Australia
- 13.1.7 Indonesia
- 13.1.8 Phillipes
- 13.1.9 Singapore
- 13.1.10 Thailandc
- 13.1.11 Rest of Asia Pacific
- 14. South America APAC Meal Replacement Industry Analysis, Insights and Forecast, 2019-2031
- 14.1. Market Analysis, Insights and Forecast - By Country/Sub-region
- 14.1.1 Brazil
- 14.1.2 Argentina
- 14.1.3 Rest of South America
- 15. Middle East & Africa APAC Meal Replacement Industry Analysis, Insights and Forecast, 2019-2031
- 15.1. Market Analysis, Insights and Forecast - By Country/Sub-region
- 15.1.1 UAE
- 15.1.2 South Africa
- 15.1.3 Saudi Arabia
- 15.1.4 Rest of MEA
- 16. Competitive Analysis
- 16.1. Global Market Share Analysis 2024
- 16.2. Company Profiles
- 16.2.1 Sustyfoods Group*List Not Exhaustive
- 16.2.1.1. Overview
- 16.2.1.2. Products
- 16.2.1.3. SWOT Analysis
- 16.2.1.4. Recent Developments
- 16.2.1.5. Financials (Based on Availability)
- 16.2.2 Nestlé SA
- 16.2.2.1. Overview
- 16.2.2.2. Products
- 16.2.2.3. SWOT Analysis
- 16.2.2.4. Recent Developments
- 16.2.2.5. Financials (Based on Availability)
- 16.2.3 Herballife Nutrition
- 16.2.3.1. Overview
- 16.2.3.2. Products
- 16.2.3.3. SWOT Analysis
- 16.2.3.4. Recent Developments
- 16.2.3.5. Financials (Based on Availability)
- 16.2.4 MusclePharm
- 16.2.4.1. Overview
- 16.2.4.2. Products
- 16.2.4.3. SWOT Analysis
- 16.2.4.4. Recent Developments
- 16.2.4.5. Financials (Based on Availability)
- 16.2.5 Amway Corp
- 16.2.5.1. Overview
- 16.2.5.2. Products
- 16.2.5.3. SWOT Analysis
- 16.2.5.4. Recent Developments
- 16.2.5.5. Financials (Based on Availability)
- 16.2.6 Abbott Laboratories
- 16.2.6.1. Overview
- 16.2.6.2. Products
- 16.2.6.3. SWOT Analysis
- 16.2.6.4. Recent Developments
- 16.2.6.5. Financials (Based on Availability)
- 16.2.7 Glanbia PLC
- 16.2.7.1. Overview
- 16.2.7.2. Products
- 16.2.7.3. SWOT Analysis
- 16.2.7.4. Recent Developments
- 16.2.7.5. Financials (Based on Availability)
- 16.2.8 Danone SA
- 16.2.8.1. Overview
- 16.2.8.2. Products
- 16.2.8.3. SWOT Analysis
- 16.2.8.4. Recent Developments
- 16.2.8.5. Financials (Based on Availability)
- 16.2.9 Formulite Pty Ltd
- 16.2.9.1. Overview
- 16.2.9.2. Products
- 16.2.9.3. SWOT Analysis
- 16.2.9.4. Recent Developments
- 16.2.9.5. Financials (Based on Availability)
- 16.2.10 Bulk Nutrients
- 16.2.10.1. Overview
- 16.2.10.2. Products
- 16.2.10.3. SWOT Analysis
- 16.2.10.4. Recent Developments
- 16.2.10.5. Financials (Based on Availability)
- 16.2.11 Sun Pharmaceutical Industries Limited
- 16.2.11.1. Overview
- 16.2.11.2. Products
- 16.2.11.3. SWOT Analysis
- 16.2.11.4. Recent Developments
- 16.2.11.5. Financials (Based on Availability)
- 16.2.12 WonderLab
- 16.2.12.1. Overview
- 16.2.12.2. Products
- 16.2.12.3. SWOT Analysis
- 16.2.12.4. Recent Developments
- 16.2.12.5. Financials (Based on Availability)
- 16.2.1 Sustyfoods Group*List Not Exhaustive
List of Figures
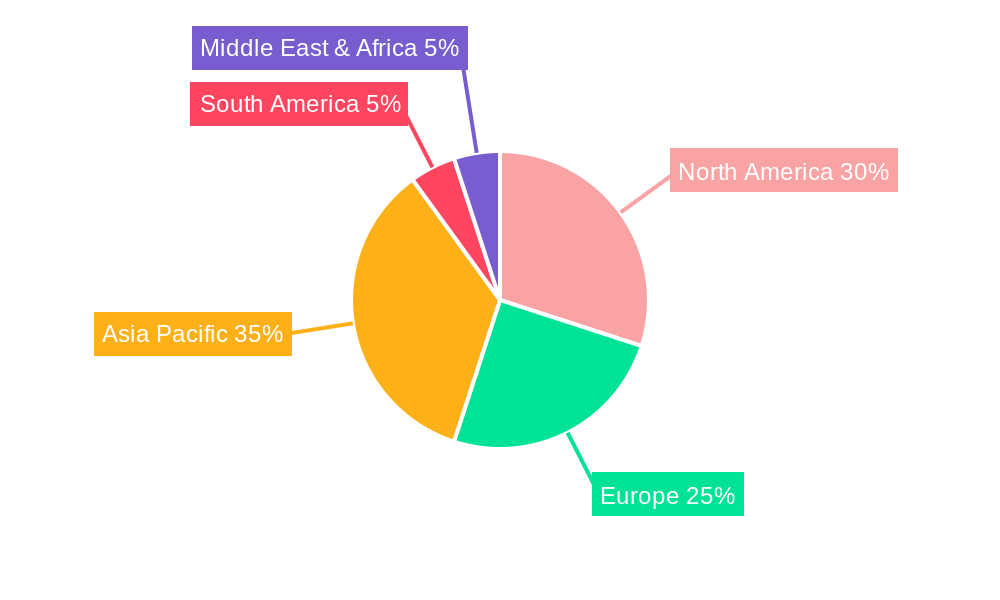
- Figure 1: Global APAC Meal Replacement Industry Revenue Breakdown (Million, %) by Region 2024 & 2032
- Figure 2: North America APAC Meal Replacement Industry Revenue (Million), by Country 2024 & 2032
- Figure 3: North America APAC Meal Replacement Industry Revenue Share (%), by Country 2024 & 2032
- Figure 4: Europe APAC Meal Replacement Industry Revenue (Million), by Country 2024 & 2032
- Figure 5: Europe APAC Meal Replacement Industry Revenue Share (%), by Country 2024 & 2032
- Figure 6: Asia Pacific APAC Meal Replacement Industry Revenue (Million), by Country 2024 & 2032
- Figure 7: Asia Pacific APAC Meal Replacement Industry Revenue Share (%), by Country 2024 & 2032
- Figure 8: South America APAC Meal Replacement Industry Revenue (Million), by Country 2024 & 2032
- Figure 9: South America APAC Meal Replacement Industry Revenue Share (%), by Country 2024 & 2032
- Figure 10: Middle East & Africa APAC Meal Replacement Industry Revenue (Million), by Country 2024 & 2032
- Figure 11: Middle East & Africa APAC Meal Replacement Industry Revenue Share (%), by Country 2024 & 2032
- Figure 12: China APAC Meal Replacement Industry Revenue (Million), by Product Type 2024 & 2032
- Figure 13: China APAC Meal Replacement Industry Revenue Share (%), by Product Type 2024 & 2032
- Figure 14: China APAC Meal Replacement Industry Revenue (Million), by Distribution Channel 2024 & 2032
- Figure 15: China APAC Meal Replacement Industry Revenue Share (%), by Distribution Channel 2024 & 2032
- Figure 16: China APAC Meal Replacement Industry Revenue (Million), by Geography 2024 & 2032
- Figure 17: China APAC Meal Replacement Industry Revenue Share (%), by Geography 2024 & 2032
- Figure 18: China APAC Meal Replacement Industry Revenue (Million), by Country 2024 & 2032
- Figure 19: China APAC Meal Replacement Industry Revenue Share (%), by Country 2024 & 2032
- Figure 20: Japan APAC Meal Replacement Industry Revenue (Million), by Product Type 2024 & 2032
- Figure 21: Japan APAC Meal Replacement Industry Revenue Share (%), by Product Type 2024 & 2032
- Figure 22: Japan APAC Meal Replacement Industry Revenue (Million), by Distribution Channel 2024 & 2032
- Figure 23: Japan APAC Meal Replacement Industry Revenue Share (%), by Distribution Channel 2024 & 2032
- Figure 24: Japan APAC Meal Replacement Industry Revenue (Million), by Geography 2024 & 2032
- Figure 25: Japan APAC Meal Replacement Industry Revenue Share (%), by Geography 2024 & 2032
- Figure 26: Japan APAC Meal Replacement Industry Revenue (Million), by Country 2024 & 2032
- Figure 27: Japan APAC Meal Replacement Industry Revenue Share (%), by Country 2024 & 2032
- Figure 28: India APAC Meal Replacement Industry Revenue (Million), by Product Type 2024 & 2032
- Figure 29: India APAC Meal Replacement Industry Revenue Share (%), by Product Type 2024 & 2032
- Figure 30: India APAC Meal Replacement Industry Revenue (Million), by Distribution Channel 2024 & 2032
- Figure 31: India APAC Meal Replacement Industry Revenue Share (%), by Distribution Channel 2024 & 2032
- Figure 32: India APAC Meal Replacement Industry Revenue (Million), by Geography 2024 & 2032
- Figure 33: India APAC Meal Replacement Industry Revenue Share (%), by Geography 2024 & 2032
- Figure 34: India APAC Meal Replacement Industry Revenue (Million), by Country 2024 & 2032
- Figure 35: India APAC Meal Replacement Industry Revenue Share (%), by Country 2024 & 2032
- Figure 36: Australia APAC Meal Replacement Industry Revenue (Million), by Product Type 2024 & 2032
- Figure 37: Australia APAC Meal Replacement Industry Revenue Share (%), by Product Type 2024 & 2032
- Figure 38: Australia APAC Meal Replacement Industry Revenue (Million), by Distribution Channel 2024 & 2032
- Figure 39: Australia APAC Meal Replacement Industry Revenue Share (%), by Distribution Channel 2024 & 2032
- Figure 40: Australia APAC Meal Replacement Industry Revenue (Million), by Geography 2024 & 2032
- Figure 41: Australia APAC Meal Replacement Industry Revenue Share (%), by Geography 2024 & 2032
- Figure 42: Australia APAC Meal Replacement Industry Revenue (Million), by Country 2024 & 2032
- Figure 43: Australia APAC Meal Replacement Industry Revenue Share (%), by Country 2024 & 2032
- Figure 44: Rest of Asia Pacific APAC Meal Replacement Industry Revenue (Million), by Product Type 2024 & 2032
- Figure 45: Rest of Asia Pacific APAC Meal Replacement Industry Revenue Share (%), by Product Type 2024 & 2032
- Figure 46: Rest of Asia Pacific APAC Meal Replacement Industry Revenue (Million), by Distribution Channel 2024 & 2032
- Figure 47: Rest of Asia Pacific APAC Meal Replacement Industry Revenue Share (%), by Distribution Channel 2024 & 2032
- Figure 48: Rest of Asia Pacific APAC Meal Replacement Industry Revenue (Million), by Geography 2024 & 2032
- Figure 49: Rest of Asia Pacific APAC Meal Replacement Industry Revenue Share (%), by Geography 2024 & 2032
- Figure 50: Rest of Asia Pacific APAC Meal Replacement Industry Revenue (Million), by Country 2024 & 2032
- Figure 51: Rest of Asia Pacific APAC Meal Replacement Industry Revenue Share (%), by Country 2024 & 2032
List of Tables
- Table 1: Global APAC Meal Replacement Industry Revenue Million Forecast, by Region 2019 & 2032
- Table 2: Global APAC Meal Replacement Industry Revenue Million Forecast, by Product Type 2019 & 2032
- Table 3: Global APAC Meal Replacement Industry Revenue Million Forecast, by Distribution Channel 2019 & 2032
- Table 4: Global APAC Meal Replacement Industry Revenue Million Forecast, by Geography 2019 & 2032
- Table 5: Global APAC Meal Replacement Industry Revenue Million Forecast, by Region 2019 & 2032
- Table 6: Global APAC Meal Replacement Industry Revenue Million Forecast, by Country 2019 & 2032
- Table 7: United States APAC Meal Replacement Industry Revenue (Million) Forecast, by Application 2019 & 2032
- Table 8: Canada APAC Meal Replacement Industry Revenue (Million) Forecast, by Application 2019 & 2032
- Table 9: Mexico APAC Meal Replacement Industry Revenue (Million) Forecast, by Application 2019 & 2032
- Table 10: Global APAC Meal Replacement Industry Revenue Million Forecast, by Country 2019 & 2032
- Table 11: Germany APAC Meal Replacement Industry Revenue (Million) Forecast, by Application 2019 & 2032
- Table 12: United Kingdom APAC Meal Replacement Industry Revenue (Million) Forecast, by Application 2019 & 2032
- Table 13: France APAC Meal Replacement Industry Revenue (Million) Forecast, by Application 2019 & 2032
- Table 14: Spain APAC Meal Replacement Industry Revenue (Million) Forecast, by Application 2019 & 2032
- Table 15: Italy APAC Meal Replacement Industry Revenue (Million) Forecast, by Application 2019 & 2032
- Table 16: Spain APAC Meal Replacement Industry Revenue (Million) Forecast, by Application 2019 & 2032
- Table 17: Belgium APAC Meal Replacement Industry Revenue (Million) Forecast, by Application 2019 & 2032
- Table 18: Netherland APAC Meal Replacement Industry Revenue (Million) Forecast, by Application 2019 & 2032
- Table 19: Nordics APAC Meal Replacement Industry Revenue (Million) Forecast, by Application 2019 & 2032
- Table 20: Rest of Europe APAC Meal Replacement Industry Revenue (Million) Forecast, by Application 2019 & 2032
- Table 21: Global APAC Meal Replacement Industry Revenue Million Forecast, by Country 2019 & 2032
- Table 22: China APAC Meal Replacement Industry Revenue (Million) Forecast, by Application 2019 & 2032
- Table 23: Japan APAC Meal Replacement Industry Revenue (Million) Forecast, by Application 2019 & 2032
- Table 24: India APAC Meal Replacement Industry Revenue (Million) Forecast, by Application 2019 & 2032
- Table 25: South Korea APAC Meal Replacement Industry Revenue (Million) Forecast, by Application 2019 & 2032
- Table 26: Southeast Asia APAC Meal Replacement Industry Revenue (Million) Forecast, by Application 2019 & 2032
- Table 27: Australia APAC Meal Replacement Industry Revenue (Million) Forecast, by Application 2019 & 2032
- Table 28: Indonesia APAC Meal Replacement Industry Revenue (Million) Forecast, by Application 2019 & 2032
- Table 29: Phillipes APAC Meal Replacement Industry Revenue (Million) Forecast, by Application 2019 & 2032
- Table 30: Singapore APAC Meal Replacement Industry Revenue (Million) Forecast, by Application 2019 & 2032
- Table 31: Thailandc APAC Meal Replacement Industry Revenue (Million) Forecast, by Application 2019 & 2032
- Table 32: Rest of Asia Pacific APAC Meal Replacement Industry Revenue (Million) Forecast, by Application 2019 & 2032
- Table 33: Global APAC Meal Replacement Industry Revenue Million Forecast, by Country 2019 & 2032
- Table 34: Brazil APAC Meal Replacement Industry Revenue (Million) Forecast, by Application 2019 & 2032
- Table 35: Argentina APAC Meal Replacement Industry Revenue (Million) Forecast, by Application 2019 & 2032
- Table 36: Rest of South America APAC Meal Replacement Industry Revenue (Million) Forecast, by Application 2019 & 2032
- Table 37: Global APAC Meal Replacement Industry Revenue Million Forecast, by Country 2019 & 2032
- Table 38: UAE APAC Meal Replacement Industry Revenue (Million) Forecast, by Application 2019 & 2032
- Table 39: South Africa APAC Meal Replacement Industry Revenue (Million) Forecast, by Application 2019 & 2032
- Table 40: Saudi Arabia APAC Meal Replacement Industry Revenue (Million) Forecast, by Application 2019 & 2032
- Table 41: Rest of MEA APAC Meal Replacement Industry Revenue (Million) Forecast, by Application 2019 & 2032
- Table 42: Global APAC Meal Replacement Industry Revenue Million Forecast, by Product Type 2019 & 2032
- Table 43: Global APAC Meal Replacement Industry Revenue Million Forecast, by Distribution Channel 2019 & 2032
- Table 44: Global APAC Meal Replacement Industry Revenue Million Forecast, by Geography 2019 & 2032
- Table 45: Global APAC Meal Replacement Industry Revenue Million Forecast, by Country 2019 & 2032
- Table 46: Global APAC Meal Replacement Industry Revenue Million Forecast, by Product Type 2019 & 2032
- Table 47: Global APAC Meal Replacement Industry Revenue Million Forecast, by Distribution Channel 2019 & 2032
- Table 48: Global APAC Meal Replacement Industry Revenue Million Forecast, by Geography 2019 & 2032
- Table 49: Global APAC Meal Replacement Industry Revenue Million Forecast, by Country 2019 & 2032
- Table 50: Global APAC Meal Replacement Industry Revenue Million Forecast, by Product Type 2019 & 2032
- Table 51: Global APAC Meal Replacement Industry Revenue Million Forecast, by Distribution Channel 2019 & 2032
- Table 52: Global APAC Meal Replacement Industry Revenue Million Forecast, by Geography 2019 & 2032
- Table 53: Global APAC Meal Replacement Industry Revenue Million Forecast, by Country 2019 & 2032
- Table 54: Global APAC Meal Replacement Industry Revenue Million Forecast, by Product Type 2019 & 2032
- Table 55: Global APAC Meal Replacement Industry Revenue Million Forecast, by Distribution Channel 2019 & 2032
- Table 56: Global APAC Meal Replacement Industry Revenue Million Forecast, by Geography 2019 & 2032
- Table 57: Global APAC Meal Replacement Industry Revenue Million Forecast, by Country 2019 & 2032
- Table 58: Global APAC Meal Replacement Industry Revenue Million Forecast, by Product Type 2019 & 2032
- Table 59: Global APAC Meal Replacement Industry Revenue Million Forecast, by Distribution Channel 2019 & 2032
- Table 60: Global APAC Meal Replacement Industry Revenue Million Forecast, by Geography 2019 & 2032
- Table 61: Global APAC Meal Replacement Industry Revenue Million Forecast, by Country 2019 & 2032
Frequently Asked Questions
1. What is the projected Compound Annual Growth Rate (CAGR) of the APAC Meal Replacement Industry?
The projected CAGR is approximately 6.40%.
2. Which companies are prominent players in the APAC Meal Replacement Industry?
Key companies in the market include Sustyfoods Group*List Not Exhaustive, Nestlé SA, Herballife Nutrition, MusclePharm, Amway Corp, Abbott Laboratories, Glanbia PLC, Danone SA, Formulite Pty Ltd, Bulk Nutrients, Sun Pharmaceutical Industries Limited, WonderLab.
3. What are the main segments of the APAC Meal Replacement Industry?
The market segments include Product Type, Distribution Channel, Geography.
4. Can you provide details about the market size?
The market size is estimated to be USD 3,731.26 Million as of 2022.
5. What are some drivers contributing to market growth?
Consumers Managing Special Diets Strive on Meal Replacements; Rising Demand for Convenient and Small-Portion Meal.
6. What are the notable trends driving market growth?
Consumers Managing Special Diets Strive on Meal Replacements.
7. Are there any restraints impacting market growth?
Highly Priced Meal Replacement Products to Hamper Market Growth.
8. Can you provide examples of recent developments in the market?
January 2023: As a "nutrition sponsor," Herbalife Nutrition India Private Limited collaborated with international women's cricketer Smriti Mandhana. Around 100 sponsorship agreements have been made by Herbalife Nutrition with different elite athletes, teams, and events.
9. What pricing options are available for accessing the report?
Pricing options include single-user, multi-user, and enterprise licenses priced at USD 4750, USD 5250, and USD 8750 respectively.
10. Is the market size provided in terms of value or volume?
The market size is provided in terms of value, measured in Million.
11. Are there any specific market keywords associated with the report?
Yes, the market keyword associated with the report is "APAC Meal Replacement Industry," which aids in identifying and referencing the specific market segment covered.
12. How do I determine which pricing option suits my needs best?
The pricing options vary based on user requirements and access needs. Individual users may opt for single-user licenses, while businesses requiring broader access may choose multi-user or enterprise licenses for cost-effective access to the report.
13. Are there any additional resources or data provided in the APAC Meal Replacement Industry report?
While the report offers comprehensive insights, it's advisable to review the specific contents or supplementary materials provided to ascertain if additional resources or data are available.
14. How can I stay updated on further developments or reports in the APAC Meal Replacement Industry?
To stay informed about further developments, trends, and reports in the APAC Meal Replacement Industry, consider subscribing to industry newsletters, following relevant companies and organizations, or regularly checking reputable industry news sources and publications.
Methodology
Step 1 - Identification of Relevant Samples Size from Population Database


Step 2 - Approaches for Defining Global Market Size (Value, Volume* & Price*)

Note*: In applicable scenarios
Step 3 - Data Sources
Primary Research
- Web Analytics
- Survey Reports
- Research Institute
- Latest Research Reports
- Opinion Leaders
Secondary Research
- Annual Reports
- White Paper
- Latest Press Release
- Industry Association
- Paid Database
- Investor Presentations

Step 4 - Data Triangulation
Involves using different sources of information in order to increase the validity of a study
These sources are likely to be stakeholders in a program - participants, other researchers, program staff, other community members, and so on.
Then we put all data in single framework & apply various statistical tools to find out the dynamic on the market.
During the analysis stage, feedback from the stakeholder groups would be compared to determine areas of agreement as well as areas of divergence


