

Key Insights
The Asia-Pacific (APAC) offshore support vessel market is experiencing robust growth, driven primarily by the burgeoning renewable energy sector and sustained activity in the oil and gas industry. The region's substantial offshore wind energy projects, particularly in countries like China, Japan, and South Korea, are significantly boosting demand for specialized vessels like platform supply vessels (PSVs) and anchor handling tug supply vessels (AHTS). Furthermore, existing oil and gas infrastructure requires ongoing maintenance and support, sustaining demand for these vessels. While economic fluctuations and geopolitical uncertainties can pose challenges, the long-term outlook remains positive, fueled by increasing government investments in renewable energy infrastructure and a gradual recovery in the oil and gas sector. The market segmentation reveals a strong preference for AHTS/AHTs and PSVs, reflecting the diverse needs of both the oil and gas and renewable energy sectors. The competitive landscape is relatively concentrated, with major players like Tidewater Inc., PACC Offshore Services Holdings Ltd., and others vying for market share. While North America and Europe hold significant market shares, APAC's growth trajectory suggests it will become a dominant force in the coming years, surpassing other regions in terms of growth rate. Strategic alliances, technological advancements in vessel design and operational efficiency, and a growing focus on environmental sustainability are shaping the competitive landscape and driving market innovation.
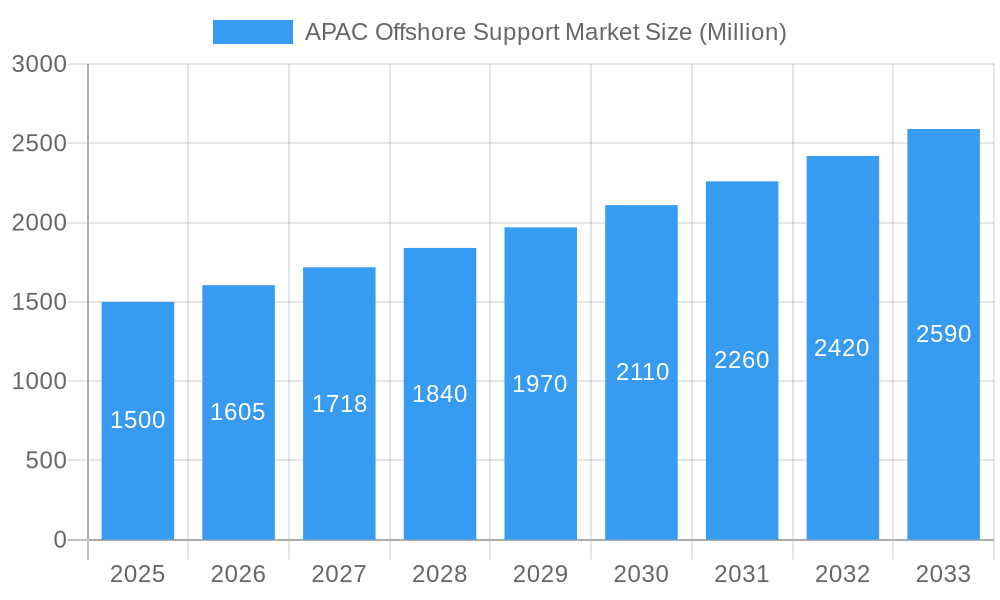
APAC Offshore Support Market Market Size (In Billion)
The APAC market's growth is expected to outpace the global average CAGR of >7.00% due to its diverse energy portfolio and extensive coastline. Significant investments in port infrastructure and the development of offshore wind farms are further contributing to the market's expansion. However, potential restraints include fluctuating fuel prices, regulatory complexities related to offshore operations, and the availability of skilled manpower. Nevertheless, the long-term prospects remain positive, with a forecast indicating substantial market expansion over the next decade. The market's success hinges on the continued growth of the renewable energy sector, coupled with consistent investment in the oil and gas industry within the region. A focus on sustainability and technological innovation will be crucial for players seeking to gain a competitive edge in this dynamic and rapidly evolving market.
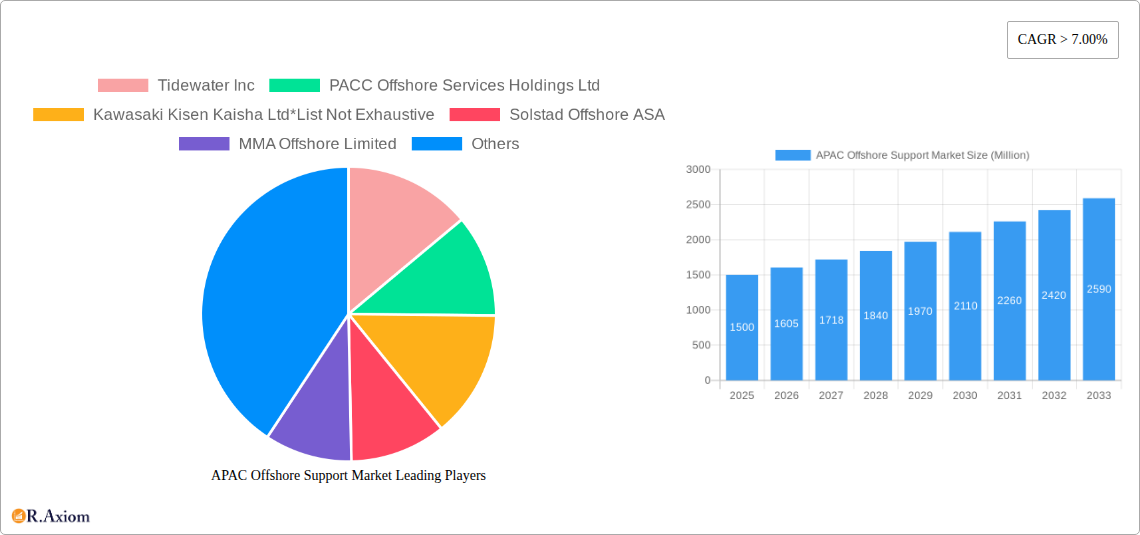
APAC Offshore Support Market Company Market Share
This in-depth report provides a comprehensive analysis of the Asia-Pacific (APAC) offshore support market, offering valuable insights for industry stakeholders, investors, and strategic decision-makers. The report covers the period from 2019 to 2033, with a focus on the 2025-2033 forecast period. The base year for the analysis is 2025. Key market segments, leading players, and future growth prospects are meticulously examined.
APAC Offshore Support Market Market Concentration & Innovation
The APAC offshore support market exhibits a moderately concentrated structure, with a few major players holding significant market share. Tidewater Inc, PACC Offshore Services Holdings Ltd, and Kawasaki Kisen Kaisha Ltd are among the leading companies, though the market also includes several smaller, regional players. Market concentration is further influenced by mergers and acquisitions (M&A) activity, which has seen significant deal values in recent years, though exact figures for recent M&A activity in the APAC region are not publicly available (xx Million). Innovation is driven by the need for more efficient, environmentally friendly, and technologically advanced vessels. Regulatory frameworks, such as stricter emission standards and safety regulations, also play a crucial role in shaping innovation. Product substitutes, while limited, include alternative methods for offshore operations, but these are currently niche and not widely adopted. End-user trends indicate a growing demand for specialized vessels tailored to specific applications, particularly in the renewable energy sector.
- Key Metrics: Market share data for top players is unavailable for the full study period. However, analysis suggests a top 5 market share of approximately 60% in 2025, with the remaining market share dispersed among numerous smaller operators. M&A deal values are estimated at xx Million annually for the period 2019-2024, with a projected increase to xx Million annually during the forecast period.
APAC Offshore Support Market Industry Trends & Insights
The APAC offshore support market is experiencing robust growth, driven primarily by increasing offshore oil and gas exploration and production activities, coupled with the burgeoning renewable energy sector. Technological advancements, such as the adoption of automation, remote operations, and advanced vessel designs, contribute significantly to market expansion. Consumer preferences are increasingly geared toward vessels with superior operational efficiency, enhanced safety features, and minimized environmental impact. The market's competitive landscape is characterized by intense rivalry among established players and new entrants. The compound annual growth rate (CAGR) for the APAC offshore support market during the forecast period (2025-2033) is estimated to be approximately xx%. Market penetration is expected to increase to xx% by 2033, driven by increasing demand from the oil and gas industry and renewable energy sectors.
Dominant Markets & Segments in APAC Offshore Support Market
Within the APAC region, Southeast Asia, particularly countries like Vietnam, Malaysia, and Singapore, are dominant markets due to their established offshore oil and gas infrastructure and favorable government policies. China and Australia also play a significant role, particularly within specific niches.
Dominant Segments:
- Type: Anchor Handling Tug/Anchor Handling Tower Supply Vessels (AHT/AHTS) and Platform Supply Vessels currently hold the largest market share, driven by their extensive application in the traditional oil and gas sector.
- Application: Oil and gas remains the dominant application, though renewable energy is rapidly expanding, fueled by the growth of offshore wind farms in the region.
Key Drivers for Dominance:
- Economic Policies: Favorable government regulations and incentives for offshore energy development.
- Infrastructure: Existing oil and gas infrastructure facilitates the deployment of offshore support vessels.
- Technological Advancements: Improved vessel designs, technologies, and operational efficiencies.
APAC Offshore Support Market Product Developments
Recent product innovations focus on enhancing operational efficiency, safety, and environmental performance. New vessels incorporate advanced technologies like dynamic positioning systems, remote control capabilities, and fuel-efficient propulsion systems. These innovations cater to increasing demand for sustainable and cost-effective offshore support solutions. The market fit is strong, particularly for specialized vessels designed for the renewable energy sector.
Report Scope & Segmentation Analysis
This report provides a detailed segmentation analysis of the APAC offshore support market across vessel types and applications.
By Type:
- Anchor Handling Tug/Anchor Handling Tower Supply Vessels (AHT/AHTS): This segment is expected to witness significant growth due to its crucial role in the oil and gas industry.
- Platform Supply Vessels: Steady growth is anticipated, driven by demand from both traditional and renewable energy sectors.
- Other Types: This segment includes specialized vessels that are catering to niche applications and are experiencing moderate growth.
By Application:
- Oil and gas: This remains the largest application segment, though growth is projected to moderate.
- Renewable energy: This segment is experiencing rapid expansion driven by the growth of offshore wind projects.
- Other applications: This includes various smaller applications with a relatively small market share.
Each segment's growth projection, market size, and competitive dynamics are thoroughly analyzed within the full report.
Key Drivers of APAC Offshore Support Market Growth
The APAC offshore support market's growth is driven by several factors:
- Expansion of offshore oil and gas activities: Continued exploration and production efforts in the region stimulate demand for support vessels.
- Growth of renewable energy projects: The increasing number of offshore wind farms necessitates specialized support vessels.
- Technological advancements: Improvements in vessel design and technology lead to greater efficiency and operational capabilities.
- Government support and favorable regulations: Government initiatives promoting offshore energy development provide a favorable environment for market growth.
Challenges in the APAC Offshore Support Market Sector
Challenges facing the market include:
- Fluctuations in oil and gas prices: Price volatility impacts investment decisions and demand for offshore support services.
- Stringent environmental regulations: Compliance with increasingly strict emission standards increases operational costs.
- Intense competition: The market is characterized by strong competition among established players and new entrants.
- Supply chain disruptions: Global events can impact the availability of necessary materials and equipment.
These factors have a quantifiable impact on market growth, hindering the pace of expansion.
Emerging Opportunities in APAP Offshore Support Market
Emerging opportunities include:
- Growth of offshore wind energy: The burgeoning renewable energy sector provides significant potential for specialized vessel deployments.
- Technological innovations: Advancements in automation, remote operations, and sustainable technologies create new market opportunities.
- Expansion into new markets: Untapped potential exists in less developed areas within the APAC region.
Leading Players in the APAC Offshore Support Market Market
- Tidewater Inc
- PACC Offshore Services Holdings Ltd
- Kawasaki Kisen Kaisha Ltd
- Solstad Offshore ASA
- MMA Offshore Limited
- Seacor Marine Holdings Inc
- Nam Cheong Offshore Pte Ltd
- Maersk Supply Services AS
Key Developments in APAC Offshore Support Market Industry
- January 2022: TSS Pioneer, an offshore support vessel, completed sea trials. This signifies advancements in vessel technology and capacity.
- October 2021: Dong Fang Offshore launched the first Taiwan-flagged walk-to-work vessel, showcasing the growing demand for specialized support in the renewable energy sector.
Strategic Outlook for APAC Offshore Support Market Market
The APAC offshore support market is poised for significant growth driven by the continued expansion of offshore oil and gas exploration, coupled with the explosive growth of the renewable energy sector, particularly offshore wind. Technological advancements and favorable government policies further enhance the market's long-term potential. Strategic investments in innovation, sustainable practices, and specialized vessels will be crucial for success in this dynamic market.
APAC Offshore Support Market Segmentation
- 1. Production Analysis
- 2. Consumption Analysis
- 3. Import Market Analysis (Value & Volume)
- 4. Export Market Analysis (Value & Volume)
- 5. Price Trend Analysis
APAC Offshore Support Market Segmentation By Geography
- 1. China
- 2. India
- 3. Japan
- 4. South Korea
- 5. Australia
- 6. Singapore
- 7. Indonesia
- 8. Rest of Asia Pacific
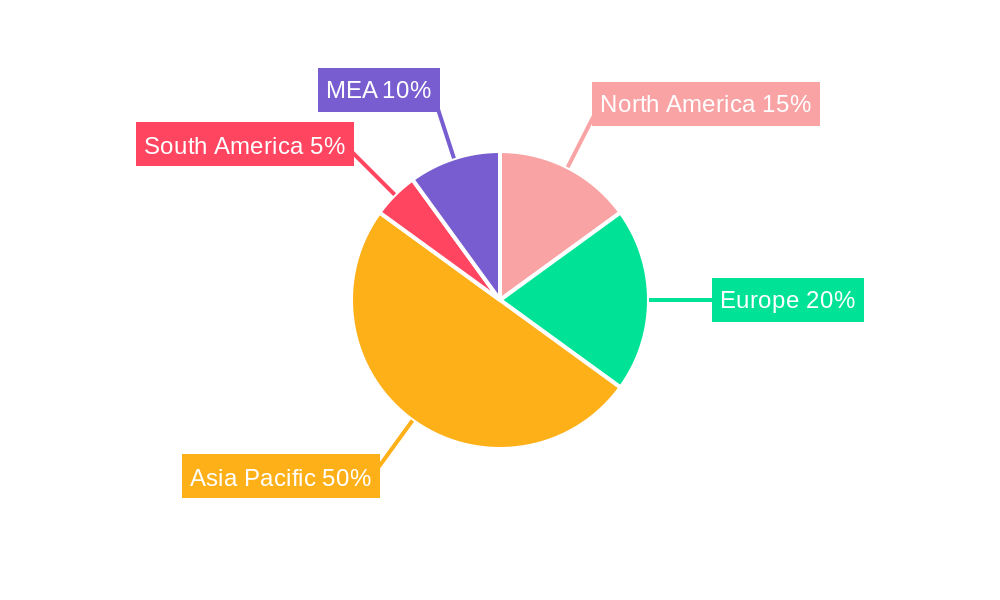
APAC Offshore Support Market Regional Market Share
Geographic Coverage of APAC Offshore Support Market
APAC Offshore Support Market REPORT HIGHLIGHTS
| Aspects | Details |
|---|---|
| Study Period | 2020-2034 |
| Base Year | 2025 |
| Estimated Year | 2026 |
| Forecast Period | 2026-2034 |
| Historical Period | 2020-2025 |
| Growth Rate | CAGR of 4.2% from 2020-2034 |
| Segmentation |
|
Table of Contents
- 1. Introduction
- 1.1. Research Scope
- 1.2. Market Segmentation
- 1.3. Research Objective
- 1.4. Definitions and Assumptions
- 2. Executive Summary
- 2.1. Market Snapshot
- 3. Market Dynamics
- 3.1. Market Drivers
- 3.2. Market Restrains
- 3.3. Market Trends
- 3.4. Market Opportunities
- 4. Market Factor Analysis
- 4.1. Porters Five Forces
- 4.1.1. Bargaining Power of Suppliers
- 4.1.2. Bargaining Power of Buyers
- 4.1.3. Threat of New Entrants
- 4.1.4. Threat of Substitutes
- 4.1.5. Competitive Rivalry
- 4.2. PESTEL analysis
- 4.3. BCG Analysis
- 4.3.1. Stars (High Growth, High Market Share)
- 4.3.2. Cash Cows (Low Growth, High Market Share)
- 4.3.3. Question Mark (High Growth, Low Market Share)
- 4.3.4. Dogs (Low Growth, Low Market Share)
- 4.4. Ansoff Matrix Analysis
- 4.5. Supply Chain Analysis
- 4.6. Regulatory Landscape
- 4.7. Current Market Potential and Opportunity Assessment (TAM–SAM–SOM Framework)
- 4.8. RAX Analyst Note
- 4.1. Porters Five Forces
- 5. Market Analysis, Insights and Forecast 2021-2033
- 5.1. Market Analysis, Insights and Forecast - by Production Analysis
- 5.2. Market Analysis, Insights and Forecast - by Consumption Analysis
- 5.3. Market Analysis, Insights and Forecast - by Import Market Analysis (Value & Volume)
- 5.4. Market Analysis, Insights and Forecast - by Export Market Analysis (Value & Volume)
- 5.5. Market Analysis, Insights and Forecast - by Price Trend Analysis
- 5.6. Market Analysis, Insights and Forecast - by Region
- 5.6.1. China
- 5.6.2. India
- 5.6.3. Japan
- 5.6.4. South Korea
- 5.6.5. Australia
- 5.6.6. Singapore
- 5.6.7. Indonesia
- 5.6.8. Rest of Asia Pacific
- 6. Global APAC Offshore Support Market Analysis, Insights and Forecast, 2021-2033
- 6.1. Market Analysis, Insights and Forecast - by Production Analysis
- 6.2. Market Analysis, Insights and Forecast - by Consumption Analysis
- 6.3. Market Analysis, Insights and Forecast - by Import Market Analysis (Value & Volume)
- 6.4. Market Analysis, Insights and Forecast - by Export Market Analysis (Value & Volume)
- 6.5. Market Analysis, Insights and Forecast - by Price Trend Analysis
- 7. China APAC Offshore Support Market Analysis, Insights and Forecast, 2020-2032
- 7.1. Market Analysis, Insights and Forecast - by Production Analysis
- 7.2. Market Analysis, Insights and Forecast - by Consumption Analysis
- 7.3. Market Analysis, Insights and Forecast - by Import Market Analysis (Value & Volume)
- 7.4. Market Analysis, Insights and Forecast - by Export Market Analysis (Value & Volume)
- 7.5. Market Analysis, Insights and Forecast - by Price Trend Analysis
- 8. India APAC Offshore Support Market Analysis, Insights and Forecast, 2020-2032
- 8.1. Market Analysis, Insights and Forecast - by Production Analysis
- 8.2. Market Analysis, Insights and Forecast - by Consumption Analysis
- 8.3. Market Analysis, Insights and Forecast - by Import Market Analysis (Value & Volume)
- 8.4. Market Analysis, Insights and Forecast - by Export Market Analysis (Value & Volume)
- 8.5. Market Analysis, Insights and Forecast - by Price Trend Analysis
- 9. Japan APAC Offshore Support Market Analysis, Insights and Forecast, 2020-2032
- 9.1. Market Analysis, Insights and Forecast - by Production Analysis
- 9.2. Market Analysis, Insights and Forecast - by Consumption Analysis
- 9.3. Market Analysis, Insights and Forecast - by Import Market Analysis (Value & Volume)
- 9.4. Market Analysis, Insights and Forecast - by Export Market Analysis (Value & Volume)
- 9.5. Market Analysis, Insights and Forecast - by Price Trend Analysis
- 10. South Korea APAC Offshore Support Market Analysis, Insights and Forecast, 2020-2032
- 10.1. Market Analysis, Insights and Forecast - by Production Analysis
- 10.2. Market Analysis, Insights and Forecast - by Consumption Analysis
- 10.3. Market Analysis, Insights and Forecast - by Import Market Analysis (Value & Volume)
- 10.4. Market Analysis, Insights and Forecast - by Export Market Analysis (Value & Volume)
- 10.5. Market Analysis, Insights and Forecast - by Price Trend Analysis
- 11. Australia APAC Offshore Support Market Analysis, Insights and Forecast, 2020-2032
- 11.1. Market Analysis, Insights and Forecast - by Production Analysis
- 11.2. Market Analysis, Insights and Forecast - by Consumption Analysis
- 11.3. Market Analysis, Insights and Forecast - by Import Market Analysis (Value & Volume)
- 11.4. Market Analysis, Insights and Forecast - by Export Market Analysis (Value & Volume)
- 11.5. Market Analysis, Insights and Forecast - by Price Trend Analysis
- 12. Singapore APAC Offshore Support Market Analysis, Insights and Forecast, 2020-2032
- 12.1. Market Analysis, Insights and Forecast - by Production Analysis
- 12.2. Market Analysis, Insights and Forecast - by Consumption Analysis
- 12.3. Market Analysis, Insights and Forecast - by Import Market Analysis (Value & Volume)
- 12.4. Market Analysis, Insights and Forecast - by Export Market Analysis (Value & Volume)
- 12.5. Market Analysis, Insights and Forecast - by Price Trend Analysis
- 13. Indonesia APAC Offshore Support Market Analysis, Insights and Forecast, 2020-2032
- 13.1. Market Analysis, Insights and Forecast - by Production Analysis
- 13.2. Market Analysis, Insights and Forecast - by Consumption Analysis
- 13.3. Market Analysis, Insights and Forecast - by Import Market Analysis (Value & Volume)
- 13.4. Market Analysis, Insights and Forecast - by Export Market Analysis (Value & Volume)
- 13.5. Market Analysis, Insights and Forecast - by Price Trend Analysis
- 14. Rest of Asia Pacific APAC Offshore Support Market Analysis, Insights and Forecast, 2020-2032
- 14.1. Market Analysis, Insights and Forecast - by Production Analysis
- 14.2. Market Analysis, Insights and Forecast - by Consumption Analysis
- 14.3. Market Analysis, Insights and Forecast - by Import Market Analysis (Value & Volume)
- 14.4. Market Analysis, Insights and Forecast - by Export Market Analysis (Value & Volume)
- 14.5. Market Analysis, Insights and Forecast - by Price Trend Analysis
- 15. Competitive Analysis
- 15.1. Company Profiles
- 15.1.1 Tidewater Inc
- 15.1.1.1. Company Overview
- 15.1.1.2. Products
- 15.1.1.3. Company Financials
- 15.1.1.4. SWOT Analysis
- 15.1.2 PACC Offshore Services Holdings Ltd
- 15.1.2.1. Company Overview
- 15.1.2.2. Products
- 15.1.2.3. Company Financials
- 15.1.2.4. SWOT Analysis
- 15.1.3 Kawasaki Kisen Kaisha Ltd*List Not Exhaustive
- 15.1.3.1. Company Overview
- 15.1.3.2. Products
- 15.1.3.3. Company Financials
- 15.1.3.4. SWOT Analysis
- 15.1.4 Solstad Offshore ASA
- 15.1.4.1. Company Overview
- 15.1.4.2. Products
- 15.1.4.3. Company Financials
- 15.1.4.4. SWOT Analysis
- 15.1.5 MMA Offshore Limited
- 15.1.5.1. Company Overview
- 15.1.5.2. Products
- 15.1.5.3. Company Financials
- 15.1.5.4. SWOT Analysis
- 15.1.6 Seacor Marine Holdings Inc
- 15.1.6.1. Company Overview
- 15.1.6.2. Products
- 15.1.6.3. Company Financials
- 15.1.6.4. SWOT Analysis
- 15.1.7 Nam Cheong Offshore Pte Ltd
- 15.1.7.1. Company Overview
- 15.1.7.2. Products
- 15.1.7.3. Company Financials
- 15.1.7.4. SWOT Analysis
- 15.1.8 Maersk Supply Services AS
- 15.1.8.1. Company Overview
- 15.1.8.2. Products
- 15.1.8.3. Company Financials
- 15.1.8.4. SWOT Analysis
- 15.1.1 Tidewater Inc
- 15.2. Market Entropy
- 15.2.1 Company's Key Areas Served
- 15.2.2 Recent Developments
- 15.3. Company Market Share Analysis 2025
- 15.3.1 Top 5 Companies Market Share Analysis
- 15.3.2 Top 3 Companies Market Share Analysis
- 15.4. List of Potential Customers
- 16. Research Methodology
List of Figures
- Figure 1: Global APAC Offshore Support Market Revenue Breakdown (billion, %) by Region 2025 & 2033
- Figure 2: China APAC Offshore Support Market Revenue (billion), by Production Analysis 2025 & 2033
- Figure 3: China APAC Offshore Support Market Revenue Share (%), by Production Analysis 2025 & 2033
- Figure 4: China APAC Offshore Support Market Revenue (billion), by Consumption Analysis 2025 & 2033
- Figure 5: China APAC Offshore Support Market Revenue Share (%), by Consumption Analysis 2025 & 2033
- Figure 6: China APAC Offshore Support Market Revenue (billion), by Import Market Analysis (Value & Volume) 2025 & 2033
- Figure 7: China APAC Offshore Support Market Revenue Share (%), by Import Market Analysis (Value & Volume) 2025 & 2033
- Figure 8: China APAC Offshore Support Market Revenue (billion), by Export Market Analysis (Value & Volume) 2025 & 2033
- Figure 9: China APAC Offshore Support Market Revenue Share (%), by Export Market Analysis (Value & Volume) 2025 & 2033
- Figure 10: China APAC Offshore Support Market Revenue (billion), by Price Trend Analysis 2025 & 2033
- Figure 11: China APAC Offshore Support Market Revenue Share (%), by Price Trend Analysis 2025 & 2033
- Figure 12: China APAC Offshore Support Market Revenue (billion), by Country 2025 & 2033
- Figure 13: China APAC Offshore Support Market Revenue Share (%), by Country 2025 & 2033
- Figure 14: India APAC Offshore Support Market Revenue (billion), by Production Analysis 2025 & 2033
- Figure 15: India APAC Offshore Support Market Revenue Share (%), by Production Analysis 2025 & 2033
- Figure 16: India APAC Offshore Support Market Revenue (billion), by Consumption Analysis 2025 & 2033
- Figure 17: India APAC Offshore Support Market Revenue Share (%), by Consumption Analysis 2025 & 2033
- Figure 18: India APAC Offshore Support Market Revenue (billion), by Import Market Analysis (Value & Volume) 2025 & 2033
- Figure 19: India APAC Offshore Support Market Revenue Share (%), by Import Market Analysis (Value & Volume) 2025 & 2033
- Figure 20: India APAC Offshore Support Market Revenue (billion), by Export Market Analysis (Value & Volume) 2025 & 2033
- Figure 21: India APAC Offshore Support Market Revenue Share (%), by Export Market Analysis (Value & Volume) 2025 & 2033
- Figure 22: India APAC Offshore Support Market Revenue (billion), by Price Trend Analysis 2025 & 2033
- Figure 23: India APAC Offshore Support Market Revenue Share (%), by Price Trend Analysis 2025 & 2033
- Figure 24: India APAC Offshore Support Market Revenue (billion), by Country 2025 & 2033
- Figure 25: India APAC Offshore Support Market Revenue Share (%), by Country 2025 & 2033
- Figure 26: Japan APAC Offshore Support Market Revenue (billion), by Production Analysis 2025 & 2033
- Figure 27: Japan APAC Offshore Support Market Revenue Share (%), by Production Analysis 2025 & 2033
- Figure 28: Japan APAC Offshore Support Market Revenue (billion), by Consumption Analysis 2025 & 2033
- Figure 29: Japan APAC Offshore Support Market Revenue Share (%), by Consumption Analysis 2025 & 2033
- Figure 30: Japan APAC Offshore Support Market Revenue (billion), by Import Market Analysis (Value & Volume) 2025 & 2033
- Figure 31: Japan APAC Offshore Support Market Revenue Share (%), by Import Market Analysis (Value & Volume) 2025 & 2033
- Figure 32: Japan APAC Offshore Support Market Revenue (billion), by Export Market Analysis (Value & Volume) 2025 & 2033
- Figure 33: Japan APAC Offshore Support Market Revenue Share (%), by Export Market Analysis (Value & Volume) 2025 & 2033
- Figure 34: Japan APAC Offshore Support Market Revenue (billion), by Price Trend Analysis 2025 & 2033
- Figure 35: Japan APAC Offshore Support Market Revenue Share (%), by Price Trend Analysis 2025 & 2033
- Figure 36: Japan APAC Offshore Support Market Revenue (billion), by Country 2025 & 2033
- Figure 37: Japan APAC Offshore Support Market Revenue Share (%), by Country 2025 & 2033
- Figure 38: South Korea APAC Offshore Support Market Revenue (billion), by Production Analysis 2025 & 2033
- Figure 39: South Korea APAC Offshore Support Market Revenue Share (%), by Production Analysis 2025 & 2033
- Figure 40: South Korea APAC Offshore Support Market Revenue (billion), by Consumption Analysis 2025 & 2033
- Figure 41: South Korea APAC Offshore Support Market Revenue Share (%), by Consumption Analysis 2025 & 2033
- Figure 42: South Korea APAC Offshore Support Market Revenue (billion), by Import Market Analysis (Value & Volume) 2025 & 2033
- Figure 43: South Korea APAC Offshore Support Market Revenue Share (%), by Import Market Analysis (Value & Volume) 2025 & 2033
- Figure 44: South Korea APAC Offshore Support Market Revenue (billion), by Export Market Analysis (Value & Volume) 2025 & 2033
- Figure 45: South Korea APAC Offshore Support Market Revenue Share (%), by Export Market Analysis (Value & Volume) 2025 & 2033
- Figure 46: South Korea APAC Offshore Support Market Revenue (billion), by Price Trend Analysis 2025 & 2033
- Figure 47: South Korea APAC Offshore Support Market Revenue Share (%), by Price Trend Analysis 2025 & 2033
- Figure 48: South Korea APAC Offshore Support Market Revenue (billion), by Country 2025 & 2033
- Figure 49: South Korea APAC Offshore Support Market Revenue Share (%), by Country 2025 & 2033
- Figure 50: Australia APAC Offshore Support Market Revenue (billion), by Production Analysis 2025 & 2033
- Figure 51: Australia APAC Offshore Support Market Revenue Share (%), by Production Analysis 2025 & 2033
- Figure 52: Australia APAC Offshore Support Market Revenue (billion), by Consumption Analysis 2025 & 2033
- Figure 53: Australia APAC Offshore Support Market Revenue Share (%), by Consumption Analysis 2025 & 2033
- Figure 54: Australia APAC Offshore Support Market Revenue (billion), by Import Market Analysis (Value & Volume) 2025 & 2033
- Figure 55: Australia APAC Offshore Support Market Revenue Share (%), by Import Market Analysis (Value & Volume) 2025 & 2033
- Figure 56: Australia APAC Offshore Support Market Revenue (billion), by Export Market Analysis (Value & Volume) 2025 & 2033
- Figure 57: Australia APAC Offshore Support Market Revenue Share (%), by Export Market Analysis (Value & Volume) 2025 & 2033
- Figure 58: Australia APAC Offshore Support Market Revenue (billion), by Price Trend Analysis 2025 & 2033
- Figure 59: Australia APAC Offshore Support Market Revenue Share (%), by Price Trend Analysis 2025 & 2033
- Figure 60: Australia APAC Offshore Support Market Revenue (billion), by Country 2025 & 2033
- Figure 61: Australia APAC Offshore Support Market Revenue Share (%), by Country 2025 & 2033
- Figure 62: Singapore APAC Offshore Support Market Revenue (billion), by Production Analysis 2025 & 2033
- Figure 63: Singapore APAC Offshore Support Market Revenue Share (%), by Production Analysis 2025 & 2033
- Figure 64: Singapore APAC Offshore Support Market Revenue (billion), by Consumption Analysis 2025 & 2033
- Figure 65: Singapore APAC Offshore Support Market Revenue Share (%), by Consumption Analysis 2025 & 2033
- Figure 66: Singapore APAC Offshore Support Market Revenue (billion), by Import Market Analysis (Value & Volume) 2025 & 2033
- Figure 67: Singapore APAC Offshore Support Market Revenue Share (%), by Import Market Analysis (Value & Volume) 2025 & 2033
- Figure 68: Singapore APAC Offshore Support Market Revenue (billion), by Export Market Analysis (Value & Volume) 2025 & 2033
- Figure 69: Singapore APAC Offshore Support Market Revenue Share (%), by Export Market Analysis (Value & Volume) 2025 & 2033
- Figure 70: Singapore APAC Offshore Support Market Revenue (billion), by Price Trend Analysis 2025 & 2033
- Figure 71: Singapore APAC Offshore Support Market Revenue Share (%), by Price Trend Analysis 2025 & 2033
- Figure 72: Singapore APAC Offshore Support Market Revenue (billion), by Country 2025 & 2033
- Figure 73: Singapore APAC Offshore Support Market Revenue Share (%), by Country 2025 & 2033
- Figure 74: Indonesia APAC Offshore Support Market Revenue (billion), by Production Analysis 2025 & 2033
- Figure 75: Indonesia APAC Offshore Support Market Revenue Share (%), by Production Analysis 2025 & 2033
- Figure 76: Indonesia APAC Offshore Support Market Revenue (billion), by Consumption Analysis 2025 & 2033
- Figure 77: Indonesia APAC Offshore Support Market Revenue Share (%), by Consumption Analysis 2025 & 2033
- Figure 78: Indonesia APAC Offshore Support Market Revenue (billion), by Import Market Analysis (Value & Volume) 2025 & 2033
- Figure 79: Indonesia APAC Offshore Support Market Revenue Share (%), by Import Market Analysis (Value & Volume) 2025 & 2033
- Figure 80: Indonesia APAC Offshore Support Market Revenue (billion), by Export Market Analysis (Value & Volume) 2025 & 2033
- Figure 81: Indonesia APAC Offshore Support Market Revenue Share (%), by Export Market Analysis (Value & Volume) 2025 & 2033
- Figure 82: Indonesia APAC Offshore Support Market Revenue (billion), by Price Trend Analysis 2025 & 2033
- Figure 83: Indonesia APAC Offshore Support Market Revenue Share (%), by Price Trend Analysis 2025 & 2033
- Figure 84: Indonesia APAC Offshore Support Market Revenue (billion), by Country 2025 & 2033
- Figure 85: Indonesia APAC Offshore Support Market Revenue Share (%), by Country 2025 & 2033
- Figure 86: Rest of Asia Pacific APAC Offshore Support Market Revenue (billion), by Production Analysis 2025 & 2033
- Figure 87: Rest of Asia Pacific APAC Offshore Support Market Revenue Share (%), by Production Analysis 2025 & 2033
- Figure 88: Rest of Asia Pacific APAC Offshore Support Market Revenue (billion), by Consumption Analysis 2025 & 2033
- Figure 89: Rest of Asia Pacific APAC Offshore Support Market Revenue Share (%), by Consumption Analysis 2025 & 2033
- Figure 90: Rest of Asia Pacific APAC Offshore Support Market Revenue (billion), by Import Market Analysis (Value & Volume) 2025 & 2033
- Figure 91: Rest of Asia Pacific APAC Offshore Support Market Revenue Share (%), by Import Market Analysis (Value & Volume) 2025 & 2033
- Figure 92: Rest of Asia Pacific APAC Offshore Support Market Revenue (billion), by Export Market Analysis (Value & Volume) 2025 & 2033
- Figure 93: Rest of Asia Pacific APAC Offshore Support Market Revenue Share (%), by Export Market Analysis (Value & Volume) 2025 & 2033
- Figure 94: Rest of Asia Pacific APAC Offshore Support Market Revenue (billion), by Price Trend Analysis 2025 & 2033
- Figure 95: Rest of Asia Pacific APAC Offshore Support Market Revenue Share (%), by Price Trend Analysis 2025 & 2033
- Figure 96: Rest of Asia Pacific APAC Offshore Support Market Revenue (billion), by Country 2025 & 2033
- Figure 97: Rest of Asia Pacific APAC Offshore Support Market Revenue Share (%), by Country 2025 & 2033
List of Tables
- Table 1: Global APAC Offshore Support Market Revenue billion Forecast, by Production Analysis 2020 & 2033
- Table 2: Global APAC Offshore Support Market Revenue billion Forecast, by Consumption Analysis 2020 & 2033
- Table 3: Global APAC Offshore Support Market Revenue billion Forecast, by Import Market Analysis (Value & Volume) 2020 & 2033
- Table 4: Global APAC Offshore Support Market Revenue billion Forecast, by Export Market Analysis (Value & Volume) 2020 & 2033
- Table 5: Global APAC Offshore Support Market Revenue billion Forecast, by Price Trend Analysis 2020 & 2033
- Table 6: Global APAC Offshore Support Market Revenue billion Forecast, by Region 2020 & 2033
- Table 7: Global APAC Offshore Support Market Revenue billion Forecast, by Production Analysis 2020 & 2033
- Table 8: Global APAC Offshore Support Market Revenue billion Forecast, by Consumption Analysis 2020 & 2033
- Table 9: Global APAC Offshore Support Market Revenue billion Forecast, by Import Market Analysis (Value & Volume) 2020 & 2033
- Table 10: Global APAC Offshore Support Market Revenue billion Forecast, by Export Market Analysis (Value & Volume) 2020 & 2033
- Table 11: Global APAC Offshore Support Market Revenue billion Forecast, by Price Trend Analysis 2020 & 2033
- Table 12: Global APAC Offshore Support Market Revenue billion Forecast, by Country 2020 & 2033
- Table 13: Global APAC Offshore Support Market Revenue billion Forecast, by Production Analysis 2020 & 2033
- Table 14: Global APAC Offshore Support Market Revenue billion Forecast, by Consumption Analysis 2020 & 2033
- Table 15: Global APAC Offshore Support Market Revenue billion Forecast, by Import Market Analysis (Value & Volume) 2020 & 2033
- Table 16: Global APAC Offshore Support Market Revenue billion Forecast, by Export Market Analysis (Value & Volume) 2020 & 2033
- Table 17: Global APAC Offshore Support Market Revenue billion Forecast, by Price Trend Analysis 2020 & 2033
- Table 18: Global APAC Offshore Support Market Revenue billion Forecast, by Country 2020 & 2033
- Table 19: Global APAC Offshore Support Market Revenue billion Forecast, by Production Analysis 2020 & 2033
- Table 20: Global APAC Offshore Support Market Revenue billion Forecast, by Consumption Analysis 2020 & 2033
- Table 21: Global APAC Offshore Support Market Revenue billion Forecast, by Import Market Analysis (Value & Volume) 2020 & 2033
- Table 22: Global APAC Offshore Support Market Revenue billion Forecast, by Export Market Analysis (Value & Volume) 2020 & 2033
- Table 23: Global APAC Offshore Support Market Revenue billion Forecast, by Price Trend Analysis 2020 & 2033
- Table 24: Global APAC Offshore Support Market Revenue billion Forecast, by Country 2020 & 2033
- Table 25: Global APAC Offshore Support Market Revenue billion Forecast, by Production Analysis 2020 & 2033
- Table 26: Global APAC Offshore Support Market Revenue billion Forecast, by Consumption Analysis 2020 & 2033
- Table 27: Global APAC Offshore Support Market Revenue billion Forecast, by Import Market Analysis (Value & Volume) 2020 & 2033
- Table 28: Global APAC Offshore Support Market Revenue billion Forecast, by Export Market Analysis (Value & Volume) 2020 & 2033
- Table 29: Global APAC Offshore Support Market Revenue billion Forecast, by Price Trend Analysis 2020 & 2033
- Table 30: Global APAC Offshore Support Market Revenue billion Forecast, by Country 2020 & 2033
- Table 31: Global APAC Offshore Support Market Revenue billion Forecast, by Production Analysis 2020 & 2033
- Table 32: Global APAC Offshore Support Market Revenue billion Forecast, by Consumption Analysis 2020 & 2033
- Table 33: Global APAC Offshore Support Market Revenue billion Forecast, by Import Market Analysis (Value & Volume) 2020 & 2033
- Table 34: Global APAC Offshore Support Market Revenue billion Forecast, by Export Market Analysis (Value & Volume) 2020 & 2033
- Table 35: Global APAC Offshore Support Market Revenue billion Forecast, by Price Trend Analysis 2020 & 2033
- Table 36: Global APAC Offshore Support Market Revenue billion Forecast, by Country 2020 & 2033
- Table 37: Global APAC Offshore Support Market Revenue billion Forecast, by Production Analysis 2020 & 2033
- Table 38: Global APAC Offshore Support Market Revenue billion Forecast, by Consumption Analysis 2020 & 2033
- Table 39: Global APAC Offshore Support Market Revenue billion Forecast, by Import Market Analysis (Value & Volume) 2020 & 2033
- Table 40: Global APAC Offshore Support Market Revenue billion Forecast, by Export Market Analysis (Value & Volume) 2020 & 2033
- Table 41: Global APAC Offshore Support Market Revenue billion Forecast, by Price Trend Analysis 2020 & 2033
- Table 42: Global APAC Offshore Support Market Revenue billion Forecast, by Country 2020 & 2033
- Table 43: Global APAC Offshore Support Market Revenue billion Forecast, by Production Analysis 2020 & 2033
- Table 44: Global APAC Offshore Support Market Revenue billion Forecast, by Consumption Analysis 2020 & 2033
- Table 45: Global APAC Offshore Support Market Revenue billion Forecast, by Import Market Analysis (Value & Volume) 2020 & 2033
- Table 46: Global APAC Offshore Support Market Revenue billion Forecast, by Export Market Analysis (Value & Volume) 2020 & 2033
- Table 47: Global APAC Offshore Support Market Revenue billion Forecast, by Price Trend Analysis 2020 & 2033
- Table 48: Global APAC Offshore Support Market Revenue billion Forecast, by Country 2020 & 2033
- Table 49: Global APAC Offshore Support Market Revenue billion Forecast, by Production Analysis 2020 & 2033
- Table 50: Global APAC Offshore Support Market Revenue billion Forecast, by Consumption Analysis 2020 & 2033
- Table 51: Global APAC Offshore Support Market Revenue billion Forecast, by Import Market Analysis (Value & Volume) 2020 & 2033
- Table 52: Global APAC Offshore Support Market Revenue billion Forecast, by Export Market Analysis (Value & Volume) 2020 & 2033
- Table 53: Global APAC Offshore Support Market Revenue billion Forecast, by Price Trend Analysis 2020 & 2033
- Table 54: Global APAC Offshore Support Market Revenue billion Forecast, by Country 2020 & 2033
Frequently Asked Questions
1. What is the projected Compound Annual Growth Rate (CAGR) of the APAC Offshore Support Market?
The projected CAGR is approximately 4.2%.
2. Which companies are prominent players in the APAC Offshore Support Market?
Key companies in the market include Tidewater Inc, PACC Offshore Services Holdings Ltd, Kawasaki Kisen Kaisha Ltd*List Not Exhaustive, Solstad Offshore ASA, MMA Offshore Limited, Seacor Marine Holdings Inc, Nam Cheong Offshore Pte Ltd, Maersk Supply Services AS.
3. What are the main segments of the APAC Offshore Support Market?
The market segments include Production Analysis, Consumption Analysis, Import Market Analysis (Value & Volume), Export Market Analysis (Value & Volume), Price Trend Analysis.
4. Can you provide details about the market size?
The market size is estimated to be USD 25.5 billion as of 2022.
5. What are some drivers contributing to market growth?
4.; Increasing Offshore Exploration and Production Activities4.; Development of Offshore Wind Energy.
6. What are the notable trends driving market growth?
Anchor Handling Tug/Anchor Handling Towing Supply (AHT/AHTS) Vessels to Dominate the Market.
7. Are there any restraints impacting market growth?
4.; Rising Demand for Dynamic Positioning (DP) Drilling Rigs.
8. Can you provide examples of recent developments in the market?
In January 2022, TSS Pioneer, an offshore support vessel built by Vard at the Vung Tau shipyard in Vietnam, completed sea trials offshore Vietnam. The vessel will be delivered to Ta Shang Marine, a joint company owned by Mitsui O.S.K. Lines and Ta Tong Marine.
9. What pricing options are available for accessing the report?
Pricing options include single-user, multi-user, and enterprise licenses priced at USD 4750, USD 5250, and USD 8750 respectively.
10. Is the market size provided in terms of value or volume?
The market size is provided in terms of value, measured in billion.
11. Are there any specific market keywords associated with the report?
Yes, the market keyword associated with the report is "APAC Offshore Support Market," which aids in identifying and referencing the specific market segment covered.
12. How do I determine which pricing option suits my needs best?
The pricing options vary based on user requirements and access needs. Individual users may opt for single-user licenses, while businesses requiring broader access may choose multi-user or enterprise licenses for cost-effective access to the report.
13. Are there any additional resources or data provided in the APAC Offshore Support Market report?
While the report offers comprehensive insights, it's advisable to review the specific contents or supplementary materials provided to ascertain if additional resources or data are available.
14. How can I stay updated on further developments or reports in the APAC Offshore Support Market?
To stay informed about further developments, trends, and reports in the APAC Offshore Support Market, consider subscribing to industry newsletters, following relevant companies and organizations, or regularly checking reputable industry news sources and publications.
Methodology
Step 1 - Identification of Relevant Samples Size from Population Database


Step 2 - Approaches for Defining Global Market Size (Value, Volume* & Price*)

Note*: In applicable scenarios
Step 3 - Data Sources
Primary Research
- Web Analytics
- Survey Reports
- Research Institute
- Latest Research Reports
- Opinion Leaders
Secondary Research
- Annual Reports
- White Paper
- Latest Press Release
- Industry Association
- Paid Database
- Investor Presentations

Step 4 - Data Triangulation
Involves using different sources of information in order to increase the validity of a study
These sources are likely to be stakeholders in a program - participants, other researchers, program staff, other community members, and so on.
Then we put all data in single framework & apply various statistical tools to find out the dynamic on the market.
During the analysis stage, feedback from the stakeholder groups would be compared to determine areas of agreement as well as areas of divergence